I was just discussing this essay with a friend of mine @Ritwika Nandi and she raised a thoughtful question,
"I had a query regarding your causal chaining in Step 2. Uncertainty multiplies, so if each link in your causal chain has around 80 % confidence, a 5 step chain would have only 33 % confidence. Doesn't this mean that for any genuinely long term goal, your ladder will almost always conclude that the decay rate 'k' is too high to justify action?"
And I think that is a great point. The 0.8^5 result assumes each link is independent but in practice, links often share underlying drivers or measurements, introducing correlation. With positive correlation, multiplying 0.8’s can overstate the decay (i.e., you’re penalizing too much).
One fix I’d consider in Step 2 is information design: ask more proximal, higher-signal questions that minimize chain length and reuse evidence efficiently. Net effect → a smaller effective chain length and a more realistic, well-calibrated k.
And yeah, if independence does hold and the effective chain length really is long, then structure your portfolio accordingly... pick interventions with the lowest k.
This post is co-authored with Ben Garfinkel. It is cross-posted from the CEA blog. A PDF version can be found here.
Summary: Some strategic decisions available to the effective altruism m...
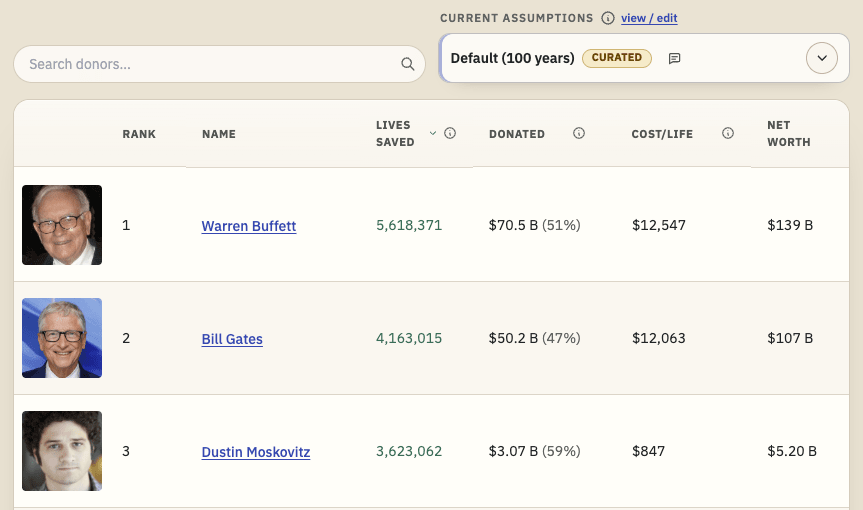
TL;DR: I'm releasing a website that ranks philanthropists according to EA principles and research, and allows users to re-rank the list using their own assumptions. I'd like feedback and help making it better. I'd especially like ideas for how to make the results more trustworthy. Funding may be available.
Crossposted to LessWrong.
...
Linkpost for my Substack piece, lightly adapted. Disagreement very welcome.
What happened
Coefficient Giving (cG) announced a $1 billion gift to GiveWell on 23rd July. This increases a previous commitment of $175m for 2026. cG say this could be a one-off surge, but it has implications for other donors either way. Both organisations...
Predictions fade with time, but that needn’t sink longtermism. We can measure how quickly skill decays, learn which ideas survive across contexts, and act where value persists. I propose an “evidence ladder”: run public, scored forecasts on near-term proxies; link them into causal chains; keep long-run commitments reversible unless they pass these tests. The resulting portfolio blends thin, option-preserving infrastructure with a few thick, sign-robust bets. My bridge complements the “forecast prospects” chapter by making horizon choice an empirical comparison.
Introduction
Even if our forecasting skill decays with time horizon, longtermist priorities can remain rational when: (i) payoff stakes grow or remain fat-tailed with horizon, (ii) we invest in discovery and error-correction that slows decay, and (iii) we select interventions whose effects are robust to model error. This reframes debates in Essays on Longtermism from "Is the far future knowable?" to "Under what empirical conditions does diminishing predictability stop dominating enormous stakes?" Greaves & MacAskill argue that effects on the very long run often dominate decision quality ex ante; Vivalt & Bernard ask whether forecasting those effects is feasible. This note offers a simple bridge between them [1,2].
A toy model.
Let forecast skill at horizon h years be s(h)∈ [0, 1], a discount on how much we should trust our predicted impact. Empirically(A1), skill often falls with horizon; take an exponential law
s(h)=e−kh,(k>0)
as a stand-in for worsening calibration, base-rate drift, and model misspecification. Let the stakes - the morally relevant payoff scale if we are directionally right - be X(h). For many technologies and institutional choices, the upside distribution is plausibly heavy-tailed(A2): the upper tail falls like x−α with α near 1−2, reflecting rare, enormous effects (e.g., locking in safer norms, preventing catastrophic pathways). Then an effective expected value of acting at horizon h behaves like:
EEV(h)∝s(h)⋅E[X(h)]
Two observations follow. First, if E[X(h)] grows with h (via compounding beneficiaries or lock-in), there exists a crossover horizon where rising stakes outpace decaying skill. Second, even without growth in the mean, fat tails imply that a small probability of transformative upside survives moderate decay. This formalizes a Greaves-MacAskill intuition, far-future effects can dominate even when near-term effects are clearer, while engaging Vivalt-Bernard's skepticism about predictability.
Assumptions:
s(h) is a reliability weight independent of X(h).
The average payoff E[X(h)] is finite.
Dependence risk. If higher-stakes opportunities are also systematically harder to forecast, then Cov(s(h),X(h))<0 and naive EEVs are biased up. The evidence-ladder below (adjudicated proxies → causal chains) is aimed at detecting such dependence before committing to long-horizon bets.
Where decay beats stakes (and where it does not).
If s(h)=e−kh and E[X(h)]∼Chβ (polynomial growth from cumulative beneficiaries), then EEV(h) peaks at finite h unless β is very large; exponential decay eventually wins. But if E[X(h)] grows roughly exponentially (e.g., safeguarding institutions that multiply future welfare potential by a fixed factor per generation), then for sufficiently small k, EEV(h)keeps rising, longtermism regains the upper hand. Under heavy tails, we need not assume growth: the expected maximum of opportunities discovered over time can itself climb, keeping EEV(h) competitive despite decay. The point is not that far horizons always dominate; it is that whether they do is an empirical matter about k and the tail/trajectory of X(h), not a purely philosophical stalemate.
What slows decay k?
Vivalt & Bernard synthesize evidence that near-term forecasting can be informative yet fragile under domain shift [2]. Their core challenge: domain shift erodes our ability to chain inferences across time. Vivalt’s meta-analyses show substantial effect heterogeneity and limited cross-context predictability for welfare interventions, which in our terms corresponds to a steep, domain-specific decay—the kind of empirically measured k that would caution against confident multi-decade extrapolations in this area [12,15].
Three levers can flatten the decay curve: (1) adjudication and scorekeeping on medium-term proxies (5-10 years) to learn which model classes generalize; (2) institutional memory that preserves and iterates on what worked (reducing misspecification churn); and (3) error-correcting institutions (red-teaming, replication markets) that clip overconfident tails.
From principle to portfolio
Greaves & MacAskill's strong longtermism is often read as a mandate for 'thick' bets with speculative upside [3]. A decay-aware reading instead favors a barbell of (A) thin, reversible commitments that preserve option value (standards, archives, forecasting infrastructure), and (B) select thick bets whose sign is robust to model error (e.g., reducing extinction risks, strengthening widely endorsed guardrails).
A 3-step evidence ladder (earn your right to extrapolate)
Longtermists should earn their right to reason about distant horizons by progressively validating models across nearer ones. A practical “evidence ladder” could look like this:
Step 1 (Near-term): Run public, adjudicated forecasts on policy and tech proxies that plausibly mediate long-run outcomes (biosecurity standards adoption, safety-relevant compute governance, durability of archiving norms). Score with proper rules and publish track records. Step 2 (Medium-term): Chain questions into causal series so that resolution of earlier nodes updates later beliefs (e.g., 'standard X adopted by Y countries by 2030' → 'lab-incident reporting coverage by 2035'). This quantifies k for your domain by observing how Brier/log skill degrades across steps. Step 3 (Long-term): Where direct resolution is impossible, enforce proxy-anchored commitments: interventions must (i) win on Steps 1-2, (ii) be sign-robust under moral uncertainty, and (iii) include sunset and review clauses. If an idea cannot clear Steps 1-2, the implied k is too high for deference.
So, what? If decay is flat in a domain, push horizons; if steep, build reversibility and shorter feedback loops.
Objections (brief)
Cluelessness: We sidestep by investing in information production that directly lowers k. The worry that we are “clueless” about long-run effects weakens once we see ignorance as a measurable quantity. By running medium-term tests, we directly reduce uncertainty rather than hand-wave around it.
Fanaticism: Fat tails are tamed by sign-robustness constraints and institutionalized red teams. Heavy-tailed outcomes tempt fanaticism: infinite payoffs justify any gamble. The cure is to prioritize sign-robust interventions (those beneficial under multiple moral and empirical views) and to bound confidence through institutionalized skepticism.
Democratic legitimacy: Barrett & Schmidt [14] note a legitimacy challenge for longtermism: acting for non-voters on the basis of hard-to-verify forecasts. Three responses follow our framework: (a) Procedural transparency: the three-step evidence ladder creates auditable scorecards and public track records; (b) Value overlap: keep “thin,” option-preserving commitments (archives, standards, forecasting infrastructure) and reserve “thick” bets for broadly endorsed priorities like catastrophe avoidance and basic rights; (c) Reversibility: long-horizon commitments include review-and-sunset clauses so future citizens inherit options, not fait accompli. The aim isn’t to dissolve the tension, but to earn legitimacy through transparent, error-correcting, and revisable processes. (d) Periodic citizens’ review tied to the ladder: every 8–10 years, a stratified citizens’ jury reviews scorecards from Steps 1–2 and can renew, tighten, or sunset thick commitments; this links technocratic forecasts to public authorization.
Upshot
Longtermism does not require confident point predictions about the year 3000. It requires (a) recognizing that some stakes scale faster than our ignorance, (b) measuring how fast our ignorance grows in domains we care about, and (c) building procedures that slow that growth. The strongest case for longtermism is not "we can precisely forecast the far future," but "we can learn fast enough in the near and medium term to justify safeguarding the far future.''
Numerical Illustrations
Polynomial Stakes vs. Exponential Decay
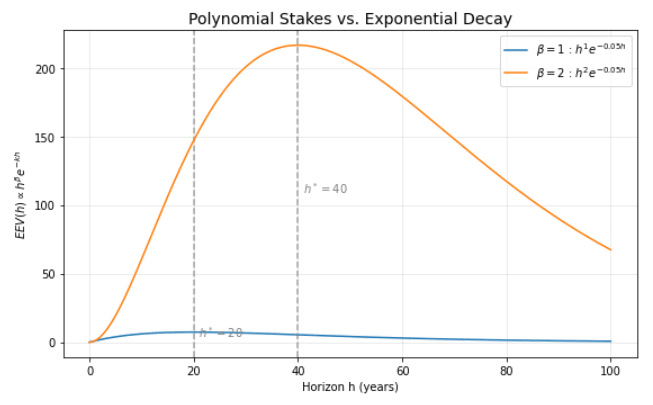
Assume skill s(h)=e−kh with k=0.05 and stakes E[X(h)]=Chβ (set C=1 for units). Then
EEV(h)∝hβ⋅e−0.05h
The theoretical peak occurs at h∗=β/k, for β>0, so h∗=20 years for β=1 and h∗=40 for β=2. Concrete values:
Horizon h (years)
10
20
40
60
β=1:he−0.05h
6.07
7.36
5.41
2.99
β=2:h2e−0.05h
60.65
147.15
216.54
179.23
Interpretation: with only polynomial growth in stakes, EEV(h) rises up to h∗ and then falls-decay eventually dominates.
Polynomial Stakes vs. Exponential Decay [13]
Exponential Stakes vs Exponential Decay
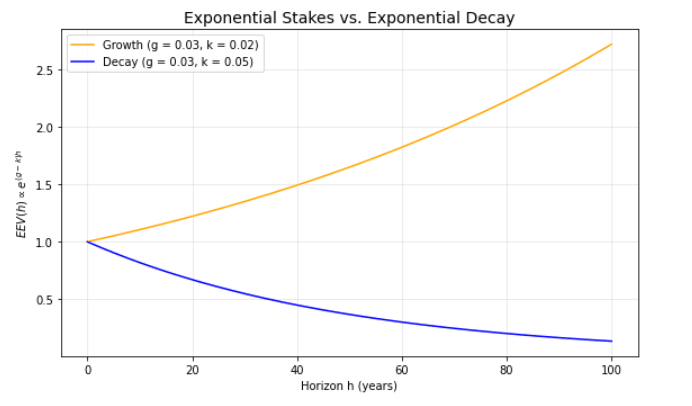
Let stakes grow at rate g per year: E[X(h)]∝egh, so
EEV(h)∝e(g−k)h
The condition is crisp: if g>k the curve rises with h, if g=k it is flat, and if g<k it declines. Numbers below are normalized to 1 at h=0.
Case
h = 25
h = 50
h = 75
h = 100
g=0.03,k=0.02,(growth)
1.28
1.65
2.12
2.72
g=0.03,k=0.05,(decay)
0.61
0.37
0.22
0.14
Interpretation: a measured “stake growth rate” that exceeds the skill decay rate g>k yields increasing long-horizon value.
Exponential Stakes vs. Exponential Decay [13]
3. Fat-tail / discovery-style intuition with a simple Bernoulli model
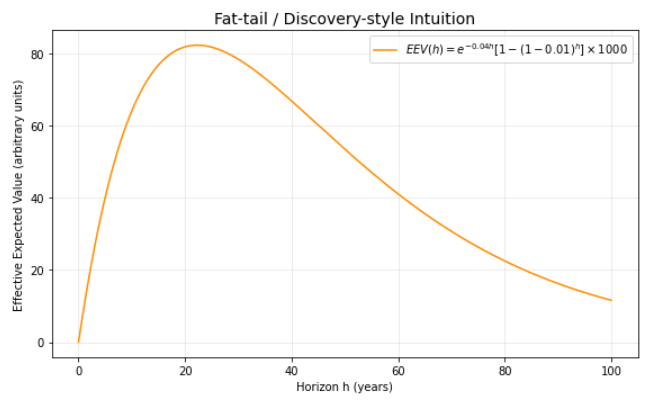
To illustrate how rare, very large opportunities can offset decay, suppose: each year there is an independent probability p=1% of discovering a highly leveraged intervention with payoff L=1000 (arbitrary units). The chance of at least one discovery by year h is 1−(1−p)h. With k=0.04, the effective value is
EEV(h)=e−0.04h[1−(1−0.01)h]⋅1000
Selected horizons:
h(y)
10
25
50
75
100
1−(1−p)h,(discoveryprob.)
0.096
0.222
0.395
0.529
0.634
e−0.04h,(skill)
0.670
0.368
0.135
0.050
0.018
EEV(h)
64.10
81.73
53.46
26.36
11.61
Interpretation: even as skill decays, the rising probability of hitting a large-payoff opportunity can produce a mid-horizon peak (here around 25y). Different (p,L,k) triplets shift the peak left/right.
Discovery-style Intuition [13]
Takeaway. These examples make the central point operational: whether long-run work “wins” is an empirical question about (i) how fast skill decays k, (ii) how stakes grow or how heavy the tails are (g, β, or rare-event parameters like p,L). Measure k on chained, adjudicated questions; estimate stake growth or tail-heaviness with appropriate proxies; then target horizons and interventions accordingly.
(I remain open to feedback and will continue refining these arguments.)
Notes
A1) Forecast-skill decay with horizon. Across diverse domains, forecast accuracy reliably declines as the time horizon lengthens, due to error growth, parameter drift, and model misspecification. Evidence spans: (i) large geopolitical forecasting tournaments showing worsening Brier/log scores with longer time-to-deadline; (ii) global time-series competitions (M4) where error metrics rise monotonically with lead time; (iii) meteorology’s practical deterministic limit of ∼10−14 days; and (iv) infectious-disease forecast hubs where weighted interval scores degrade with horizon. [8,9,10,11]
A2) Fat-tails. For many socio-technical outcomes relevant to longtermism, empirical payoff distributions are heavy-tailed and often compatible with power-law behavior above a thresholdxmin. In several well-studied domains e.g., conflict/severity, natural-hazard and pandemic fatalities, published tail estimates frequently lie in the ballpark α∼1.5−1.8; for upside distributions in innovation and economic returns, heavy-tailed or cutoff models are also common. [4,5,6,7]
Reflections/Extensions
Is k learnable (and worth learning)? Rather than argue in the abstract, I want to measure k in s(h)=e−kh. Evidence from cash-transfer meta-analyses (big heterogeneity; domain shift) nudges me toward treating k as empirical, not assumed [12].
A concrete test (domain-specific example). Use retrospective panels from forecasting platforms that tracked AI capability proxies (e.g., benchmark performance) to estimate k: compare 2010 predictions to 2020 outcomes, 2015 predictions to 2025 outcomes, etc. For each question, record when the forecast was made, when it resolved, how it scored at resolution (using a proper scoring rule), and a few basic tags (domain, binary vs.\ continuous, individual vs.\ aggregate). Convert scores to a simple “reliability” scale and plot reliability against lead time to see how skill changes with horizon. The goal is not to assume predictability, but to measure it—and then let those estimates inform how far ahead governance plans should reach and how much reversibility or review they should build in.
References/Sources
Greaves, Hilary, Jacob Barrett, and David Thorstad (eds), Essays on Longtermism: Present Action for the Distant Future (Oxford, 2025; online edn, Oxford Academic, 18 Aug. 2025), https://doi.org/10.1093/9780191979972.001.0001, accessed 1 Oct. 2025.
Rhys Bernard, David, and Eva Vivalt, 'What Are the Prospects of Forecasting the Far Future?', in Hilary Greaves, Jacob Barrett, and David Thorstad (eds), Essays on Longtermism: Present Action for the Distant Future (Oxford, 2025; online edn, Oxford Academic, 18 Aug. 2025), https://doi.org/10.1093/9780191979972.003.0012, accessed 1 Oct. 2025.
Greaves, Hilary, and William MacAskill, 'The Case for Strong Longtermism', in Hilary Greaves, Jacob Barrett, and David Thorstad (eds), Essays on Longtermism: Present Action for the Distant Future (Oxford, 2025; online edn, Oxford Academic, 18 Aug. 2025), https://doi.org/10.1093/9780191979972.003.0003, accessed 15 Oct. 2025.
Clauset, Aaron, Cosma Rohilla Shalizi, and M. E. J. Newman, ‘Power-law Distributions in Empirical Data’, arXiv arXiv:0706.1062 (first posted 7 Jun. 2007; last revised 2 Feb. 2009), https://doi.org/10.48550/arXiv.0706.1062, accessed 10 Oct. 2025.
Clauset, Aaron, ‘Trends and Fluctuations in the Severity of Interstate Wars’, Science Advances, 4/2 (2018), eaao3580, https://doi.org/10.1126/sciadv.aao3580, accessed 10 Oct. 2025.
Cirillo, Pasquale, and Nassim Nicholas Taleb, ‘Tail Risk of Contagious Diseases’, Nature Physics, 16 (2020), 606–613, https://doi.org/10.1038/s41567-020-0921-x, accessed 10 Oct. 2025.
Tetlock, Philip E., Expert Political Judgment: How Good Is It? How Can We Know? (Princeton: Princeton University Press, 2005), accessed 10 Oct. 2025.
Makridakis, Spyros, Evangelos Spiliotis, and Vassilios Assimakopoulos, “The M4 Competition: 100,000 Time Series and 61 Forecasting Methods,” International Journal of Forecasting, 36(1) (2020), 54–74, https://doi.org/10.1016/j.ijforecast.2019.04.014, accessed 10 Oct. 2025.
Buizza, Roberto, and Martin Leutbecher, “The Forecast Skill Horizon,” in Predictability of Weather and Climate (2nd ed.), Cambridge: Cambridge University Press, 2015; online edn, ECMWF, https://www.ecmwf.int/en/elibrary/73843-forecast-skill-horizon, accessed 10 Oct. 2025.
Reich, Nicholas G., et al., “A Collaborative Multiyear, Multimodel Assessment of Seasonal Influenza Forecasting in the U.S.,” Proceedings of the National Academy of Sciences (PNAS), 116(8) (2019), 3146–3154, https://doi.org/10.1073/pnas.1812594116, accessed 10 Oct. 2025.
Eva Vivalt, How Much Can We Generalize From Impact Evaluations?, Journal of the European Economic Association, Volume 18, Issue 6, December 2020, Pages 3045–3089, https://doi.org/10.1093/jeea/jvaa019
Schmidt, Andreas T, and Jacob Barrett, 'Longtermist Political Philosophy: An Agenda for Future Research', in Hilary Greaves, Jacob Barrett, and David Thorstad (eds), Essays on Longtermism: Present Action for the Distant Future (Oxford, 2025; online edn, Oxford Academic, 18 Aug. 2025), https://doi.org/10.1093/9780191979972.003.0030, accessed 19 Oct. 2025.

I was just discussing this essay with a friend of mine @Ritwika Nandi and she raised a thoughtful question,
"I had a query regarding your causal chaining in Step 2. Uncertainty multiplies, so if each link in your causal chain has around 80 % confidence, a 5 step chain would have only 33 % confidence. Doesn't this mean that for any genuinely long term goal, your ladder will almost always conclude that the decay rate 'k' is too high to justify action?"
And I think that is a great point. The 0.8^5 result assumes each link is independent but in practice, links often share underlying drivers or measurements, introducing correlation. With positive correlation, multiplying 0.8’s can overstate the decay (i.e., you’re penalizing too much).
One fix I’d consider in Step 2 is information design: ask more proximal, higher-signal questions that minimize chain length and reuse evidence efficiently. Net effect → a smaller effective chain length and a more realistic, well-calibrated k.
And yeah, if independence does hold and the effective chain length really is long, then structure your portfolio accordingly... pick interventions with the lowest k.