AGB 🔸
Posts 5
Comments308
Note that a world where Insect suffering is 50% to be 10,000x as important as human suffering, and 50% to be 0.0001x as important as human suffering, is also a world where you can say exactly the same thing with humans and insects reversed.
That should make it clear that the ‘in expectation, [insects are] 5000x more important’ claim that follows is false, or more precisely requires additional assumptions.
This is the type of argument I was trying to eliminate when I wrote this:
https://forum.effectivealtruism.org/posts/atdmkTAnoPMfmHJsX/multiplier-arguments-are-often-flawed
Thanks for this. I already had some sense that historical productivity data varied, but this prompted me to look at how large those differences are and they are bigger than I realised. I made an edit to my original comment.
TL;DR: Current productivity people mostly agree about. Historical productivity they do not. Some sources, including those in the previous comment, think Germany was more productive than the US in the past, which makes being less productive now more damning compared to a perspective where this has always been the case.
***
For simplicity I'm going to focus on US vs. Germany in the first three bullets:
- I struggle to find sources claiming a large gap in current productivity between the US and Germany.
- Our World in Data shows 7%
- The Banque France report you linked shows 8%
- Wikipedia gives two sources:
- The OECD, which shows 1%
- The ILO, which shows 2%
- The Bergeund report you linked to shows what appears to be ~5%[1]
- However, historical productivity estimates vary much more significantly.
- Some, like Our World in Data, show German productivity below US productivity near-continuously, e.g. 6% lower in 1995.
- Some sources claim Germany had higher productivity 20+ years ago, and combined with the slightly lower present productivity that everybody agrees on that can imply noticeably lower growth:
- If you look at the charts in the Banque France report you can see an example of this, with German productivity given as 3% higher in 2000.
- A striking example is the OECD, which puts German productivity >10% higher in 1995.[2]
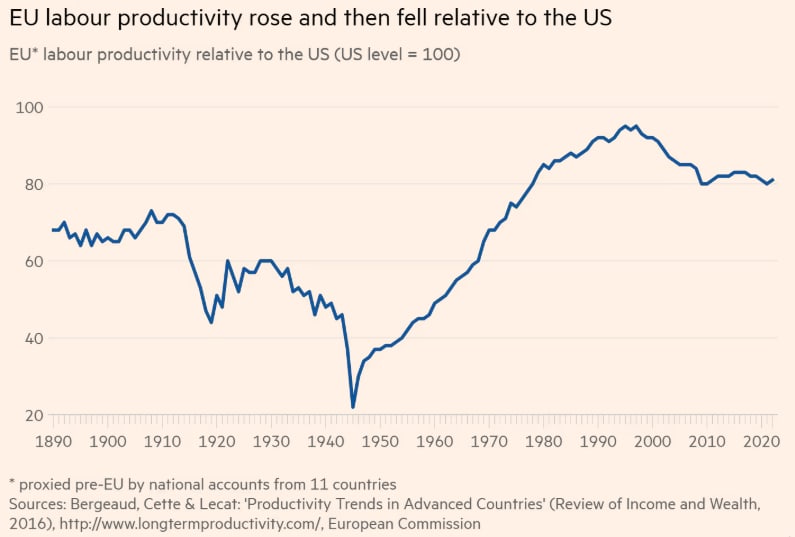
- The Bergeund report, which is also the source for a chart from Draghi's report - shown below - has around 8% higher German productivity in 1995.
- So there are two competing stories, which I don't know how to adjudicate between:
- German productivity used to be slightly higher than US productivity, but is now slightly lower.
- German productivity has always been slightly lower than US productivity.
- German productivity is higher than EU productivity as a whole, by a factor of roughly 1.15x.
- So you can substitute 'slightly higher' for 'slightly lower' and 'slightly lower' for 'significantly lower' in (3), producing two parallel competing stories for the EU as a whole.
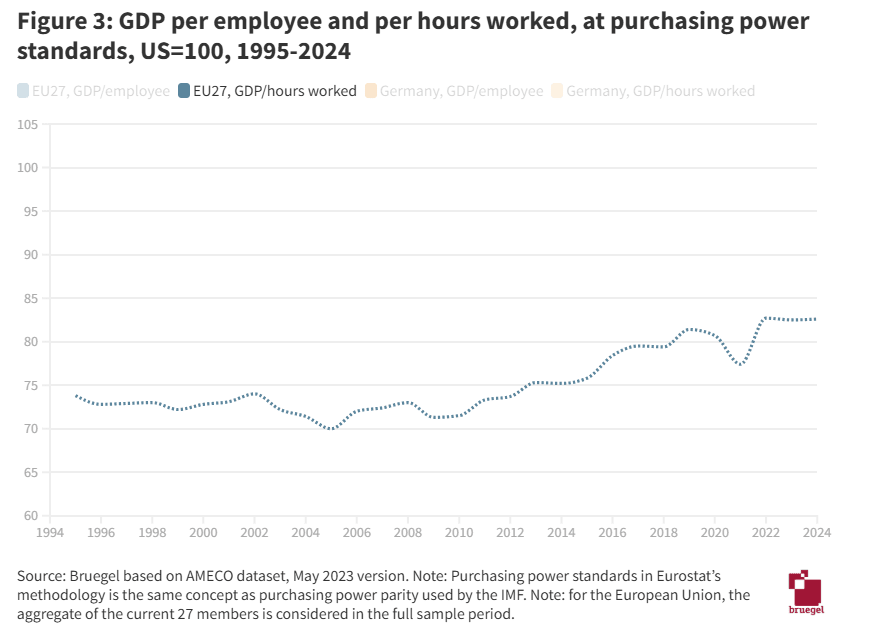
- This link, with chart copied below as 'Figure 3', is an example of the 'EU productivity has always been significantly lower than US productivity' story.
- Note also that this chart agrees with Bergeund/Draghi - chart also below - about the current state; they both show EU-wide productivity at around 82% of US productivity in the present day. It's the 90s that they sharply disagree about, where one graph shows 74% and the other shows 95%, almost a 1.3x gap.
****
Where does that leave the conversation about European regulation? This is just my $0.02, but:
In my opinion the large divergences of opinion about the 90s, while academically interesting, are only indirectly relevant to the situation today. The situation today seems broadly accepted to be as follows:
- Western and Northern EU countries - Germany, Austria, France, Netherlands, Belgium, Luxembourg, Denmark, Norway, Sweden - have very similar productivity to the US.
- Eastern EU countries - mostly ex-USSR countries - have much lower productivity, but are catching up fast.
- Southern EU countries, e.g. Italy/Spain/Greece, have been languishing.
- (Incidentally, so has the UK. I started to look at this when trying to understand how UK productivity compared to other countries, and was surprised to learn that the gap vs. nearby European countries was very similar to the gap vs. the US.)
- Creating an average productivity of around 82% of the US level
I think that when Americans think about European regulations, they are mostly thinking about the Western and Northern countries. For example, when I ask Claude which EU countries have the strongest labour rights, the list of countries it gives me is entirely a subset of those countries. But unless you think replacing those regulations with US-style regulations would allow German productivity to significantly exceed US productivity, any claim that this would close the GDP per capita gap between the US and Germany - around 1.2x - without more hours being worked is not very reasonable. Let alone the GDP gap, which layers on the US' higher population growth.
Digging into Southern Europe and figuring out why e.g. Italy and Germany have failed to converge seems a lot more reasonable. Maybe regulation is part of that story. I don't know.
So I land pretty much where the Economist article is, which is why I quoted it:
But in aggregate, western Europeans get just as much out of their labour as Americans do. Narrowing the gap in total GDP would require additional working hours, either via immigration or by raising the amount of time citizens spend on the job.
- ^
I am eyeballing at page 66 and adding together 'TFP' and 'capital deepening' factors. I think that amounts to labour productivity, and indeed the report does say "labour productivity...ie the product of TFP and capital deepening". Less confident about this than the other figures though.
- ^
Unhelpfully, the data is displayed as % of 2015 productivity. I'm getting my claim from (a) OECD putting German 1995 productivity at 80% of 2015 levels, vs. the US being at 70% of 2015 levels and (b) 2022 productivity being 107% vs. 106% of 2022 levels. Given the OECD has 2022 US/German productivity virtually identical, I think the forced implication is that they think German productivity was >10% higher in 1995.
Just to respond to a narrow point because I think this is worth correcting as it arises: Most of the US/EU GDP growth gap you highlight is just population growth. In 2000 to 2022 the US population grew ~20%, vs. ~5% for the EU. That almost exactly explains the 55% vs. 35% growth gap in that time period on your graph; 1.55 / 1.2 * 1.05 = 1.36.
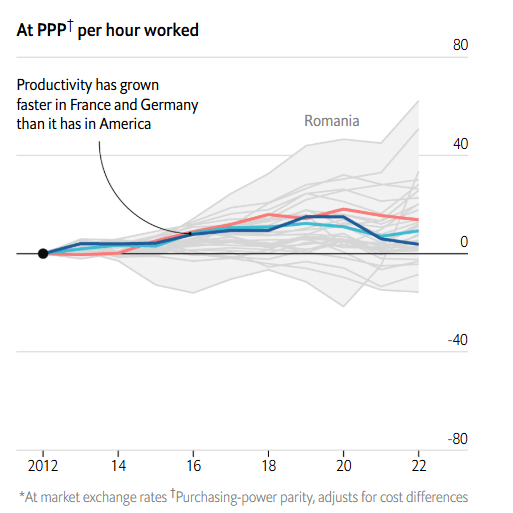
This shouldn't be surprising, because productivity in the 'big 3' of US / France / Germany track each other very closely and have done for quite some time. (Edit: I wasn't expecting this comment to blow up, and it seems I may have rushed this point. See Erich's comment below and my response.) Below source shows a slight increase in the gap, but of <5% over 20 years. If you look further down my post the Economist has the opposing conclusion, but again very thin margins. Mostly I think the right conclusion is that the productivity gap has barely changed relative to demographic factors.
I'm not really sure where the meme that there's some big / growing productivity difference due to regulation comes from, but I've never seen supporting data. To the extent culture or regulation is affecting that growth gap, it's almost entirely going to be from things that affect total working hours, e.g. restrictions on migration, paid leave, and lower birth rates[1], not from things like how easy it is to found a startup.
But in aggregate, western Europeans get just as much out of their labour as Americans do. Narrowing the gap in total GDP would require additional working hours, either via immigration or by raising the amount of time citizens spend on the job.
- ^
Fertility rates are actually pretty similar now, but the US had much higher fertility than Germany especially around 1980 - 2010, converging more recently, so it'll take a while for that to impact the relative sizes of the working populations.
Re. 2, that maths is the right ballpark is trying to save but if donating I do want to remind people that UK donations are tax-deductible and this deduction is not limited the way I gather it is in some countries like the US.
So you wouldn’t be paying £95k in taxes if donating a large fraction of £250k/yr. Doing quick calcs, if living off £45k then the split ends up being something like:
Income: 250k
Donations: 185k
Tax: 20k
Personal: 45k
(I agree with the spirit of your points.)
PS- Are donations tax deductible in the UK (Besides giftaid)? I've been operating on the assumption that they aren't, but if they were, I could give more.
I think the short answer is 'depends what you mean?'. Longer answer:
- Income tax is fully tax deductible. But if you are a basic rate (20%) taxpayer, this is what Gift Aid is handling and there isn't much further to do. If you are a higher or additional (40% or 45%) taxpayer then there is additional relief you can claim.
- This post goes into more detail on this.
- National Insurance is not deductible.
- Some pseudo-taxes on higher earners care about Adjusted Net Income. Confusingly, ANI is not your after-tax income, it's roughly your Gross Income minus Pension Contributions minus Donations; more detail at link. So donations do reduce this. Things which care about ANI:
- Higher Income Child Benefit Charge
- If you have children, this kicks in as your ANI goes from £60k to £80k.
- Withdrawal of the Personal Allowance
- This kicks in as your ANI goes from £100k to £125k.
- 30 hours 'free' Childcare / Tax Free Childcare
- These are withdrawn entirely if your ANI exceeds £100k.
- Note this is a cliff edge not a taper, and if it applies to you you are probably thousands worse off just above £100k ANI vs. just below. Bizarrely this means donating money can leave you better off.
- Higher Income Child Benefit Charge
Stylistically, some commenters don't seem to understand how this differs from a normal cause prioritisation exercise. Put simply, there's a difference between choosing to ignore the Drowning Child because there are even more children in the next pond over, and ignoring the drowning children entirely because they might grow up to do bad things. Most cause prioritisation is the former, this post is the latter.
As for why the latter is a problem, I agree with JWS's observation that this type of 'For The Greater Good' reasoning leads to great harm when applied at scale. This is not, or rather should not be, hypothetical for EA at this point. No amount of abstract reasoning for why this approach is 'better' is going to outweigh what seems to me to be very clear empirical evidence to the contrary, both within EA and without.
Beyond that issue, it's pretty easy to identify any person, grant, or policy as plausibly-very-harmful if you focus only on possible negative side effects, so you end up with motivated reasoning driving the answers for what to do.
For example, in this post Vasco recommends:
In addition, I encourage people there to take uncertainty seriously, and, before significant further investigation, only support interventions which are beneficial in the nearterm accounting for effects on farmed animals.
But why stop at farmed animals? What about wild animals, especially insects? What about the long-term future? If taking Expected Total Hedonistic Utilitarianism seriously as Vasco does, I expect these effects to dominate farmed animals. My background understanding is that population increase leads to cultivation of land for farming and reduces wild animal populations and so wild animal suffering quite a bit.. So I could equivalently argue:
In addition, I encourage Vasco to take uncertainty seriously, and, before significant further investigation, only support interventions which are beneficial in the nearterm accounting for effects on wild animals.
These would then tend to be the opposite set of interventions to the prior set. It just goes round and round. I think there are roughly two reasonable approcahes here:
- Pick something that seems like a clear good - 'save lives', 'end factory farming', 'save the world' - and try to make it happen without tying yourself into knots about side-effects.
- Really just an extension of (1), but if you come across a side effect that worries you, add that goal as a second terminal goal and split your resources between the goals.
By contrast, if your genuine goal is to pick an intervention with no plausible chance of causing significant harm, and you are being honest with yourself about possible backfires, you will do nothing.
I appreciate you writing this up at the top level, since it feels more productive to engage here than on one of a dozen comment threads.
I have substantive and 'stylistic' issues with this line of thinking, which I'll address in separate comments. Substantively, on the 'Suggestions' section:
At the very least, I think GiveWell and Ambitious Impact should practice reasoning transparency, and explain in some detail why they neglect effects on farmed animals. By ignoring uncertain effects on farmed animals, GiveWell and Ambitious Impact are implicitly assuming they are certainly irrelevant.
Why? It seems clear that you aren't GiveWell's target audience. You know that, and they know that. Unless someone gives me a reason to think that Animal Welfare advocates were expecting to be served by GiveWell, I don't see any value in them clarifying something that seems fairly obvious.
In addition, I encourage people there to take uncertainty seriously, and, before significant further investigation, only support interventions which are beneficial in the nearterm accounting for effects on farmed animals.
Unless the differences on human welfare are incredibly narrow or the impacts on animal welfare are enormous, this seems like a very bad idea. In general, donating $100 to a charity with suboptimal impacts on human welfare but improved impacts on animal welfare is going to be strictly worse - for both human and animal welfare - than donating $90 to the best human welfare charity and $10 to the best animal welfare charity.
Similarly, investigating the exact size of the effects mostly seems like a waste of time to me. I wrote this up in more detail a few years ago; was addressing a longtermist cluelessness critique but you can pretty much cut/paste the argument. To save a click-through, the key passage is:
Similar thoughts would seem to apply to also other possible side-effects of AMF donations; population growth impacts, impacts on animal welfare (wild or farmed), etc. In no case do I have reason to think that AMF is a particularly powerful lever to move those things, and so if I decide that any of them is the Most Important Thing then AMF would not even be on my list of candidate interventions
GiveWell and Ambitious Impact could also offset the nearterm harm caused to farmed animals by funding the best animal welfare interventions. I calculate these are over 100 times as cost-effective as GiveWell’s top charities ignoring their effects on animals. If so, and some funding from GiveWell or Ambitious Impact is neutral due to negative effects on animals, these could be neutralised by donating less than 1 % (= 1/100) of that funding to the best animal welfare interventions.
Equally, GiveWell or AIM's donors can offset if they are worried about this. That seems much better than GiveWell making the choice for all their donors.
I think my if-the-stars-align minimum is probably around £45k these days. But then it starts going up once there are suboptimal circumstances like the ones you mention. In practice I might expect it to land at 125% to 250% of that figure depending how the non-salary aspects of the job look.
I'm curious about the motivation of the question; FWIW my figure here is a complicated function of my expenses, anticipated flexibility on those expenses, past savings, future plans, etc. in a way that I wouldn't treat it as much of a guide to what anyone else would or should say.
It does indeed depend a lot. I think the critical thing to remember is that the figure should be the minimum of what it costs to get a certain type of talent and how valuable that talent is. Clean Water is worth thousands of dollars per year to me, but if you turned up on my doorstep with a one-year supply of water for $1k I'd tell you to stop wasting my time because I can get it far more cheaply than that.
When assessing the cost of acquiring talent, the hard thing to track is how many people aren't in the pool of applicants at all due to funding constraints. That sounds like it's Abraham's position and I think it's more common than often given credit for; there's something very low-status in EA about saying 'I could be doing this more impactful thing, but I won't because it won't pay me enough'.
Funding isn't the only constraint on salaries of course; appearances matter too. Once your org is paying enough that you can't really pay more without getting a lot of sideways glances you don't want to get, that's when I would mostly stop calling you funding-constrained* and then I imagine this number can get really really high; cost of talent becomes ~infinite and we're back to looking at 'value'. Open Phil's hiring is perhaps in approximately that position.
If you are still in a position where you could raise salaries if it weren't for funding constraints, I tend to think this number struggles to make it out of low six figures. Possible exceptions are positions that want a very specific combination of skills and experiences, like senior leadership at central EA orgs.
*Assuming you are mostly turning money into people into impact, rather than e.g. money into nets into impact.
I believe this productivity puzzle turned out to be about current vs. constant prices:
AFAICT those sources are using 'constant prices'. The other sources, which show pretty much the same productivity gap over time, are using 'current prices'. I worked with Claude to summarise the differences, final summary from Claude copied below.
While I agree with Claude that both methods have issues, I do want to flag one particularly odd implication of constant prices, courtesy of this Twitter user; even if a statistical agency continuously sees French GDP-per-capita as 70-75% of the US level in the present-day; the over-time graph has US and France 'diverging' by changing the valuation of historical production to reflect modern-day prices.