
Max Ghenis
Bio
Participation2
I'm the co-founder and CEO of PolicyEngine, a tech nonprofit that computes the impacts of public policy (policyengine.org). I'm also the founder and president of the UBI Center, a think tank researching universal basic income policies (ubicenter.org).
I first got into EA in 2012: I worked at Google at the time, and Google.org made a grant to GiveDirectly. I've since taken the GWWC pledge and focused my giving on GiveDirectly and GiveWell. I was active in Google's EA group and also MIT's when I went there for grad school in 2020.
I'm also the founder of Ventura County YIMBY, and a volunteer California state coordinator for Citizens' Climate Lobby, a grassroots organization advocating for a national carbon fee-and-dividend policy.
Posts 5
Comments54
Topic contributions1
Thanks Tony! I built this as a side project with a fairly narrow scope — replicating the current GiveWell CEA specifically — so I'm not planning to extend it to other organizations myself. That said, the repo is open source and the model structure is modular, so if you or someone on your team wanted to add Fortify Health as a new charity module, I'd welcome a PR. Each charity is a self-contained TypeScript function, so adding one shouldn't require changes to the rest of the codebase.
Thanks for the suggestion! Currently, GiveCalc handles the charitable deduction value whether you donate cash or appreciated assets—you'd enter the fair market value of the assets as your donation amount. (One limitation is that we assume all donations are cash, which can be deducted up to 60% of AGI, while appreciated assets are limited to 30% of AGI.)
We could add functionality to compare scenarios, like donating an appreciated asset vs selling it and donating the after-tax proceeds. I've opened an issue to explore this: https://github.com/PolicyEngine/givecalc/issues/41
Could you help us understand your use case? When considering donating appreciated assets, would you want to:
- See the tax implications of donating at current market value, accounting for the 30% AGI limit?
- Compare with the scenario of selling the asset and paying capital gains tax?
- Something else?
Your thoughts on which calculations would be most helpful would be great to hear.
Hi, thanks for sharing this. I've long supported GiveDirectly's global programs, and agree that your work can help inform better policy in high-income countries as well. While I don't think direct transfers to Americans would come close to the GiveWell bar, I'd be interested in cost-effectiveness analyses of advocacy for policy reform. Some of the other comments on this post could also be useful for constructing such a BOTEC, and so I wanted to add some clarifications as well:
In 2019, poverty produced 183k deaths in the U.S. among people 15 years and older.
The linked study, titled "Novel Estimates of Mortality Associated With Poverty in the US," does not make a causal claim like this. Here's what it says:
In 2019, among those aged 15 years or older, 6.5% (95% CI, 4.1%-9.0%) of deaths and 183 003 deaths (95% CI, 116 173-254 507 deaths) were associated with current poverty, and 10.5% (95% CI, 6.9%-14.4%) of deaths and 295 431 deaths (95% CI, 193 652-406 007 deaths) were associated with cumulative poverty.
The causal effect is likely smaller. Furthermore, the study defines poverty as income below half the median income in each year, meaning it's not assessing the association between absolute living standards and mortality.
In 2022, the U.S. had the second highest poverty rate of any wealthy country [...]
Like the above study, the OECD defines poverty as income below half the median. So this is really a measure of inequality.
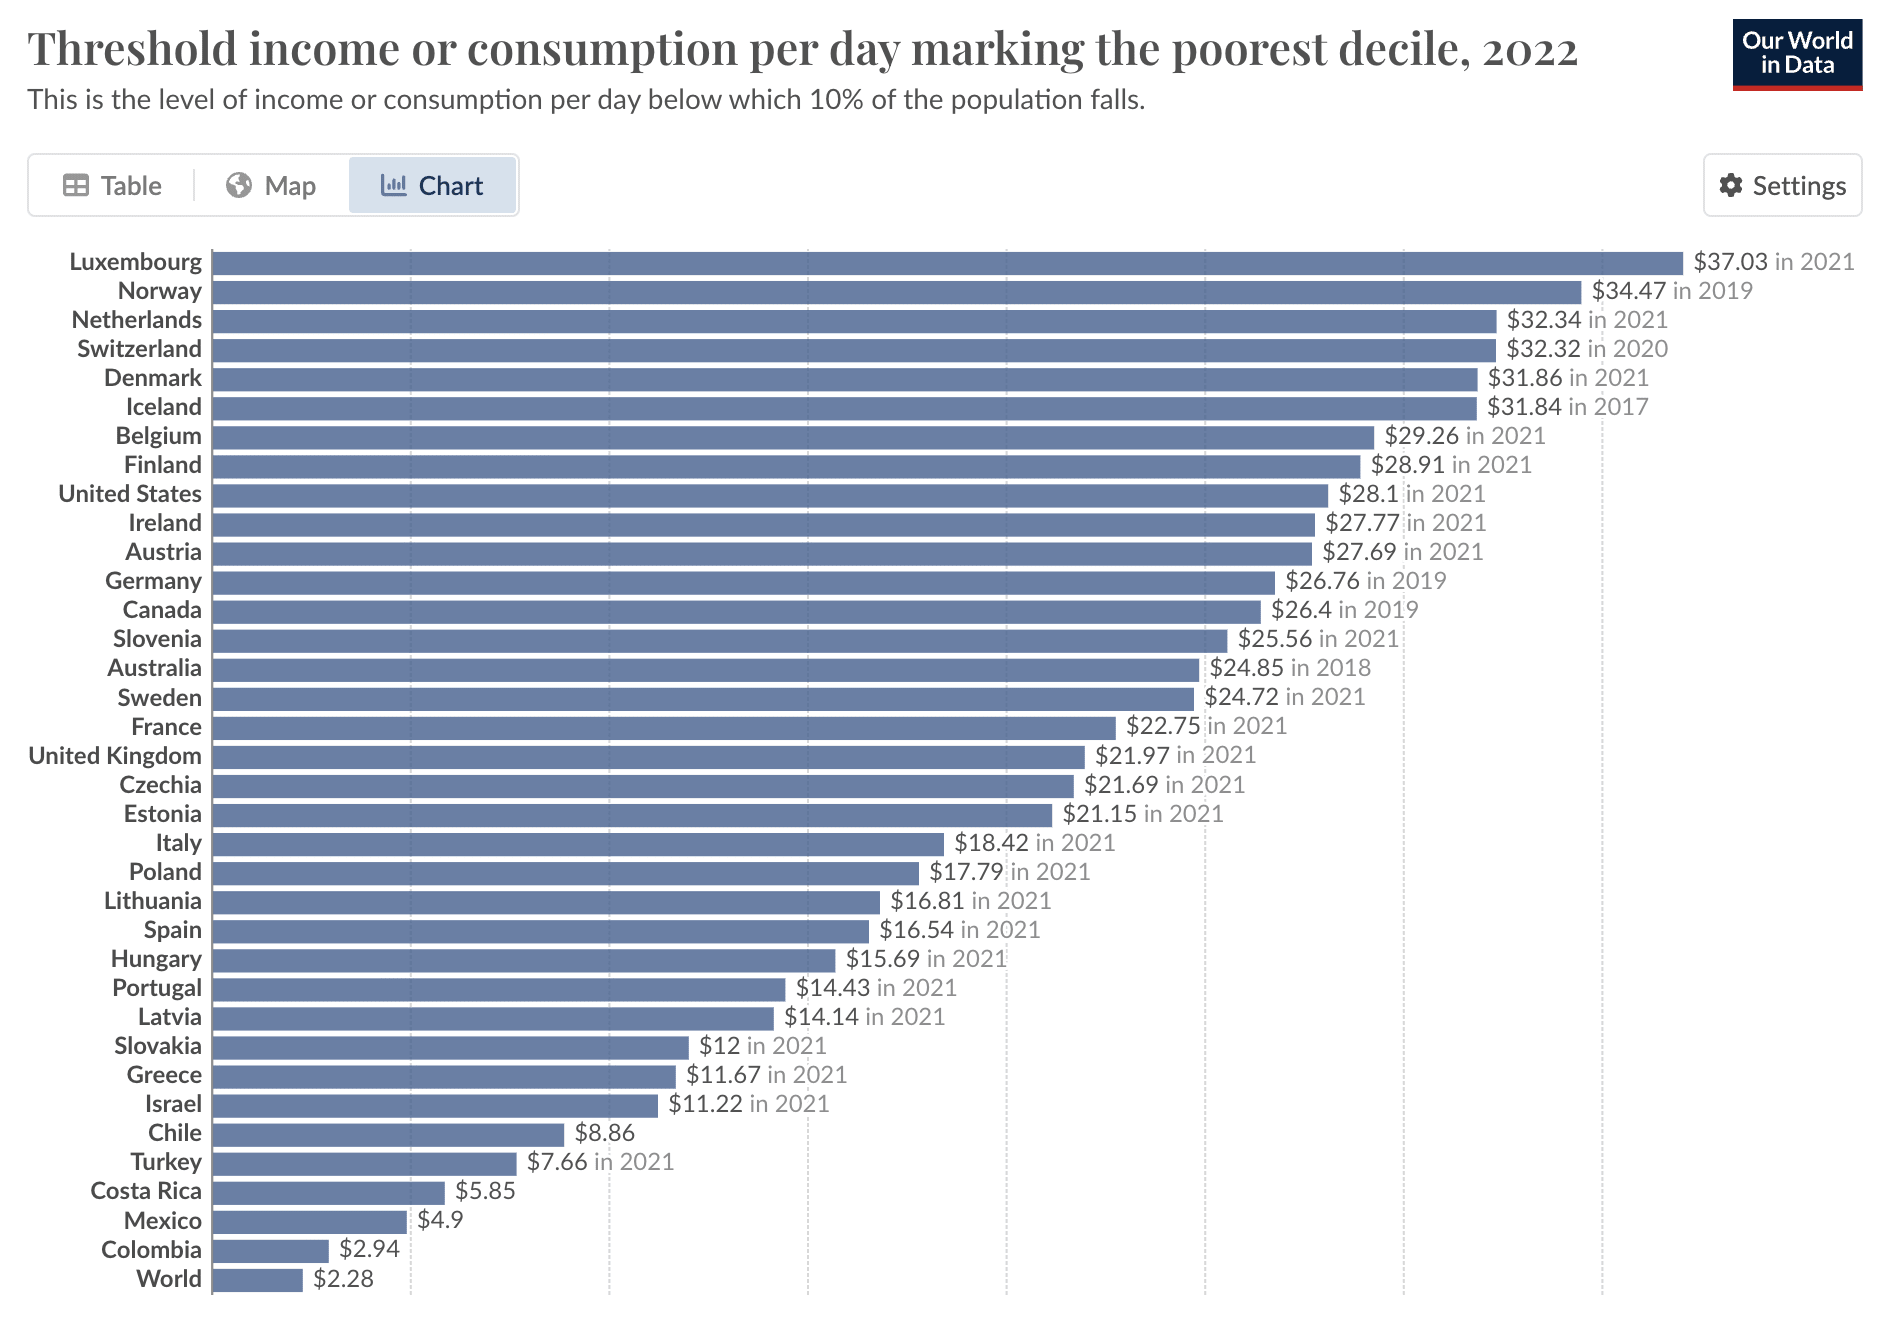
On a more absolute measure--the threshold of income marking the poorest decile, after taxes and benefits--the US ranks 9 of 35 OECD countries evaluated:
[...] poverty persists here despite the U.S. spending more on social programs than the average (see below).
My understanding is that the vast majority of that 22.7% of GDP is Social Security and Medicare. It also ignores the effect of taxes, and non-refundable credits like the bulk of the US Child Tax Credit, both of which can significantly affect low-income people (European countries rely more on consumption taxes, for instance).
Another way of assessing this is how much a country's inequality changes before and after taxes and transfers. Here the OECD ranks the US 31st of 37th in inequality reduction through redistribution.
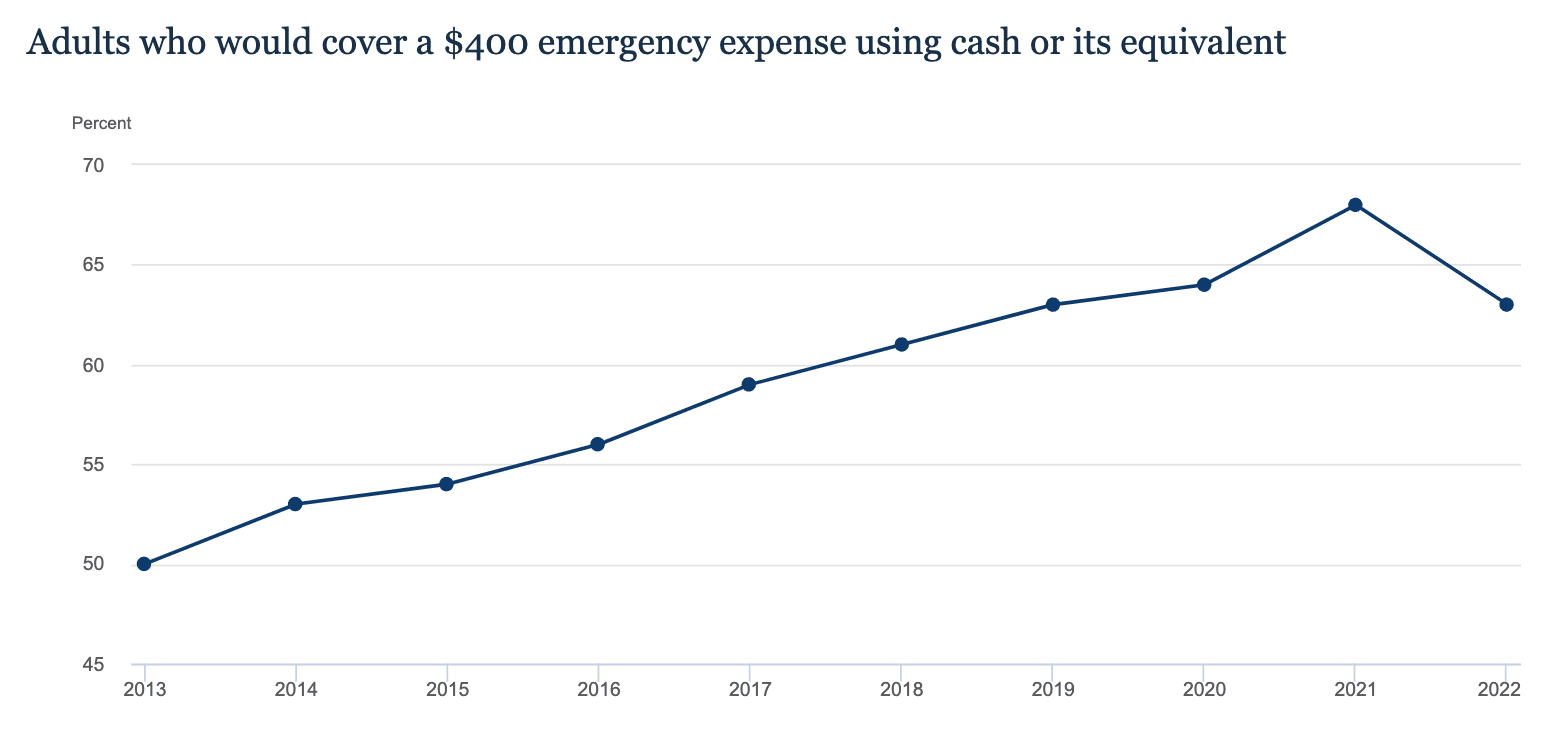
Between 2020 and 2021, [...] More than two-thirds of adults said they could cover an unexpected cost of $400, the highest rate recorded in the survey’s history.
This result mostly extends a long, steady trend of improvement.
Over a quarter of Americans living in deep poverty (again, less than half of the federal poverty line) are not enrolled in any federal safety net program. That means individuals making less than $3,600 a year are receiving no assistance from the government.
A few things here:
- The federal poverty line is $15,060 for a one-person household, so this describes people who are making less than $7,530 a year, not $3,600.
- That study uses data from 2012-14; many states have since expanded SNAP, for instance to remove asset limits.
- The study only considered six programs: SNAP, SSI, housing subsidies, TANF, WIC, and CCDF. Some people in deep OPM poverty may still receive Medicaid, Social Security, refundable tax credits, LIHEAP, state and local assistance programs, etc.
- SSI and TANF count as income when classifying people in poverty (and deep poverty) for the OPM, so this result is partly circular: people who, in part by virtue of not receiving those programs, are classified as in deep poverty, are tautologically less likely to receive those programs.
Again, I greatly appreciate the work you all do, and agree that US antipoverty advocacy is at least understudied in EA. As one example, the Baltimore Baby Bonus ballot measure campaign seems plausibly cost-effective, given the enormous returns to reducing infant poverty (as also motivates RxKids), and their lean, scalable operation. My nonprofit, PolicyEngine, provides free open-source software for analyzing antipoverty policies, and we'd be glad to help in any endeavor to study the impact of reforms. I hope my comments can expedite some work for an enterprising EA to dig further into this important area.
Are there plans to support OWID's explorer charts? For example this one doesn't render:
https://ourworldindata.org/explorers/poverty-explorer?tab=chart&time=latest&facet=none&country=USA~AUS~AUT~BEL~CAN~CHL~COL~CRI~CZE~DNK~EST~FIN~FRA~DEU~GRC~HUN~ISL~IRL~ISR~ITA~JPN~LVA~LTU~LUX~MEX~NLD~NOR~POL~PRT~SVK~KOR~SVN~SWE~CHE~ESP~TUR~GBR~OWID_WRL&Indicator=Income+or+consumption+of+the+poorest+10%25&Poverty+line=%242.15+per+day%3A+International+Poverty+Line&Household+survey+data+type=Show+data+from+both+income+and+consumption+surveys&Show+breaks+between+less+comparable+surveys=false
Screenshot:
Yeah both my cofounder Nikhil and I are longtime EAs :) We have a couple projects in the works on tying PolicyEngine to EA , which we'll probably launch in the next couple months.
Nikhil is actually in the UK as well (I'm in DC), so could you please connect him to the EAGx Cambridge folks? He's [email protected].
You can also use PolicyEngine UK (my nonprofit's free, open source web app) to estimate your taxes and benefits given your income and household characteristics. It captures nuances like the Child Benefit High Income Tax Charge and phase-outs of Universal Credit and the Personal Allowance, and shows your total marginal tax rate considering these factors.
You can also design custom policy reforms, and PolicyEngine estimates the impact, both on the UK and your own household.
Thanks Benita, really appreciate the field perspective. You're right that the parameters are a snapshot — the tool takes GiveWell's November 2025 spreadsheet values as given and doesn't attempt to model how they change over time. GiveWell updates their spreadsheets periodically as they get new data, and the tool would need to be re-extracted to reflect that.
On within-country variation, this is a real limitation. The model treats each country as a single unit with one set of parameters, but as you note, conditions in Sokoto vs. other parts of Nigeria can be very different. The sensitivity analysis helps show how much the result depends on any single parameter (like counterfactual coverage), but it doesn't capture the kind of correlated shifts you're describing where multiple parameters move together as systems evolve.
I built this as a side project to make GiveWell's existing estimates more explorable, not to improve on their parameter estimation — that's solidly their domain expertise. But the tool does make it easy to test "what if coverage in Zamfara drops by 10%" type questions, which I think is part of what you're getting at.