Hide table of contents

TLDR: On a VERY rough Sanity check[1], GiveWell’s New Incentives “lived saved” estimate seems  twice as high as is plausible. 

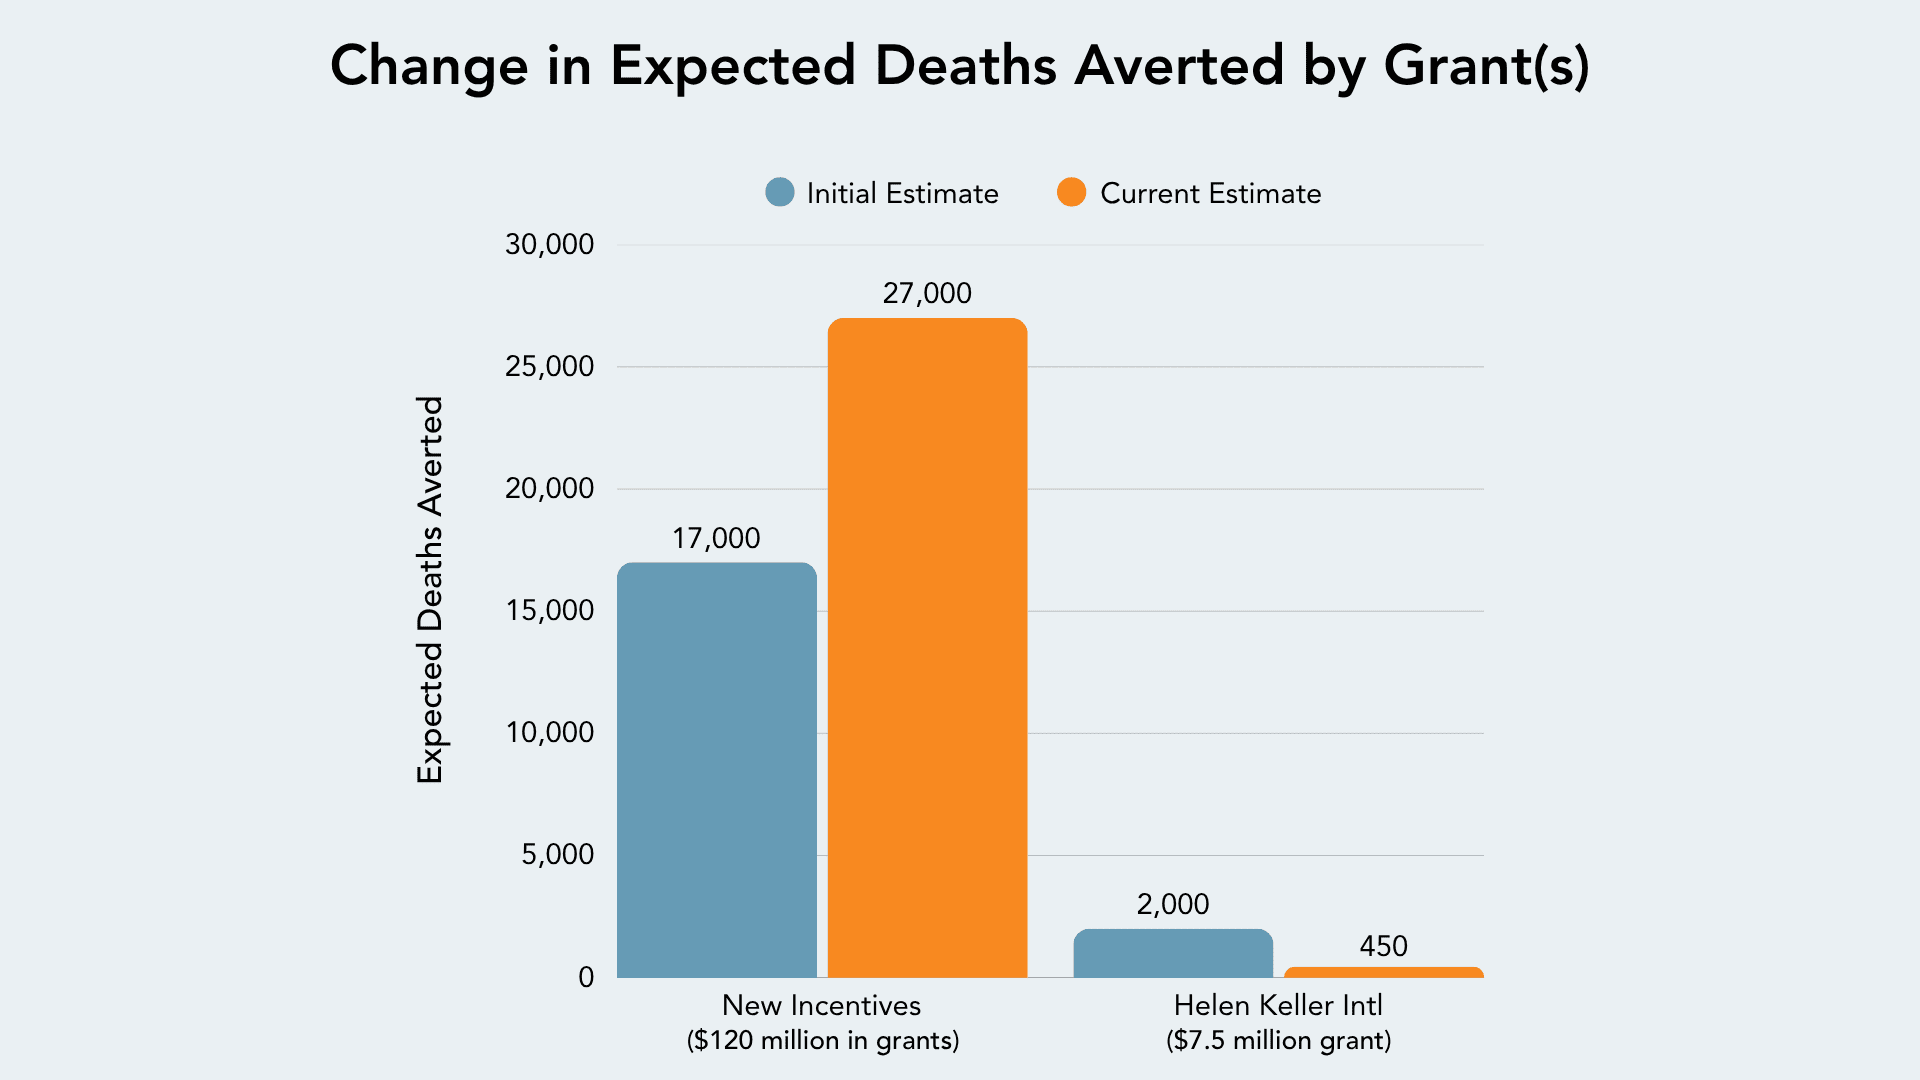
On seeing this wonderful graph from a GiveWell Back-check of New Incentives, I thought to myself wow New Incentives saved 27,000 lives - that’s impressive but feels high.

So I decided to spend a surprisingly fun 90 minutes of my life doing a back-check of a back-check. The things I do for joy...

Due to the speedrun nature of this check, I might have got a basic input wrong, made a simple logical mistake or even a calculation error. Also note that even if New Incentives did only save half, or a quarter as many lives as GiveWell estimates, they would still be a very cost-effective charity!

My Sanity Check BOTEC[2]

I tried to estimate the upper end of what might be plausible, as this is only a sanity check and to be generous to the might of the vaccine.

How Many kids did New Incentives cause to be vaccinated?

GiveWell estimates that 81 percent of incentivized kids would be vaccinated anyway, meaning roughly one child in five is an “additional” vaccination attributable to New Incentive’s programs, So Of 1,500,000 kids - GiveWell estimate 81% would have been vaccinated anyway

That’s 285,000 kids who were vaccinated because of New Incentives program - amazing!
 

What percent of those lives would be saved by Vaccination?

1. GiveWell estimated that 27,000 lives were saved by New Incentives. That’s 9.5% of the kids they caused to be vaccinated, which already seems highish - GiveWell estimates about 1 in 10 of these kids would have died from a vaccine preventable illness before age 5 if not for the New Incentives program.

2. The hardest part of my sanity check might be estimating a high bound on the mortality rate of unvaccinated kids. Recent Nigerian Mortality data from DHS estimates child mortality across Northern Nigeria to be 10-15%, but I’m going to double this estimate for unvaccinated kids to 25%, or 1 in 4 kids[3]. I think this is likely higher than reality, but a decent upper bound for a sanity check. 

3. About half of under 5 deaths in Nigeria happen around birth and in the first 2 months of life so are not preventable by vaccines. In unvaccinated kids this percentage will be lower (as more will die of vaccine-preventable conditions later on), so I’m going to drop this estimate to ⅓ of total deaths. Malaria deaths make up 16% of under 5 deaths. This will be far higher in Northern Nigeria as malaria burden is disproportionately high there - ChatGPT found 2 studies which estimated malaria causes 30-50% of under 5 mortality in Northern Nigeria. But this percentage will be lower in unvaccinated kids, because more kids will die of vaccination-preventable diseases. So on balance I’ll leave it at 16%  and estimate that…

 Birth + Neonatal + Malaria deaths make up about 50% of under 5 deaths. These deaths couldn't be prevented through vaccination

So this means 12.5% of unvaccinated kids might die from Non-birth/neonatal and Non-Malarial causes. The New Incentives estimate of 9.5% would mean that 75% of these deaths would have to be prevented by their program for the GiveWell estimate to hold, which I don’t think is possible because as good as vaccines are, they don't prevent everything....
 

We account for the remaining Mortality

   Global Burden of Disease mortality visual for Nigeria, under 5
(I promise you Covid doesn't kill 2% of kids. GBD sort it out)

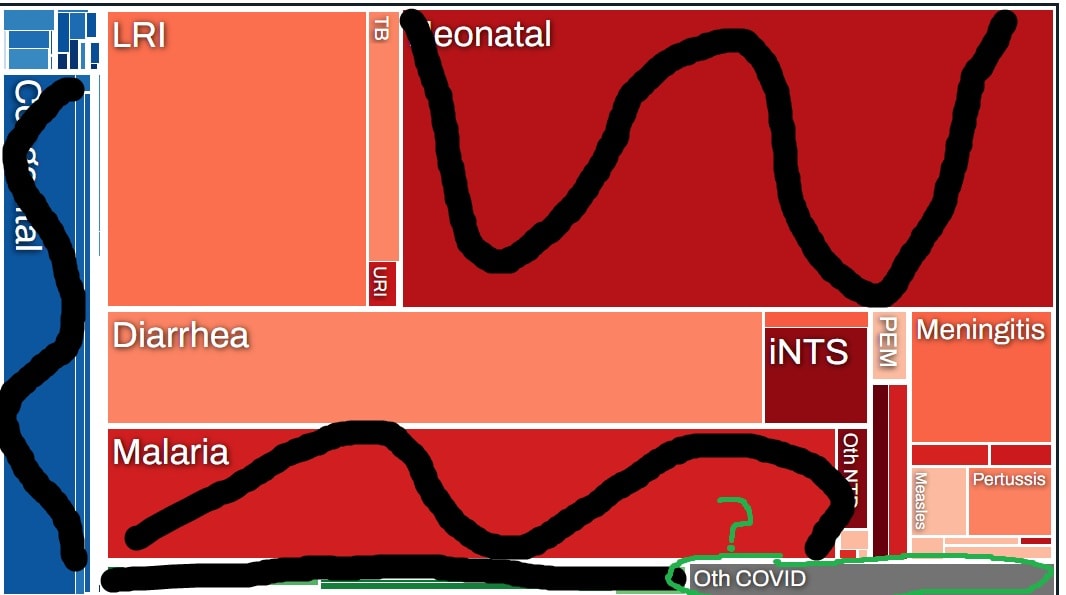
Now we estimate Vaccine preventable deaths from what’s left.

From what remains, the big 3 baby killers are Pneumonia, Diarrhea and Meningitis (see above GBD visualisation)
- Pneumococcus causes about 23 % of meningitis and hemophilus causes about 20%. So lets say 50% preventable at upper bound
- Rotavirus vaccine might prevent 30% of Diarrhea deaths, although this is tricky to estimate.
-  Again giving too much credit, vaccines might prevent 40% of pneumonia deaths.[5]

On the bottom right of the GBD visualisation are a few diseases that are almost 100% vaccine preventable, including Measles, Pertussis, Tetanus and Diptheria[6]. iNTS is Non-typhoid Salmonella and currently not vaccinated for - someone invent one please? Maybe 50% of the remaining burden could be prevented by vaccines.

So again being generous to vaccines, maybe 40% of what remains might have been prevented by the wonderful New Incentives program

So this means of the remaining 12.5% of kids who would have died after accounting for Malaria and birth issues, about 5% might be preventable. This is still an impressive percentage, but only about half of GiveWell’s estimates - and by my methods at least is on the high end of what's possible.

GiveWell take a completely different approach, meticulously going through disease by disease to estimate mortality reduction for each vaccine-preventable disease. I haven’t gone through their estimation step by step to try and find out why we come to such different conclusions, as that would take far longer than the 90 minutes I spent here! This is also not a cost-effectiveness analysis.

Again I could easily have wasted my time and be just flat wrong here. I would love any feedback of course especially from @GiveWell or New Incentives.

  1. ^

     Maybe the loosest set of calculations I’ve done in recent years

  2. ^

     Also a line in my recent EA-themed rap track

  3. ^

    If these kids all would have had zero vaccination doses, you could argue this rate could be higher, but that wouldn't be the case.

  4. ^

    As a side note, GBD estimated that 2% of under 5 deaths in Nigeria is from Covid - that’s absurd and impossible can someone please sort this out!

  5. ^

     https://www.nature.com/articles/s41564-019-0562-y

  6. ^

     This isn’t entirely true, for example quite a number of kids die from Pertussis in the first few months of life before the vaccines grant full immunity

  7. Show all footnotes

76

0
0
2

Reactions

0
0
2

More posts like this

Comments9
Sorted by Click to highlight new comments since:

Hi Nick,

Thank you for providing this feedback! My name is Vicky, and I am a Research Associate at GiveWell, on the vaccines team. We really appreciate these kinds of rough sense checks on our work and thought this was a great approach. 

Our lookback includes children enrolled across multiple years of programming (roughly covering 2020 to 2026) whereas the enrollment figures in your estimate only include a single year of program operations.

  • Our lookback aims to roughly capture the impact of our grants which cover New Incentives’ operations from 2020 through 2026. The estimated 1.5 million children enrolled that you cite is based on a single operating year, 2023.[1] We think New Incentives will enroll closer to 6.3 million children between 2020 and 2026.[2]
  • Using the same assumption that roughly 81% of children enrolled would be counterfactually vaccinated absent the program,[3] we estimate that roughly 1.2 million children would be counterfactually vaccinated by the program from 2020 through 2026.[4]
  • This implies an upper bound of roughly 60,000 deaths averted with your approach (assuming 5% of deaths in unvaccinated children might be preventable as an upper bound).[5]
     

We think this difference–the assumed number of children enrolled with GiveWell funding—is the main reason the upper bound you estimated for the number of deaths averted appears significantly lower than the estimates in our lookback, although we’re still exploring other potential discrepancies between the numbers in your approach and our estimates.[6]

Thanks again for your engagement!

  1. ^

    In 2023, New Incentives reported enrolling 1,518,904 children across 9 states. See New Incentives, 2023 Annual Report, p.8-9

  2. ^

    We estimated this by taking the total amount of funding (roughly $120 million) divided by the cost per child enrolled (roughly $19 per child enrolled) between 2020 and 2024. This assumes that the cost per child enrolled between 2025 and 2026 will remain similar to the historical weighted average.

    • We have not published our most recent estimates yet, but you can see our approach to estimating cost per child enrolled based on data from 2020 through 2023 here.
    • New Incentives publishes enrollment figures here. When calculating the cost per child, we adjust their estimates to account for potential repeat enrollments. 
  3. ^

    The 81% in our public report is based on a single state, Bauchi, and the exact percentage differs across states depending on baseline coverage and New Incentives’ expected impact in that state. In addition, we've made some internal updates to the model since the last version of our intervention report was published.

  4. ^

    6.3 million * (1 - 81%) = roughly 1.2 million children counterfactually vaccinated by the program.

  5. ^

    1.2 million children counterfactually vaccinated * 5% risk of dying from causes that might be preventable through vaccination = 60,000 deaths potentially averted as an upper bound.

    • The 5% risk of dying parameter is derived from two assumptions in your post:
      • 12.5% of unvaccinated kids might die from non-birth/neonatal and non-malarial causes.
      • 40% of non-birth/neonatal and non-nalarial deaths could potentially be vaccine-preventable.
      • 12.5% * 40% = 5%
  6. ^

    Across states where the New Incentives program operates, we estimate that unvaccinated children experience roughly a 3% to 8% chance of dying from vaccine-preventable diseases and that vaccination reduces their risk of dying by roughly 50%, which appears more in-line with your estimates. For more on how we estimate these, see our public report here.

  7. Show all footnotes

Thanks so much for the reply! Yep 6.3 million kids rather than 1.5 million would fix the issue that makes sense ;).

In my defence, a straightforward reading of the back-check article does seem to me to be cite 1.5 million as the number "For New Incentives, our best guess is that our $120 million in grants averted 27,000 deaths from vaccine-preventable diseases—about 60% higher than our initial estimate of 17,000 deaths. Our estimate of cost-effectiveness increased because costs per child dropped significantly as New Incentives expanded from serving 70,000 children to serving 1.5 million children." I don't think the 6.3 million number is on the review?

I should have picked up though that 120 million dollars would incentivize more than 1.5 million kids.... 

I had a good time learning more about the ins and outs of vaccinatable diseases so far from time wasted on my part ;).

As a smaller point I'm interested in the 0.75 extra lives saved you add for every 1 vaccinatable lives saved that you add as well. I know the vaccine effect seems to save lives from other causes as well (although most research on that  is pretty old), but I'm not sure where those extra lives saved would come from within the GBD bucket - its an interesting one!


Hi Nick,

Thanks for noting that section of the post could have been clearer! We’ve edited the article to clarify that New Incentives went from serving 70,000 to 1.5 million children per year.

We agree that the extra lives saved (“indirect deaths” in our analysis) is an interesting question. Both the magnitude of the adjustment and the exact mechanisms (i.e., which other causes those deaths are coming from in the GBD bucket) are major sources of uncertainty in our model, and we don’t currently specify what other deaths are being averted through vaccination in our analysis. We may follow up with a post to share more about our work on indirect deaths in the future.

Thanks again for the feedback!

Thanks for doing this check!


That’s 9.5% of the kids they caused to be vaccinated, which already seems highish - GiveWell estimates about 1 in 10 of these kids would have died from a vaccine preventable illness before age 5 if not for the New Incentives program.

This seems very different from what they claim in their spreadsheet (300 under-5 deaths averted per 10,000 children counterfactually vaccinated, so 3%)

Do you have a sense of what's driving the discrepancy?

Thanks Lorenzo - yes looking at that now I think that 3% is the estimate for the highest under 5 mortality Nigerian state as well, others are far less. They do assign 40% of the value of the program to preventing death in other ages + increased income effects as well + 0.75 lives saved for every vaccinated kid's life saved, based on other life saving effects from vaccines (which I'm pretty dubious about) - but that doesn't change the situation enough.

Also not sure if you have seen it, but near the top of this page is a great overall summary of their calculation, which makes a lot of sense to me and I struggle to see how it gets to that apparent 9.5% of lives saved that it seemed to me they were claiming..

https://www.givewell.org/international/technical/programs/new-incentives

I'm afraid I haven't looked through the CEA in detail to figure that out so no I don't have a sense!

Thanks for sharing— always good to have a sanity check!

I'm currently doing EA NZ's annual review of our partner charities. Is it okay if I include a note about your calculations in our review of New Incentives?

Hey Rowan thanks for asking! 

I would rather you didn't share the post more widely if that's ok, this is a sanity check and not a cost effectiveness analysis - and a loose check which might be plain wrong. I would want this to carry approximately zero weight about whether people would be keen to donate to New incentives or not. 

For the record this hasn't changed my opinion of New Incentives at all, I think they're a great charity! Its just a sanity check of what might be an overestimate of lives saved by GiveWell

Understood!

Yes, I'm a big fan of New Incentives too— even if your numbers were spot on, 13000+ lives saved is still an incredible result. And they're amazing to work with. (Shout-out to Liz Hixson if she happens to be reading this 💙)

2^ Also a line in my recent EA-themed rap track

Keen for the latest NickLaing album!

Curated and popular this week
Relevant opportunities