Summary: A blog post circulating among EAs points out that recent presidential elections have been decided by fewer than 100,000 votes. It may be tempting to conclude that each extra vote in a swing state has a 1-in-100,000 chance of changing the outcome of the 2024 presidential election. In this post, I explain why this is not the case. I estimate the actual number to be 1-in-3 million for a vote in Pennsylvania (the most important swing state) and 1-in-6 million for a generic "swing state vote". This has important implications for people who are deciding whether to donate to efforts to change the outcome of the 2024 presidential election.
Introduction
Like many of you,[1] I want Kamala Harris to win the 2024 U.S. presidential election. I also think that electoral politics as a cause area is underrated by EAs, and in 2020 I wrote a blog post arguing that voting for Joe Biden is an effective use of time. To summarize the argument in a paragraph:
If you live in a swing state, there's about a 1 in 10 million chance that your vote will flip the outcome of the entire presidential election. The outcome of the election will influence trillions of dollars in spending. So your vote influences how hundreds of thousands of dollars get spent, in expectation (in addition to non-budgetary considerations).
By the same token, if you support Kamala Harris then you might consider donating to efforts to get her elected. If you can get her one extra swing-state vote for $1,000 (that's my best guess), that means that you can spend $1,000 to influence how hundreds of thousands of dollars get spent.
Is that a good deal, compared with other EA interventions? Maybe! I usually estimate that the U.S. government saves about one life per $10 million that it spends well. If you believe this guess, you'd be saving a life for about $10k-100k, which is... fine but worse than interventions like the Against Malaria Foundation. (Of course, it's much more complicated than that.[2])
But what if you thought that one extra swing-state vote increased Harris' chances of winning by 1 in 100 thousand? In that case, you'd be spending $1,000 to influence how tens of millions of dollars get spent. That's a really good deal -- literally a 100x better deal -- and is probably worth it!
Where does the number 100 thousand come from? The anonymous blog "Make Trump Lose Again" (MTLA) makes the case that some interventions to help Harris get elected are really cost-effective. Quoting from the blog post:
Biden won the last election by 42,918 combined votes in three swing states. Trump won the election before that by 77,744 votes. In 2000, just 537 votes (and likely some Republican meddling) in Florida decided the election for Bush, who won a second term by 118,601 votes in 2004.
There’s a good chance the 2024 election will be extremely close too. [Emphasis original.]
(What does it mean that Biden won by 42,918 votes? If Trump had won Arizona, Georgia, and Wisconsin, he would have won the election. He would have needed 10,457 more votes in Arizona, 11,779 more votes in Georgia, and 20,682 more votes in Wisconsin, for a total of 42,918 votes.)
It may be tempting to draw the conclusion that an extra swing-state vote will increase Harris' chances of winning by 1 in 100 thousand. Indeed, a couple of people I've talked to implicitly had that takeaway from the blog post. But as I will argue, such a conclusion is unwarranted.
This post has two parts. In Part 1, I explain why the quote from MTLA does not straightforwardly translate to an estimate of the impact of a marginal vote. Specifically, I argue that:
- (The less important reason) It is a coincidence that three of the last six elections were within 100,000 votes. I estimate a 20-25% chance of this happening again in 2024.
- (The more important reason) Even if I told you that the 2024 election will be within 100,000 votes, you wouldn't know which states will be the decisive ones.
In Part 2, I lay out a better way to think about the impact of a marginal vote.
- I introduce the microHarris (μH) as a unit of election impact equal to an increase of one-in-a-million in Harris' chances of winning, and use Nate Silver's forecast to estimate how many μH various interventions are worth.
- I conclude that an extra vote for Harris in Pennsylvania is about 0.3 μH (one in 3 million), and that an extra vote for Harris in a generic swing state is about 0.17 μH (one in 6 million). This is 30-60x less impactful than the one-in-100k that one might gather from the above quote.
Part 1: The MTLA quote doesn't tell you the impact of a marginal vote
How close should we expect the 2024 election to be?
Usually, election closeness is measured by how much you'd need to swing the national vote (uniformly across all the states) in order to change the outcome of the election. For example, if Biden had done 0.63% worse against Trump, he would have lost Arizona, Georgia, and Wisconsin, and therefore the election. We will call this number (0.63%, in 2020) the tipping-point margin.[3] Here are the tipping-point margins of recent elections:
| Year | Tipping-point margin | Number of swing-state votes you'd need to swing |
| 2020 | 0.63% | 42,918 (in GA, AZ, WI) |
| 2016 | 0.77% | 77,744 (in MI, PA, WI) |
| 2012 | 5.36% | 527,737 (in FL, OH, VA, CO) |
| 2008 | 8.95% | 994,143 (in NC, IN, NE-02, FL, OH, VA, CO) |
| 2004 | 2.11% | 134,648 (in IA, NM, OH)[4] |
| 2000 | 0.01% | 537 (in FL) |
And here's a chart of the same data.[5]
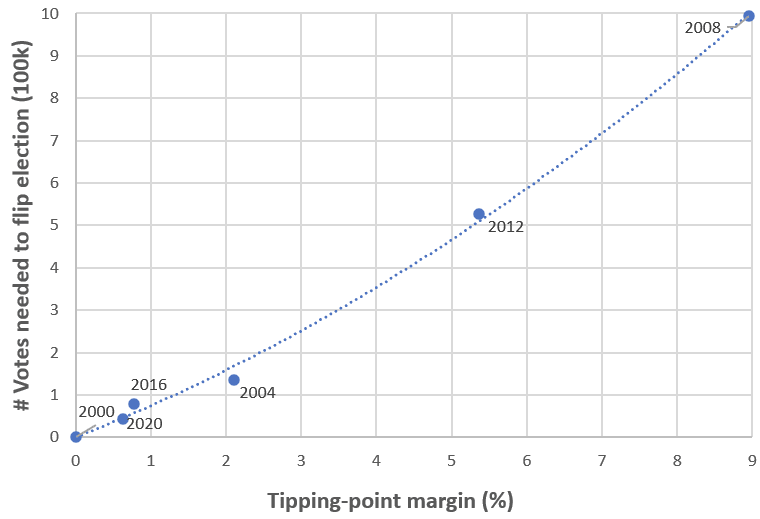
Three of the last six elections had a margin of victory of less than 1%. But although there's reason to believe that U.S. elections are on average close and will continue to be close,[6] there's no reason to think that half of elections will be extremely close (within 1%) half the time. Instead, the most parsimonious model for tipping-point margin -- a normal distribution[7] with mean zero and standard deviation around 4-5% -- fits this data well.
So, how likely is the 2024 election to be "decided by fewer than 100 thousand votes"? Right now, Nate Silver's presidential election model estimates the margin in the tipping-point state to be (roughly) normally distributed with mean zero and standard deviation 5.5%. If you trust that model, then based on the curve above, there's about a 20% chance or of this outcome.[8] (My personal subjective probability is more like 25%, though.) If you want, you can bet on this Manifold market.
Knowing that 100,000 votes would swing the election isn't a game plan
Okay, but 25% is actually a pretty large chance! Suppose I came back from the future and told you that the election was decided by fewer than 100,000 votes. What actions would you take to try to get Harris to win?
Well, let's say that I came back to August 2016 and told you that the election would be decided by fewer than 100,000 votes. What would you have done then?
Perhaps you would have looked at election forecasts, found which states had the most valuable votes (roughly speaking, the states that seemed closest to the national tipping point[9]), and worked to flip votes in those states. Perhaps you would have gone to FiveThirtyEight's excellent[10] 2016 forecast, and looked at their voter power index:
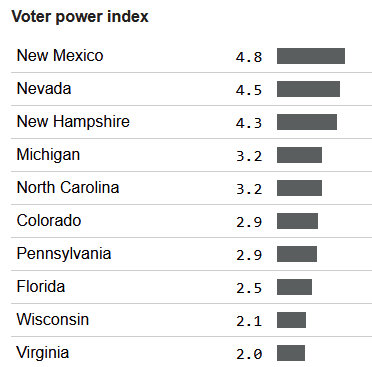
...and decided to fly to New Mexico, Nevada, and New Hampshire to knock on doors (or donate to voter registration efforts in those states, or whatever). In which case, come November, you would have been disappointed to learn that actually you should have been knocking on doors in Michigan, Pennsylvania, and Wisconsin.
Similarly, if I had told you in August 2020 that the election would be decided by fewer than 100,000 votes, you would have probably chosen to knock on doors in Pennsylvania, whereas the states that ended up deciding the election were Georgia, Arizona, and Wisconsin.
To summarize, flipping 100,000 votes is not enough. You need to flip 100,000 votes in the right states. And that involves a lot of guesswork and getting lucky, even with the best election models.
Part 2: So how valuable are swing-state votes?
Ultimately, if you're trying to argue that people should donate to help Harris win the election, the problem with the argument "this election may be decided by 100,000 votes" is that it doesn't tell you how effective any particular intervention is. In this section, I will aim to bridge that gap.
The microHarris: a unit of intervention effectiveness
The effectiveness of an intervention should be judged by how much it increases the probability that Kamala Harris will win the election. We will be considering interventions like "one extra vote for Harris in Pennsylvania": small-enough interventions that this increase in probability is measured in millionths.
Hence, inspired by microCOVID, we will define the microHarris. A microHarris (or μH) is a one-in-a-million increase in the probability that Kamala Harris will win the election. The effectiveness of interventions (or events) can be measured in μH. Example usage includes:
- "Wow, what a good ad! If they spend $100,000 on this ad campaign, that might be worth 20 microHarrises."
- "Ooh, did you see, Taylor Swift endorsed Kamala?[11] That's like 1000 microHarrises, maybe more if continues to encouraging her fans to vote!"
- "Wow, what a stellar debate performance. That's gotta be worth at least 20,000 microHarrises."
- "I spent all day knocking on doors in Pennsylvania! I know it's only one microHarris, but that's actually kind of a lot if you think about it."[12]
In the next section, I will try to answer the question: how many μH is an extra vote for Harris? I will consider variations of this question: a random vote; a vote in a swing state; a vote in Pennsylvania.
How many microHarrises is an extra vote for Harris?
All the forecasting models I know of are in agreement that a vote in Pennsylvania is worth more than a vote in any other state. So let's start there: how many microHarrises is an extra vote for Kamala Harris in Pennsylvania?
I reached out to Nate Silver's assistant, Eli McKown-Dawson, for an answer, but didn't hear back. But luckily, there's an incredibly helpful snippet in a Nate Silver blog post from a few weeks ago. Nate was arguing that Harris should choose Pennsylvania governor Josh Shapiro as her running mate, because running mates help presidential candidates in their home states. And so Nate considered how changing Harris' standing in Pennsylvania (without otherwise affecting the model) would affect her chances of winning the election:
- Harris initially won the Electoral College in 19,081 of 40,000 simulations (47.7%)
- If Shapiro nets her an additional 0.5 points[13] in Pennsylvania, she wins the Electoral College an additional 401 times. That brings her total win probability up to 48.7%.
- If he has a bigger impact than that and nets Harris 1 full point in Pennsylvania, she wins the Electoral College 49.6% of the time.
In other words, a 1 percentage point increase in Harris' margin of victory in Pennsylvania (let's call this the "Pennsylvania bump") increases her probability of winning the presidential election by 2%.
What are these 2% of worlds? They are the worlds in which Pennsylvania is both very close and decisive:
- Without the Pennsylvania bump, Trump wins Pennsylvania, but by a margin of victory of less than 1%. That's about 68,000 votes.
- Without the Pennsylvania bump, Harris loses the electoral college. With the Pennsylvania bump, she wins it.
(See this footnote[14] for some intuition about where the 2% comes from and why it's a reasonable estimate of this probability.)
In other words: according to Nate's model, an extra 68,000 votes in Pennsylvania counterfactually increase Harris' chance of victory by 2%.
This means that one extra vote for Harris in Pennsylvania is worth 0.3 μH. Or put otherwise, the probability that she wins the election increases by 1 in 3.4 million: a far cry from 1 in 100,000.[15]
What about votes in other swing states? Conveniently for us, Nate's Voter Power Index (VPI) tells us the importance of votes in different states, in proportion to each other:
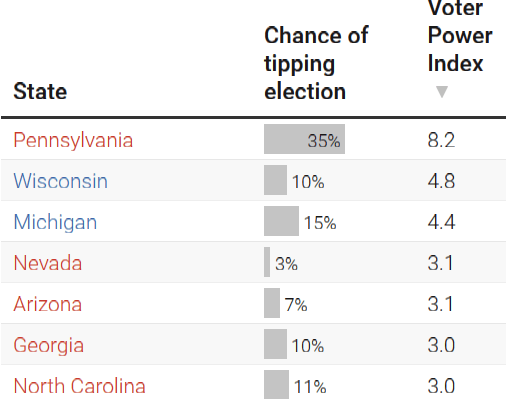
Thus, an extra vote for Harris in Wisconsin is worth 4.8/8.2 times as much as an extra vote for Harris in Pennsylvania, or about 0.17 μH, and so on.
What about a generic "swing state vote"? The seven states above are the canonical "seven swing states" in this election. If an organization tells you that they'll be turning out voters for Harris in swing states, I'd default to assuming that they're targeting these seven states, in proportion to their populations.[16] The effectiveness comes out to about 0.17 μH, or 1 in 6 million, per vote.
What about a random vote in the United States? That's 8.2x less valuable than a Pennsylvania vote, or about 0.036 μH.
Does Nate Silver's model have too much spread?
I think the strongest objection to the calculations I've done here is that Nate Silver's model is underconfident: that the distribution of outcomes is too broad.
For instance, as of August 31, he models Trump's margin of victory in Pennsylvania as normal with mean 0.6% and standard deviation 5.3%. Is that too much standard deviation?
That standard deviation is inferred from historical data on (1) how much elections change between now and November and (2) how much polling error we should expect on election day. Perhaps you could argue that we ought to expect factor (1) to be below its historical mean, because the electorate is polarized. But on the other hand, this election features an unexpected Democratic nominee, and voters' perceptions of Harris are not yet locked in. Indeed, Harris' favorability ratings have changed massively since she became the nominee.
So if I were forced to pick a side, I would say that 5.3% is slightly too much standard deviation -- but only by a little. And so perhaps my microHarris estimates are a little too low, but I wouldn't adjust them by more than 20%.
Conclusion
To summarize the numbers:
- If you're going to try to get Kamala Harris more votes (and you're a relatively small player), you should go all in on Pennsylvania and you'll get 0.3 μH per vote (1 in 3 million chance of flipping the election per Harris vote).
- If you persuade someone to vote for Harris instead of Trump (rather than just finding Harris another voter), you get 2x credit (since you're changing the margin by 2, not 1).
- If you're donating to a place that claims to be flipping votes "in swing states", I'd count that 0.17 μH per vote, or 1 in 6 million.
Is that worth it? I don't know: I think it depends a lot on your priorities and beliefs. I definitely don't think it's crazy. If you trust my $1,000/vote estimate from earlier, then every $3,000 you spend has a one-in-a-million chance of changing the outcome of the election. (If you object to this analysis on EDT grounds, see footnote.[17])
Personally, I think that the U.S. federal government's policy on A.I. over the next four years will be incredibly important to our future, and that A.I. policy will in expectation be much better under a Harris administration than under a Trump administration. My current belief is that donating to efforts to help Harris elected is better than all non-A.I.-related interventions, but less good than donating to organizations that are specifically trying to set up good A.I. governance in the United States.
But of this I am far less certain. My take in the previous paragraph is informed by murky intuitions, beliefs, and values. My estimates of how good things are for the world could be off by a factor of a hundred, and may even have the wrong sign.
By contrast, I'm pretty confident in my estimate of the probability that an extra vote in Pennsylvania will flip the outcome of the presidential election. I'd be quite surprised to learn that I was off by more than a factor of five.
So my advice: if you're deciding whether to donate to efforts to get Harris elected, plug in my "1 in 3 million" estimate into your own calculation -- the one where you also plug in your beliefs about what's good for the world -- and see where the math takes you. And if the math takes you to helping Harris get elected, I suggest reading the Make Trump Lose Again blog post to find out the most effective places to donate to!
- ^
Most EAs identify as liberal, see here.
- ^
This calculation basically assumes that money spent under the Trump administration is wasted, while money spent under the Harris administration is about as good as the government's bar for which programs are worth funding. This is simplistic in a number of ways. But for me, the dominant consideration is that I think Harris is likely to handle AI better than Trump. For this reason, I think the calculation understates how good it is to donate to Harris.
- ^
The tipping-point margin is equal to the winner's margin of victory in the tipping-point state.
- ^
My number differs from Make Trump Lose Again's 118,601 because Iowa and New Mexico were closer than Ohio, and I've decided to count John Kerry as needing to flip those states before he could flip Ohio. Another way of putting it is that Kerry couldn't have known to focus specifically on Ohio in advance of the election.
- ^
Lest I be accused of overfitting by using a quadratic curve: I decided on using a quadratic fit before I saw the data. This is because, as tipping-point margin increases, the number of states in which the loser needs to flip votes increases linearly with the tipping-point margin. Thus, we should expect the total number of votes needed to flip the election to increase quadratically, not linearly, with the tipping-point margin. (Also, the model has only two degrees of freedom -- not three -- because I forced it to pass through (0, 0).)
- ^
If one party is more popular than the other, it is incentivized to moderate in order to win over more voters.
- ^
Technically a half-normal distribution if we're defining tipping-point margin to be a positive number.
- ^
For the purposes of this prediction, I'm defining "decided by 100,000 votes" using the method that gave me 134,648 for 2004, as opposed to Make Trump Lose Again's 118,601 (see footnote 3).
- ^
In other words, if you were to sort states from red to blue, the states that you'd expect to be closest to the decisive 270th electoral vote.
- ^
The forecast gave Trump a higher chance of victory than prediction markets or any other (high-profile) publicly-available election model.
- ^
This hasn't happened yet, but I hope (and think) it will!
- ^
On Election Day 2020, I knocked on registered Democrats' doors in Pennsylvania with a friend. One family had forgotten to drop off their ballots until we reminded them. I give us credit for two counterfactual Biden votes in PA!
- ^
Here, I believe that "points" means "margin of victory": winning PA 51-49 (i.e. by 2%) is 1 point better than winning PA 50.5-49.5 (i.e. by 1%).
- ^
Polls in Pennsylvania are essentially dead even. Based on historical data about polling error, Nate Silver models Trump's margin of victory in Pennsylvania (possibly a negative number) as uncertain, with standard deviation 5.3%. So the probability that his margin of victory is between 0% and 1% is about 7.5%. But we also need Pennsylvania to be decisive (i.e. for Trump to win the electoral college by fewer than Pennsylvania's 19 electoral votes). Nate's model assigns probability 9% to that possibility. However, we must remember that "Trump wins PA by between 0% and 1%" and "Trump wins the electoral college but by fewer than 19 electoral votes" are not independent: they are highly correlated, since they both happen when the election ends up very close. It seems that according to Nate's model, the probability that Trump wins the electoral college but by fewer than 19 electoral votes conditional on him winning Pennsylvania but by less than 1% is about 25-30% (i.e. three times higher than the unconditional probability). That seems intuitively reasonable to me.
- ^
This number has perhaps gone up a little, since the election a few weeks closer so uncertainty in the outcome is a little lower, but Pennsylvania has remained as close as can be. But I think it hasn't gone up very much, maybe 10%.
- ^
Maybe they're spending disproportionate time in Pennsylvania. (That would be good.) On the other hand, maybe they're wasting some of their resources on states like Florida.
- ^
I've heard the argument that if you believe in evidential decision theory, you should expect the impact of a donation to be much larger, because your donation decisions are correlated with other people's: deciding to donate $3,000 should increase your estimate of how much was donated in total by more than $3,000. I have a couple of thoughts about this:
- If you're just deciding how to spend your donation budget, then I suspect this argument applies equally well to other places that you might donate to. So you should figure out the best place to donate to and be extra happy having update on the fact that people who were using a similar reasoning process probably ended up donating to that place too. (Although if you think you're correlated with sufficiently many people, you might want to think about which donation opportunities hit diminishing returns on marginal donations most quickly.)
- If you're deciding whether to donate at all, this argument might be more compelling. But note that if your decision of whether to donate hinges on which decision theory to use, then your decision probably isn't correlated with that many other people's!
There might be a second path to impact here in addition to the chance that any single vote is pivotal to changing the election. In choosing future candidates and platforms, the parties will take into account the margins of victory. A big win by Harris (or Trump) will be interpreted differently than a very narrow win. The parties may look at this as a measure of where the median voter lies (or some other measure relevant to the elections) and adjust accordingly. Each additional vote will have a small impact on this, but as you point out the scale is large.
So it may not only be a very small chance of a large impact but ann almost certain chance of having a substantial (but very hard to measure) impact.
(This is not my original idea there have been some papers in this in political science or public choice.)
I think elections tend to have low aleatoric uncertainty, and that our uncertain forecasts are usually almost entirely due to high epistemic uncertainty. (The 2000 Presidential election may be an exception where aleatoric uncertainty is significant. Very close elections can have high aleatoric uncertainty.)
I think Trump was actually very likely to win the 2024 election as of a few days before the election, and we just didn't know that.
Contra Scott Alexander, I think betting markets were priced too low, rather than too high. (See my (unfortunately verbose) comments on Scott's post Congrats To Polymarket, But I Still Think They Were Mispriced.)
I think some people may have reduced their epistemic certainty significantly and had justified beliefs (not overconfident beliefs) that Trump was ~65-90% likely to win.
I totally am willing to believe that the French whale was not one of those people and actually just got lucky.
But I do think that becoming informed enough to rationally obtain a credence of >65% Trump was practically possible.
Could you say more about "practically possible"? What steps do you think one could have taken to have reached, say, a 70% credence?
Yeah. I said some about that in the ACX thread in an exchange with a Jeffrey Soreff here. Initially I was talking about a "maximally informed" forecaster/trader, but then when Jeffrey pointed out that that term was ill-defined, I realized that I had a lower-bar level of informed in mind that was more practically possible than some notions of "maximally informed."
Basically just steps to become more informed and steps to have better judgment. (Saying specifically what knowledge would be sufficient to be able to form a forecast of 70% seems borderline impossible or at least extremely difficult.)
Before the election I was skeptical that people like Nate Silver and his team and The Economist's election modeling team were actually doing as good a job as they could have been[1] forecasting who'd win the election and now post-election I still remain skeptical that their forecasts were close to being the best they could have been.
[1] "doing as good a job as they could have been" meaning I think they would have made substantially better forecasts in expectation (lower Brier scores in expectation) if figuring out who was going to win was really important to them (significantly more important than it actually was), and if they didn't care about the blowback for being "wrong" if they made a confident wrong-side-of-maybe forecast, and if they were given a big budget to use to do research and acquire information (e.g. $10M), and if they were highly skilled forecasters with great judgment (like the best in the world but not superhuman (maybe Nate Silver is close to this--IDK; I read his book The Signal and the Noise, but it seems plausible that there could still be substantial room for him to improve his forecasting skill)).
I'm in agreement with the point that the aleatoric uncertainty was a lot lower than the epistemic uncertainty, but we know how prediction error from polls arises: it arises because a significant and often systematically skewed in favour of one candidate subset of the population refuse to answer them, other people end up making late decisions to (not) vote and it's different every time. There doesn't seem to be an obvious way to solve epistemic uncertainty around that with more money or less risk aversion, still less to 90% certainty with polls within the margin of error (which turned out to be reasonably accurate).
Market participants don't have to worry about blowback from being wrong as much as Silver but also didn't think Trump was massively underpriced [before Theo, who we know had a theory but less relevant knowledge, stepped in, and arguably even afterwards if you think 90% certainty was feasible]. And for all that pollsters get accused of herding, some pollsters weren't afraid to share outlier polls, it's just that they went in both directions (with Selzer, who is one of the few with enough of a track record to not instantly write off her past outlier successes as pure survivorship bias, publishing the worst of the lot late in the day). So I think the suggestion that there was some way to get to 65-90% certainty which apparently nobody was willing to either make with substantial evidence or cash in on to any significant extent is a pretty extraordinary claim...
I'm skeptical that nobody was rationally (i.e. not overconfidentally) at >65% belief Trump would win before election day. Presumably a lot of people holding Yes and buying Yes when Polymarket was at ~60% Trump believed Trump was >65% likey to win, right? And presumably a lot of them cashed in for a lot of money. What makes you think nobody was at >65% without being overconfident?
I'll grant the French whale was overconfident, since it seems very plausible that he was overconfident, though I don't know that for sure, but that doesn't mean everyone >65% was overconfident.
I'll also note that just because the market was at ~60% (or whatever precisely) does not mean that there could not have been people participating in the market who were significantly more confident yhat Trump would win and rationally-so.
Sure, just because the market was at 60% doesn't mean that nobody participating in it had 90% confidence, though when it's a thin market that indicates they're either cash constrained or missing out on easy, low-risk short term profit. I have the bigger question about why no psephologists, who one would think are the people most likely to have a knowledge advantage as well as good prediction skill, don't have to risk savings and actually have non-money returns skewed in their favour (everyone remembers when they make a right outlying call, few people remember the wrong outliers) seemed able to come up with explanation of why the sources of massive polling uncertainty were actually not sources of massive uncertainty.
And the focus of my argument was that in order to rationally have 65-90% confidence in an outcome when the polls in all the key states were within the margin for error and largely dependent on turnout and how "undecideds" vote, people would have to have some relevant knowledge of systematic error in polling, turnout or how "undecideds" would vote which either eliminated all sources of uncertainties or justified their belief everyone else's polls were skewed[1]. I don't see any particular reason to believe the means to obtain that knowledge existed and was used when you can't tell me what that might look like, never mind how a small number of apparently resource-poor people obtained it...
The fact that most polls both correctly pointed to a Trump electoral college victory but also had a sufficiently wide margin of error to call a couple individual states (and the popular vote) wrongly, is in line with "overcautious pollsters are exaggerating the margin for error" or "pollsters don't want Trump to look like he'll win" not being well-justified reasons to doubt their validity
I wasn't a particularly informed forecaster, so me not telling you what information would have been sufficient to justify a rational 65+% confidence in Trump winning shouldn't be much evidence to you about the practicality of a very informed person reaching 65+% credence rationally. Identifying what information would have been sufficient is a very time-intensive, costly project, and given I hadn't done it already I wasn't about to go spend months researching the data that people in principle had access to that might have led to a >65% forecast just to answer your question.
Prior to the election, I had an inside view credence of 65% that Trump would win, but considered myself relatively uninformed and so I meta-updated on election models and betting market prices to be more uncertain, making my all-things-considered view closer to 50/50. As I wrote on November 4th:
So I held this suspicion before the election, and I hold it still. I think it's likely that such forecasters with rational credences of 65+% Trump victory did exist, and even if they didn't, I think it's possible that they could have existed if more people cared more about finding out the truth of who would win.
I think this is all very reasonable and I have been working under the assumption of one votes in PA leading to a 1 in 2 million chance of flipping the election. That said, I think this might be too conservative, potentially by a lot (and maybe I need to update my estimate).
Of the past 6 elections 3 were exceedingly close. Probably in the 95th percentile (for 2016 & 2020) and 99.99th percentile (for 2000) for models based off polling alone. For 2020 this was even the case when the popular vote for Biden was +8-10 points all year (so maybe that one would also have been a 99th percentile result?). Seems like if the model performs this badly it may be missing something crucial (or it's just a coincidental series of outliers).
I don't really understand the underlying dynamics and don't have a good guess as to what mechanisms might explain them. However, it seems to suggest that maybe extrapolating purely from polling data is insufficient and there's some background processes that lead to much tighter elections than one might expect.
Some incredibly rough guesses for mechanisms that could be at play here (I suspect these are mostly wrong but maybe have something to them):
Thanks for those thoughts! Upvoted and also disagree-voted. Here's a slightly more thorough sketch of my thought in the "How close should we expect 2024 to be" section (which is the one we're disagreeing on):
(Also, just a side note, but the fact that 2000 was 99.99th percentile is definitely just a coincidence. There's no plausible mechanism pushing it to be that close as opposed to, say, 95th percentile. I actually think the most plausible mechanism is that we're living in a simulation!)
I think it's very reasonable to say that 2008 and 2012 were unusual. Obama is widely recognized as a generational political talent among those in Dem politics. People seem to look back on, especially 2008, as a game-changing election year with really impressive work by the Obama team. This could be rationalization of what were effectively normal margins of victory (assuming this model is correct) but I think it matches the comparative vibes pretty well at the time vs now.
As for changes over the past 20+ years, I think it's reasonable to say that there's been fundamental shifts since the 90s:
Agree that 5-10% probability isn't cause for rejection of the hypothesis but given we're working with 6 data points, I think it should be cause for suspicion. I wouldn't put a ton of weight on this but 5% is at the level of statistical significance so it seems reasonable to tentatively reject that formulation of the model.
Trump vs Biden favorability was +3 for Trump in 2020, Obama was +7 on McCain around election day (average likely >7 points in Sept/Oct 2008). Kamala is +3 vs Trump today. So that's some indication of when things are close. Couldn't quickly find this for the 2000 election.
I just want to register that, because the election continues to look extremely close, I now think the probability that the election is decided by fewer than 100,000 votes is more like 60%.
Looks like it'll be about 250,000 votes.
Considering the cost for live saved by the US government on average might not be the best measure? I suppose that having A Democrat and Office would lead to a certain amount additional spending but would it double the impact? On the other hand the Counterfactual spending might be much higher impact if we think for example that the Republicans will/foreign aid spending or funding for pandemic preparation. Wondering how these concerns were balanced.
Yeah I agree; I think my analysis there is very crude. The purpose was to establish an order-of-magnitude estimate based on a really simple model.
I think readers should feel free to ignore that part of the post. As I say in the last paragraph:
Before the election I made a poll asking "How much would you pay (of your money, in USD) to increase the probability that Kamala Harris wins the 2024 Presidential Election by 0.0001% (i.e. 1/1,000,000 or 1-in-a-million)?"
You can see 12 answers from rationalist/EA people after submitting your answer to the poll or jumping straight to the results.
Thanks for writing up this post, @Eric Neyman . I'm just finding it now, but want to share some of my thoughts while they're still fresh in my mind before next election season.
My independent estimate from the week before the election was that Harris getting one extra vote in PA would increase her chance of winning the presidential election by about 1 in 874,000.
My methodology was to forecast the number of votes that Harris and Trump would each receive in PA, calculate the probability of a tie in PA given my probability distributions for the number of votes they would each get, then multiply the probability of the PA tie by the probability that PA is decisive (conditional on a tie).
I used normal distributions to model the expected number of votes Harris and Trump would each get for simplicity so I could easily model the outcomes in Google Sheets (even though my credence/PDF did not perfectly match a normal distribution). These were my parameters:
Simulating 10,000 elections in Google Sheets with these normal distributions found that about 654 elections per 10,000 were within 20,000 votes, which translates to a 1 in ~306,000 chance of PA being tied. I then multiplied this by a ~35%[1] chance that PA would be decisive (conditional on it being tied), to get a 1 in ~874,000 chance of an extra vote for Harris in PA changing who won overall.
99% of the votes in PA are in right now, with the totals currently at: 3,400,854 for Harris and 3,530,234 for Trump.
This means that the vote totals for Harris and Trump are both within 1 standard deviation of my mean expectation. Harris is about half an SD low and Trump was about half an SD high.
From this, it's not clear that my SDs of 80,000 votes for Harris and 90,000 votes for Trump were too narrow, as your (or Nate's) model expected.
So I think my 1 in ~874,000 of an extra vote for Harris determining the president might have been more reasonable than your 1 in ~3.4 million.
[1] Note: I mistakenly privately thought models and prediction markets might be wrong about the chance of PA being decisive, and thought that maybe it was closer to ~50% rather than ~25-35%, but the reason I thought this was bad and I didn't realize until after the election: I made a simple pattern matching mistake by assuming "the election is a toss-up" meant "it will be a close election". I failed to consider other possibilities like "the election will not be close, but we just don't know which side will win by a lot." (In retrospect, this was a very silly mistake for me to make, especially since I had seen that as of some late-October date The Economist said that the two most likely outcomes of the 128 swing-state combinations was 20% that Trump swings all seven and 7% that Harris swings all 7.)
I haven't looked at your math, but I actually agree, in the sense that I also got about 1 in 1 million when doing the estimate again a week before the election!
I think my 1 in 3 million estimate was about right at the time that I made it. The information that we gained between then and 1 week before the election was that the election remained close, and that Pennsylvania remained the top candidate for the tipping point state.
I'm curious if by "remained close" you meant "remained close to 50/50"?
(The two are distinct, and I was guilty of pattern-matching "~50/50" to "close" even though ~50/50 could have meant that either Trump or Harris was likely to win by a lot (e.g. swing all 7 swing states) and we just had no idea which was more likely.)
Note that I also made five Manifold Markets questions to also help evaluate my PA election model (Harris and Trump means and SDs) and the claim that PA is ~35% likely to be decisive.
(Note: I accidentally resolved my Harris questions (#4 & #5) to the range of 3,300,000-3,399,999 rather than 3,400,000-3,499,999. Hopefully the mods will unresolve and correct this for me per my comments on the questions.)
This exercise wasn't too useful as there weren't enough other people participating in the markets to significantly move the prices from my initial beliefs. But I suppose that's evidence that they didn't think I was significantly wrong.
I'm curious, why do you think this? The value of statistical life (VSL) you linked is about the benefit of saving a life, not about the cost. If we assume the government consistently uses this $10 million VSL threshold for interventions, it could reflect the (marginal) cost of saving a life. But this feels like a weird approach. It might be useful to get a sense of order of magnitude, but I'm somewhat skeptical
Yeah, it was intended to be a crude order-of-magnitude estimate. See my response to essentially the same objection here.