All it takes is a single click to help vote to get GWWC onstage and presenting about our work at SXSW Sydney this year. 

Your vote would be super helpful and takes less than a minute.

You can read the session proposal at the link below, too!

Vote here

48

0
0

Reactions

0
0
Comments3


Sorted by Click to highlight new comments since:
Curated and popular this week
 ·  · 5m read
 · 
[Cross-posted from my Substack here] If you spend time with people trying to change the world, you’ll come to an interesting conundrum: Various advocacy groups reference previous successful social movements as to why their chosen strategy is the most important one. Yet, these groups often follow wildly different strategies from each other to achieve social change. So, which one of them is right? The answer is all of them and none of them. This is because many people use research and historical movements to justify their pre-existing beliefs about how social change happens. Simply, you can find a case study to fit most plausible theories of how social change happens. For example, the groups might say: * Repeated nonviolent disruption is the key to social change, citing the Freedom Riders from the civil rights Movement or Act Up! from the gay rights movement. * Technological progress is what drives improvements in the human condition if you consider the development of the contraceptive pill funded by Katharine McCormick. * Organising and base-building is how change happens, as inspired by Ella Baker, the NAACP or Cesar Chavez from the United Workers Movement. * Insider advocacy is the real secret of social movements – look no further than how influential the Leadership Conference on Civil Rights was in passing the Civil Rights Acts of 1960 & 1964. * Democratic participation is the backbone of social change – just look at how Ireland lifted a ban on abortion via a Citizen’s Assembly. * And so on… To paint this picture, we can see this in action below: Source: Just Stop Oil which focuses on…civil resistance and disruption Source: The Civic Power Fund which focuses on… local organising What do we take away from all this? In my mind, a few key things: 1. Many different approaches have worked in changing the world so we should be humble and not assume we are doing The Most Important Thing 2. The case studies we focus on are likely confirmation bias, where
 ·  · 10m read
 · 
Citation: McKay, H. and Shah, S. (2025). Forecasting farmed animal numbers in 2033. Rethink Priorities. The report is also available on the Rethink Priorities website. Executive summary We produced rough-and-ready forecasts of the number of animals farmed in 2033 with the aim of helping advocates and funders with prioritization decisions. We focus on the most numerous groups of farmed animals: broiler chickens, finfishes, shrimps, and select insect species. 
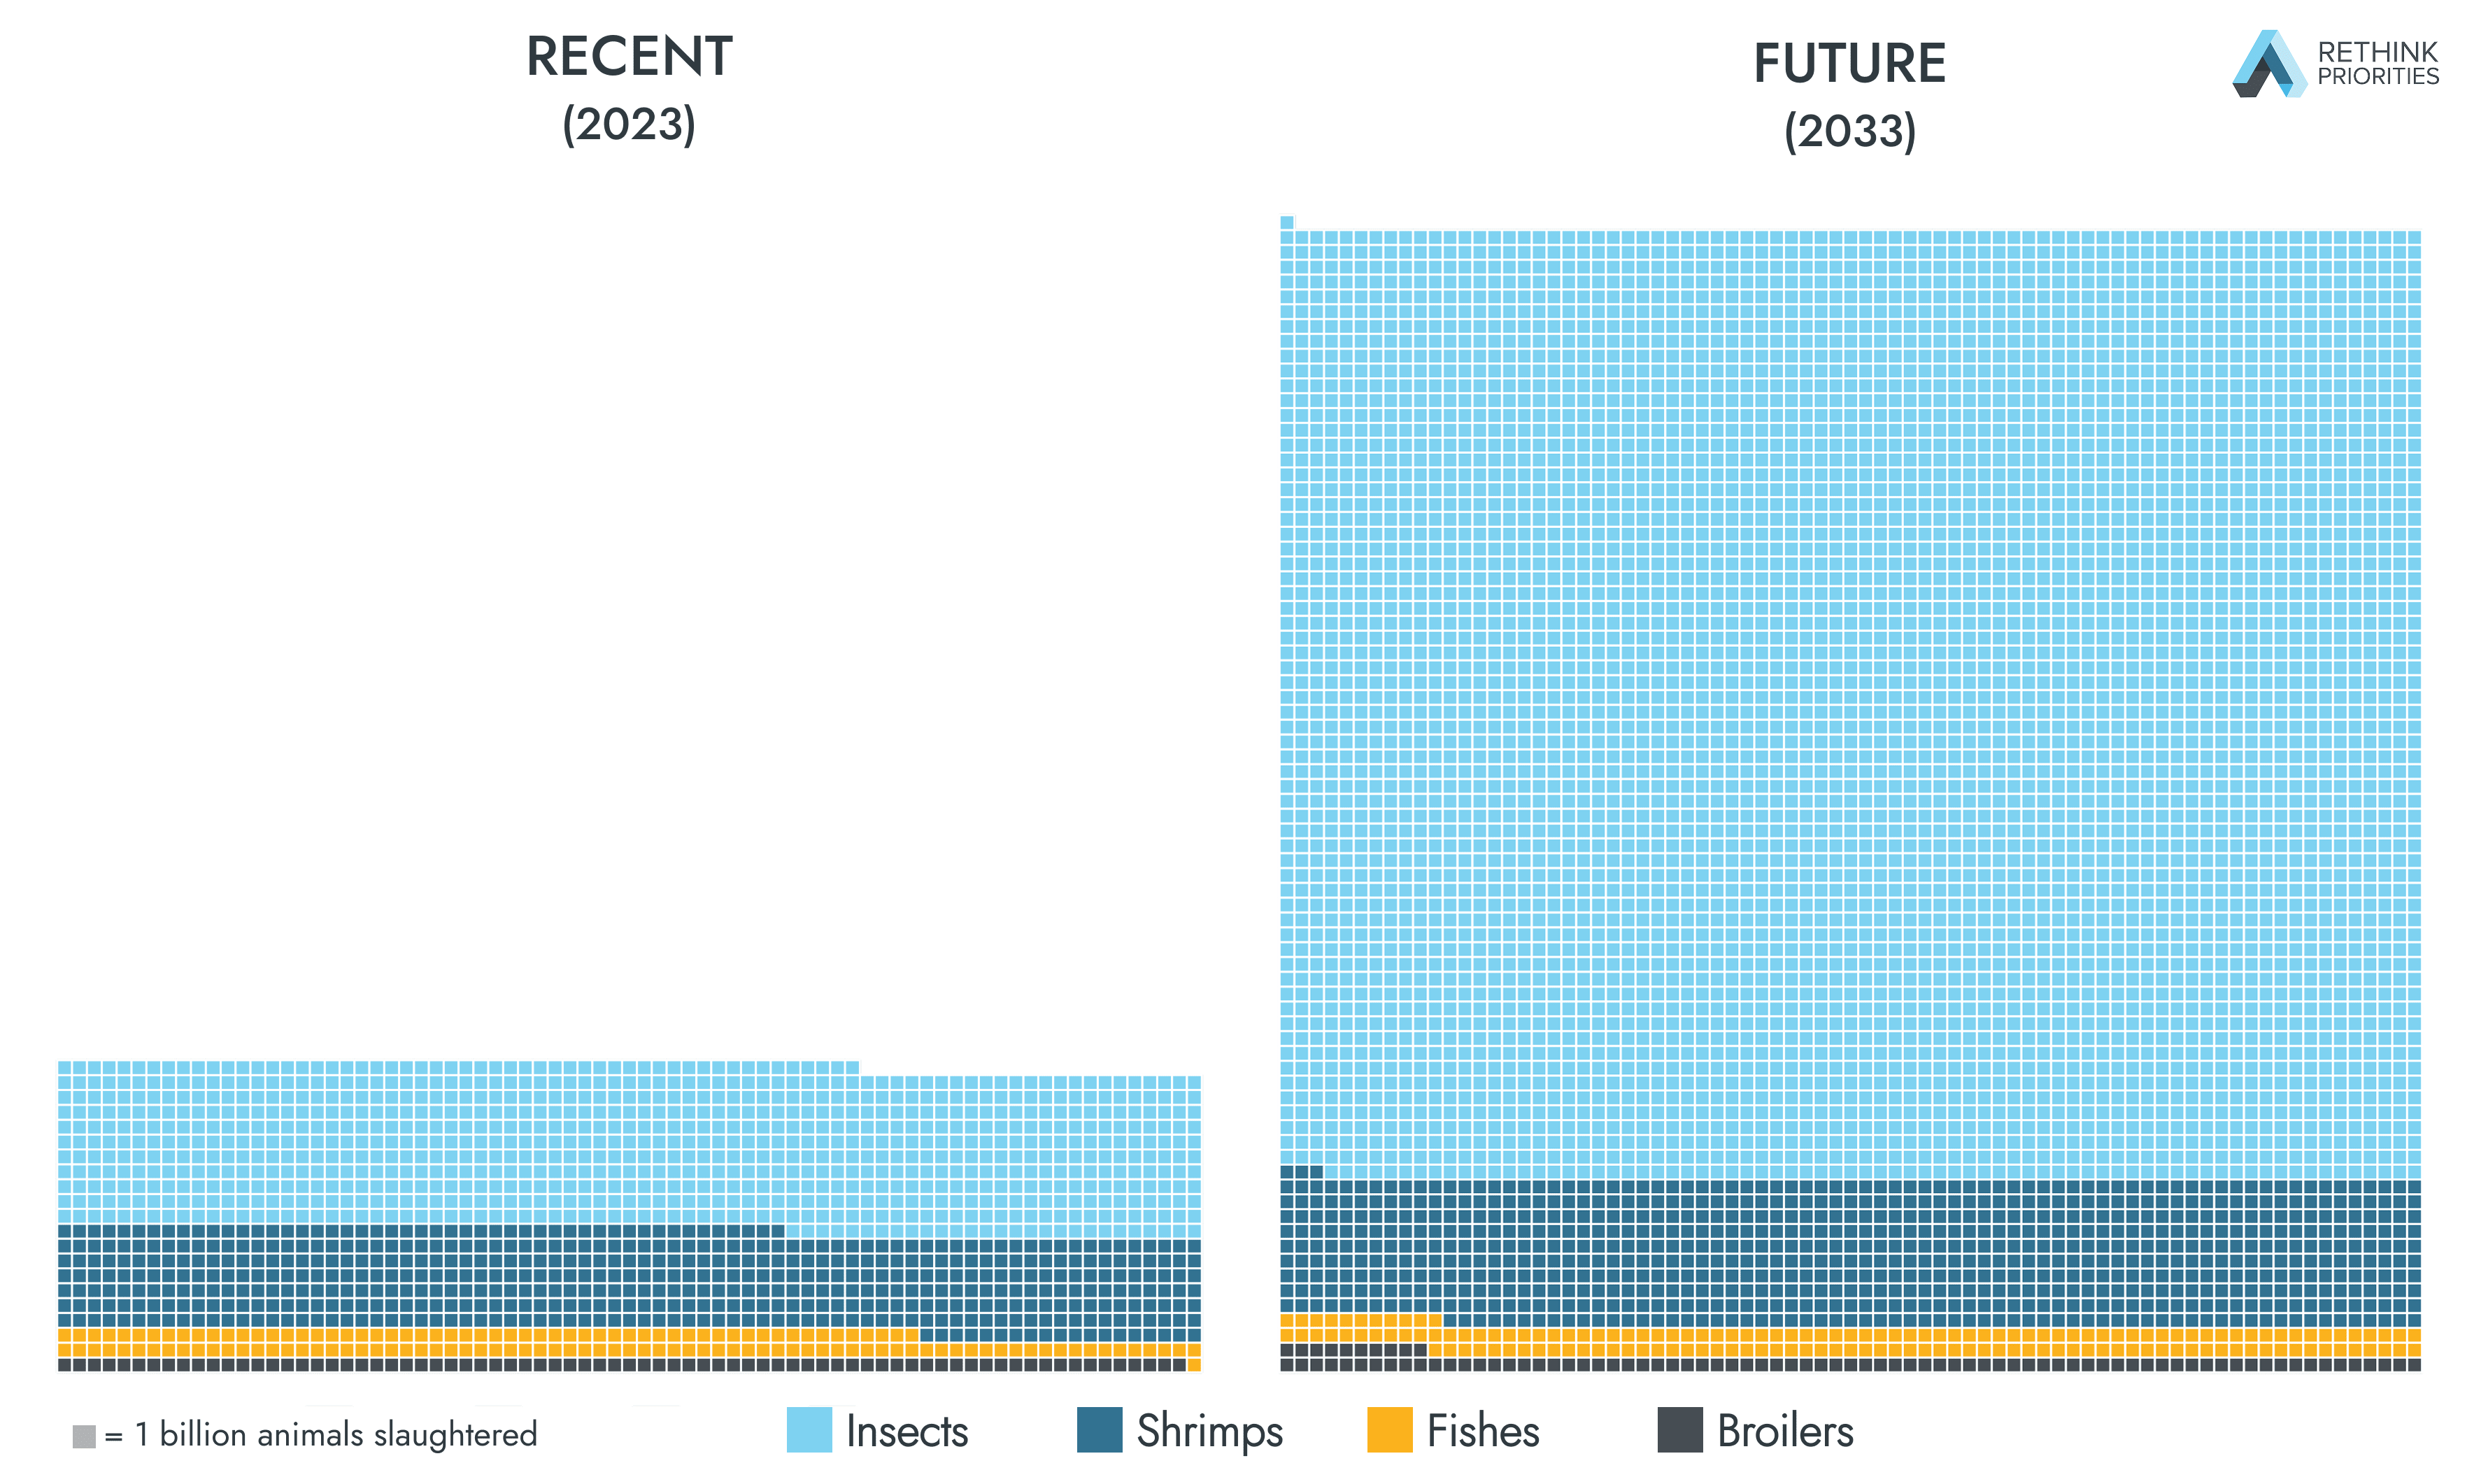
Our forecasts suggest almost 6 trillion of these animals could be slaughtered in 2033 (Figure 1).   Figure 1: Invertebrates could account for 95% of farmed animals slaughtered in 2033 according to our midpoint estimates. Note that ‘Insects’ only includes black soldier fly larvae and mealworms. Our midpoint estimates point to a potential fourfold increase in the number of animals slaughtered from 2023 to 2033 and a doubling of the number of animals farmed at any time. Invertebrates drive the majority of this growth, and could account for 95% of farmed animals slaughtered in 2033 (see Figure 1) and three quarters of those alive at any time in our mid-point projections. We believe our forecasts point to an urgent need to address critical questions around the sentience and welfare of farmed invertebrates. Our estimates come with many caveats and warnings. In particular: * Species scope: For practicality, we produced numbers only for a few key animal groups: broiler chickens, finfishes, shrimp, and certain insects (black soldier flies and mealworms only). * Sensitivity to insect farming growth: Our forecasts are particularly sensitive to the growth in insect farming, which is highly sensitive to the success of insect farming business models and their ability to attract future investment. The recent and forecasted estimates, with 90% subjective credible intervals, can be viewed below in Table 1.  Table 1: Estimates of recent and forecasted numbers of broiler chickens, finfishes, shrimps, and insects slau