The views expressed here are my own, not those of my employers.
Summary
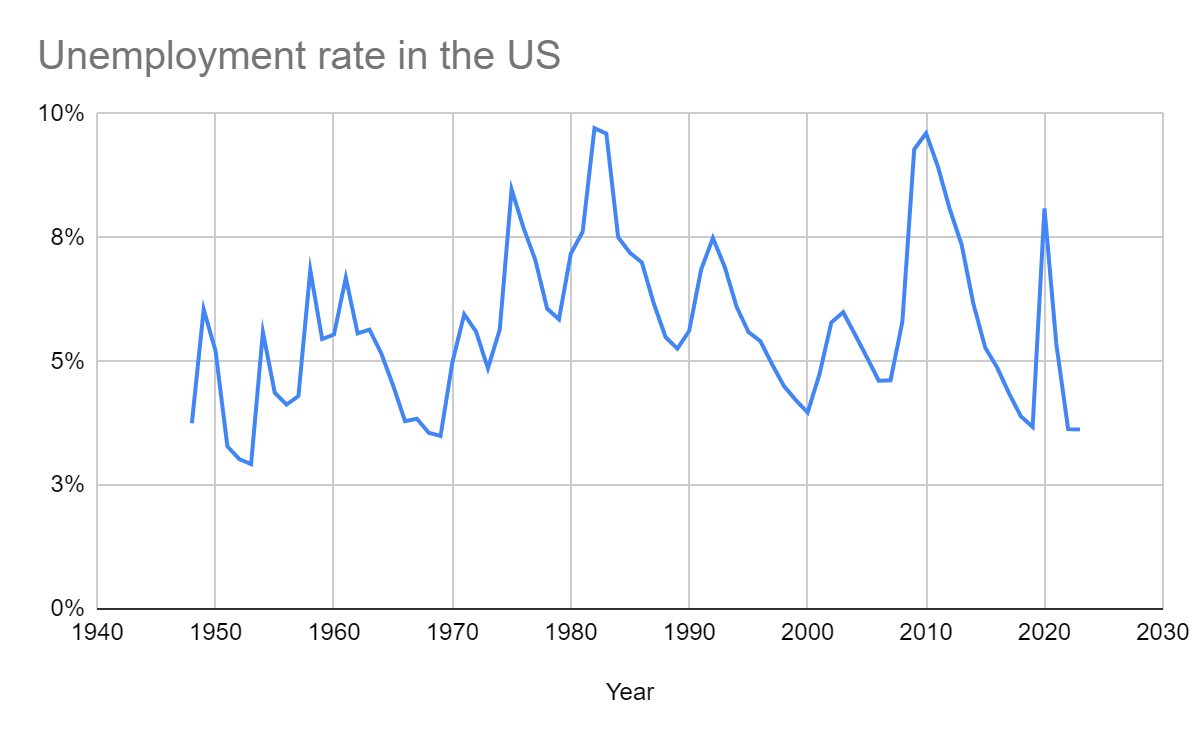
- The 5th percentile, median and 95th percentile annual unemployment rate in the United States (US) from 1948 to 2023 were 3.54 %, 5.55 % and 9.02 %.
- There has been a very weak upward trend in the annual unemployment rate in the US, with the coefficient of determination (R^2) of the linear regression of it on the year being 3.54 %.
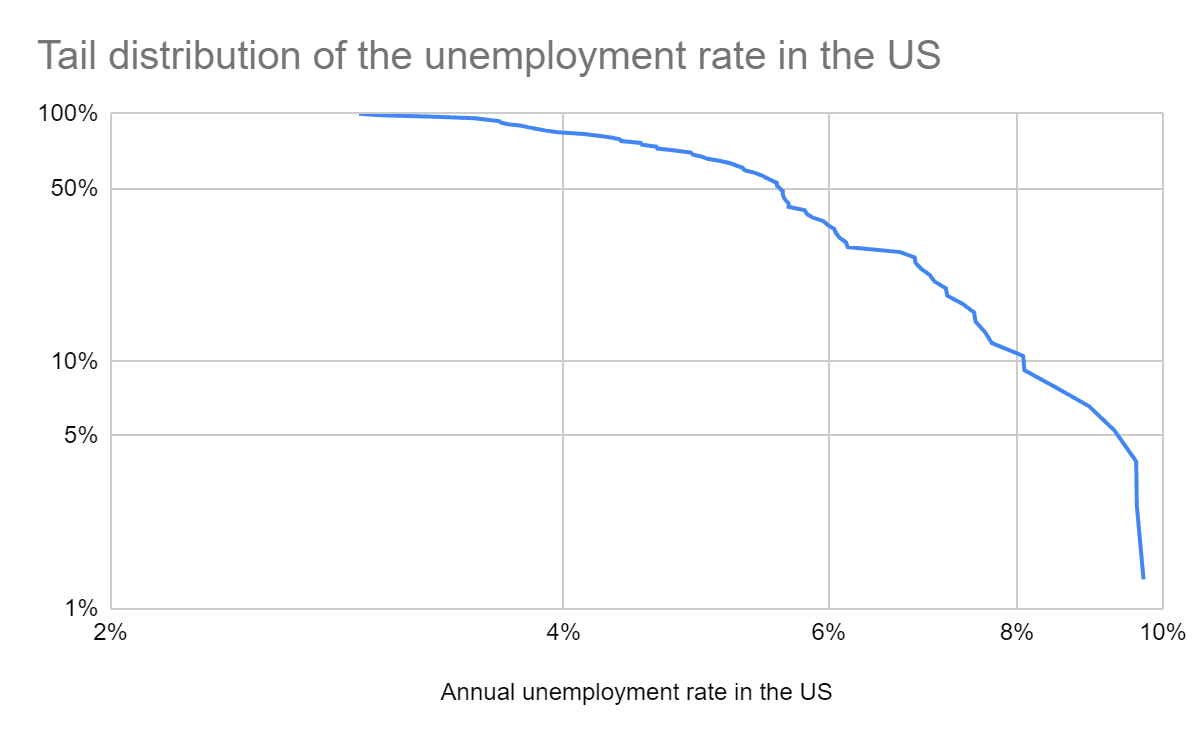
- The tail distribution of the annual unemployment rate in the US bends downwards in a log-log plot. I got a similar pattern for the annual conflict and epidemic/pandemic deaths as a fraction of the global population.
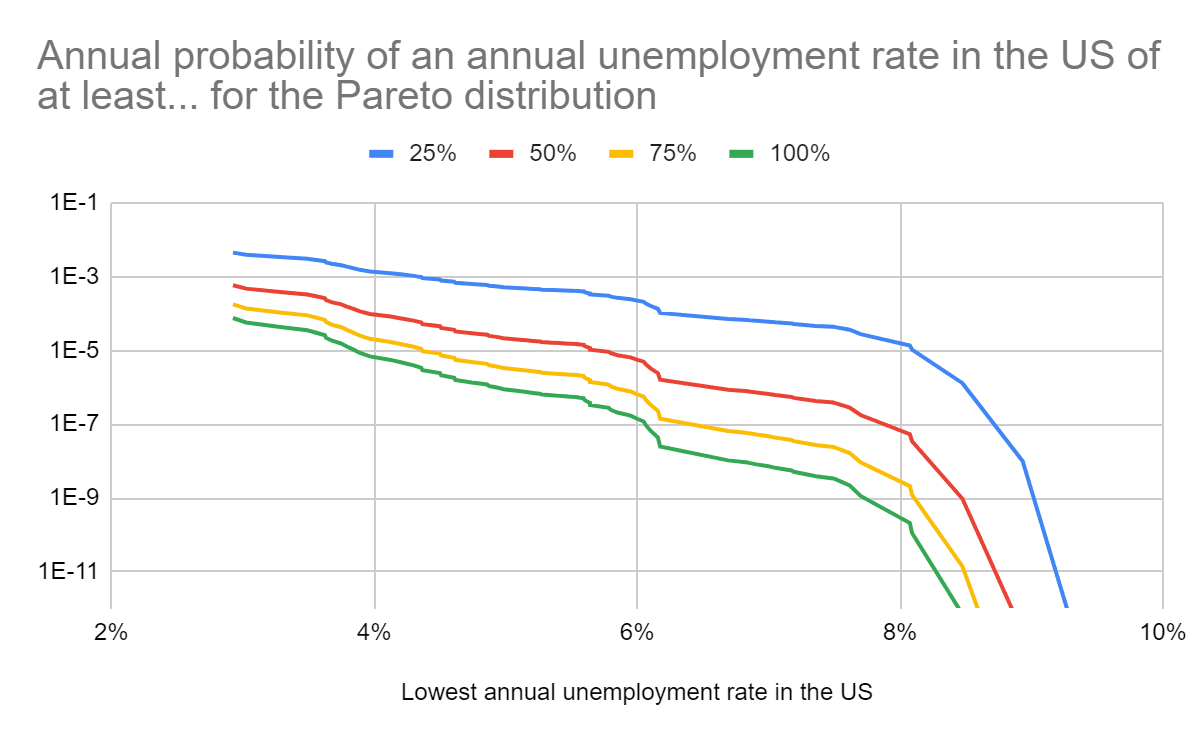
- For the Pareto distributions fit to the 10.5 % (8) rightmost points of the tail distribution in a log-log plot, the annual probability of this being:
- At least 10 % is 2.04 %.
- 100 % is 2.11*10^-10.
- I suspect many in the global catastrophic risk community underweight the outside view outlined in this post, and therefore overestimate the probability of massive unemployment.
Methods
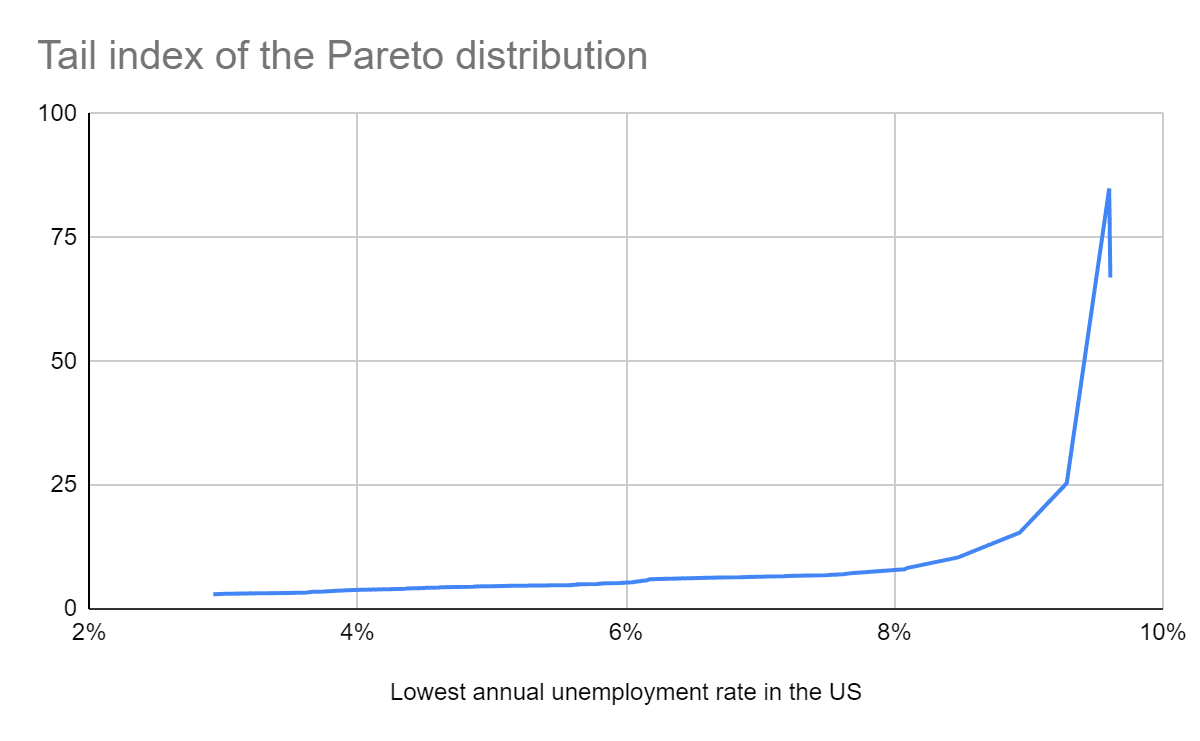
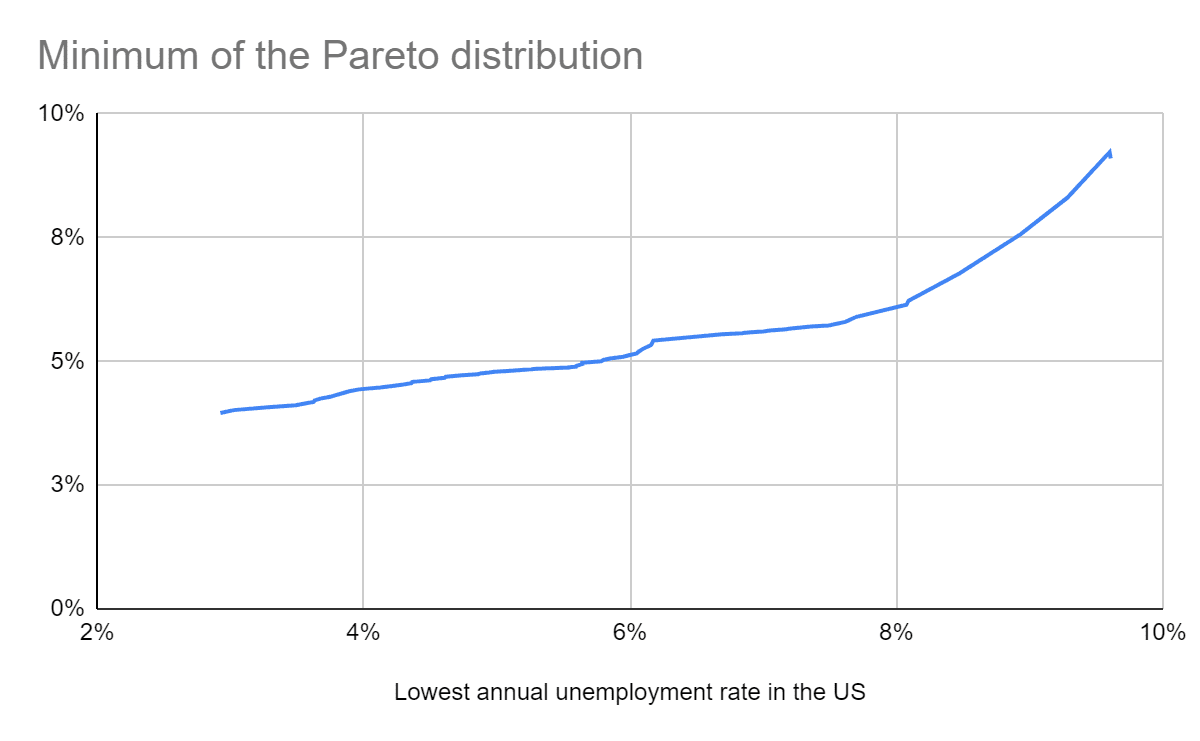
I fit Pareto distributions (power laws) to the 2, 3, … and 76 (= 2023 - 1948 + 1) highest values of the annual unemployment rate in the US from 1948 to 2023. To do this:
- I get the slope and intercept of linear regressions of the above sections of the tail distribution on the annual unemployment rate in the US.
- Since the tail distribution of a Pareto distribution is P(X > x) = (“minimum”/x)^“tail index”, ln(P(X > x)) = “tail index”*ln(“minimum”) - “tail index”*ln(x) = “intercept” + “slope”*ln(x), so I determine the parameters of the Pareto distributions from:
- “Tail index” = -“slope”.
- “Minimum” = e^(“intercept”/“tail index”).
Then I obtain the annual probability of an annual unemployment rate in the US of at least 10 %, 25 %, 50 %, 75 % and 100 %. Note unemployment requires not only not having a job, but also being actively looking for one:
Someone in the labor force is defined as unemployed if they were not employed during the survey reference week, were available for work, and made at least one active effort to find a job during the 4-week survey period.
The calculations are in this Sheet.
Results
Historical data
Time series
Basic stats
| Statistic | Annual unemployment rate in the US |
| Mean | 5.70 % |
| Minimum | 2.93 % |
| 5th percentile | 3.54 % |
| 10th percentile | 3.71 % |
| Median | 5.55 % |
| 90th percentile | 7.89 % |
| 95th percentile | 9.02 % |
| Maximum | 9.71 % |
Linear regression on the year
| Linear regression of the annual unemployment rate in the US on the year | ||
| Slope (pp/century) | Intercept (pp) | Coefficient of determination |
| 1.39 | -21.9 | 3.54 % |
Tail distribution
Tail risk based on Pareto distributions
Discussion
Historical data
The 5th percentile, median and 95th percentile annual unemployment rate in the US from 1948 to 2023 were 3.54 %, 5.55 % and 9.02 %. The maximum was 9.71 % in 1982.
There has been a very weak upward trend in the annual unemployment rate in the US, with the R^2 of the linear regression of it on the year being 3.54 %.
The tail distribution of the annual unemployment rate in the US bends downwards in a log-log plot. I got a similar pattern for the annual conflict and epidemic/pandemic deaths as a fraction of the global population.
Tail risk
My estimates for the annual probability of an annual unemployment rate in the US of:
- At least 10 % range from 0.105 % to 6.54 %.
- 100 % range from 1.32*10^-88 to 0.00749 %.
For the Pareto distributions fit to the 10.5 % (8) rightmost points of the tail distribution in a log-log plot, the annual probability of this being:
- At least 10 % is 2.04 %.
- 100 % is 2.11*10^-10.
I believe the rightmost points of the tail should get the most weight to predict tail risk, which implies trusting lower estimates more. On the other hand, I expect inside view factors related to transformative AI (TAI) to push estimates upwards. All in all, I suspect many in the global catastrophic risk community underweight the outside view outlined in this post, and therefore overestimate the probability of massive unemployment.
Thank you for the post! How much weight do you think should one allocate to the inside and outside view respectively in order to develop a comprehensive estimate of the potential future unemployment rate?
Your calculations look fancy and all of that, but it seems inappropriate to me to be putting so much weight on historical data as you are doing. Especially because I think this ignores the apparent fact that the development of intelligent systems that are more capable than humans has never occurred in history. This fundamentally changes the game.
The more the world changes, I think the less weight one should be putting on the outside view (needs more nuance). People are scared, people don't update in the face of new evidence, people dislike change.
I know you are not saying that the inside view doesn't matter, but I am concerned that a post like this anchors people toward a base rate that is a lot lower than what things will actually be like. It reinforces status quo bias. And this is frustrating to me because so many people don't seem to understand the seriousness of our situation.
I think it makes a lot of sense to reason bottom-up when thinking about topics like these, and I actually disagree with you a lot. It seems to be that there is a deeply correlated failure happening in the AI safety community. In my view, people are putting way too much weight onto the outside view. I am happy to elaborate.
Thank you for sparking this discussion.
Thank you for your reply!
Summary: My main intention in my previous comment was to share my perspective on why relying too much on the outside view is problematic (and, to be fair, that wasn’t clear because I addressed multiple points). While I think your calculations and explanation are solid, the general intuition I want to share is that people should place less weight on the outside view, as this article seems to suggest.
I wrote this fairly quickly, so I apologize if my response is not entirely coherent.
Emphasizing the definition of unemployment you use ... (read more)