The views expressed here are my own, not those of my employers.
Summary
- The 5th percentile, median and 95th percentile annual unemployment rate in the United States (US) from 1948 to 2023 were 3.54 %, 5.55 % and 9.02 %.
- There has been a very weak upward trend in the annual unemployment rate in the US, with the coefficient of determination (R^2) of the linear regression of it on the year being 3.54 %.
- The tail distribution of the annual unemployment rate in the US bends downwards in a log-log plot. I got a similar pattern for the annual conflict and epidemic/pandemic deaths as a fraction of the global population.
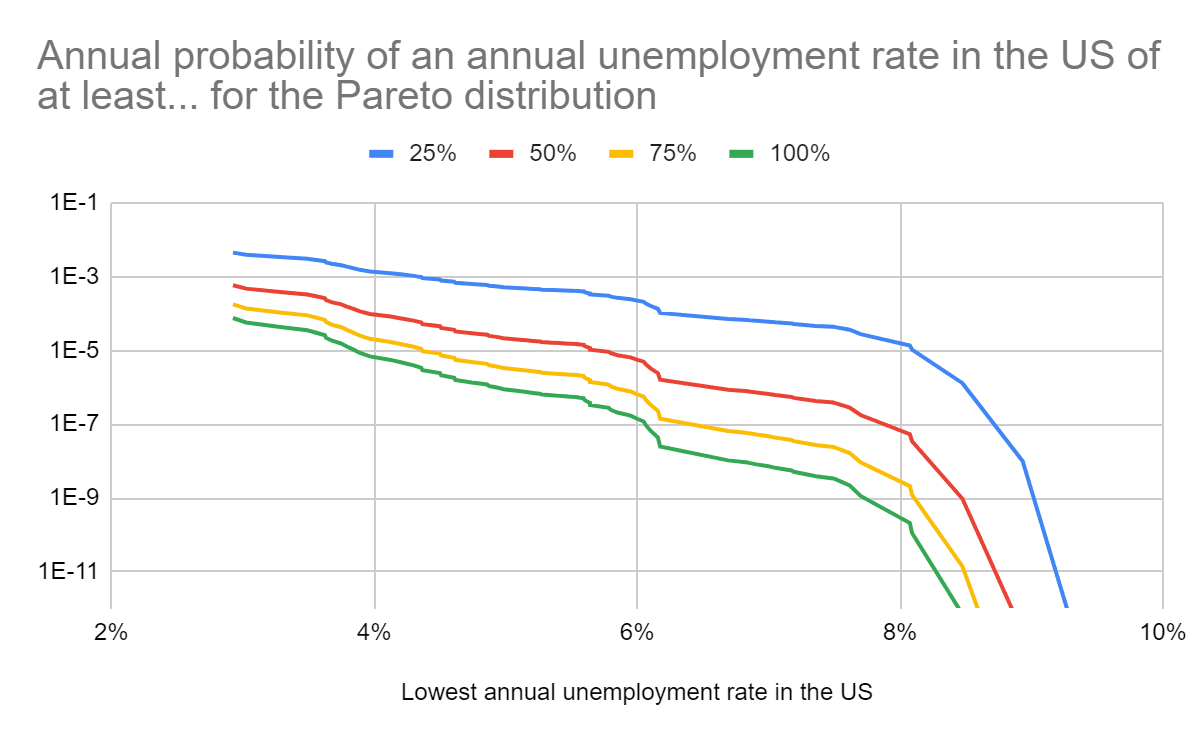
- For the Pareto distributions fit to the 10.5 % (8) rightmost points of the tail distribution in a log-log plot, the annual probability of this being:
- At least 10 % is 2.04 %.
- 100 % is 2.11*10^-10.
- I suspect many in the global catastrophic risk community underweight the outside view outlined in this post, and therefore overestimate the probability of massive unemployment.
Methods
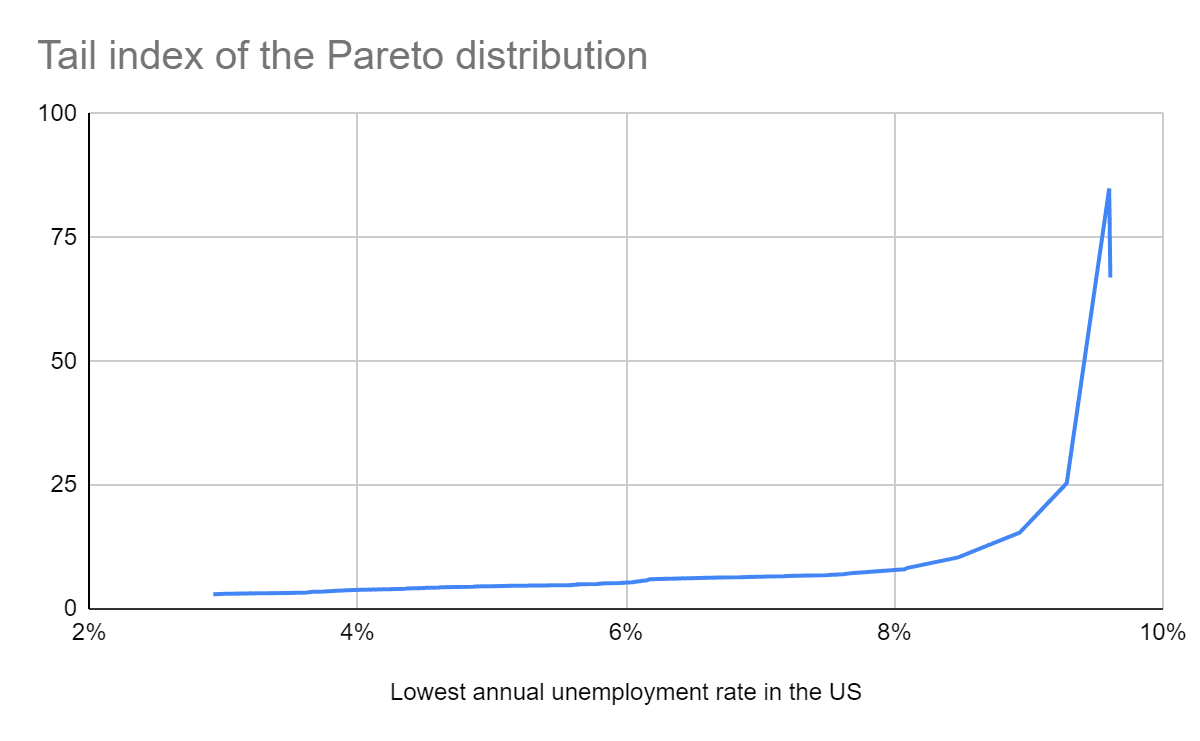
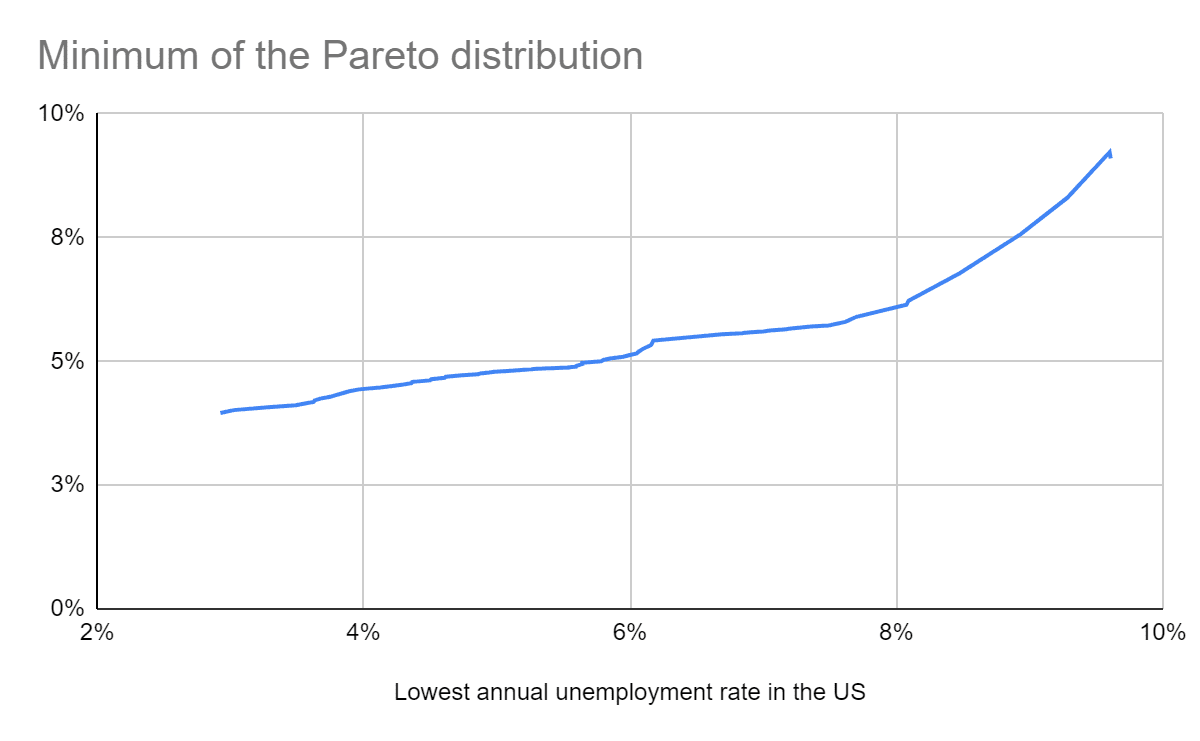
I fit Pareto distributions (power laws) to the 2, 3, … and 76 (= 2023 - 1948 + 1) highest values of the annual unemployment rate in the US from 1948 to 2023. To do this:
- I get the slope and intercept of linear regressions of the above sections of the tail distribution on the annual unemployment rate in the US.
- Since the tail distribution of a Pareto distribution is P(X > x) = (“minimum”/x)^“tail index”, ln(P(X > x)) = “tail index”*ln(“minimum”) - “tail index”*ln(x) = “intercept” + “slope”*ln(x), so I determine the parameters of the Pareto distributions from:
- “Tail index” = -“slope”.
- “Minimum” = e^(“intercept”/“tail index”).
Then I obtain the annual probability of an annual unemployment rate in the US of at least 10 %, 25 %, 50 %, 75 % and 100 %. Note unemployment requires not only not having a job, but also being actively looking for one:
Someone in the labor force is defined as unemployed if they were not employed during the survey reference week, were available for work, and made at least one active effort to find a job during the 4-week survey period.
The calculations are in this Sheet.
Results
Historical data
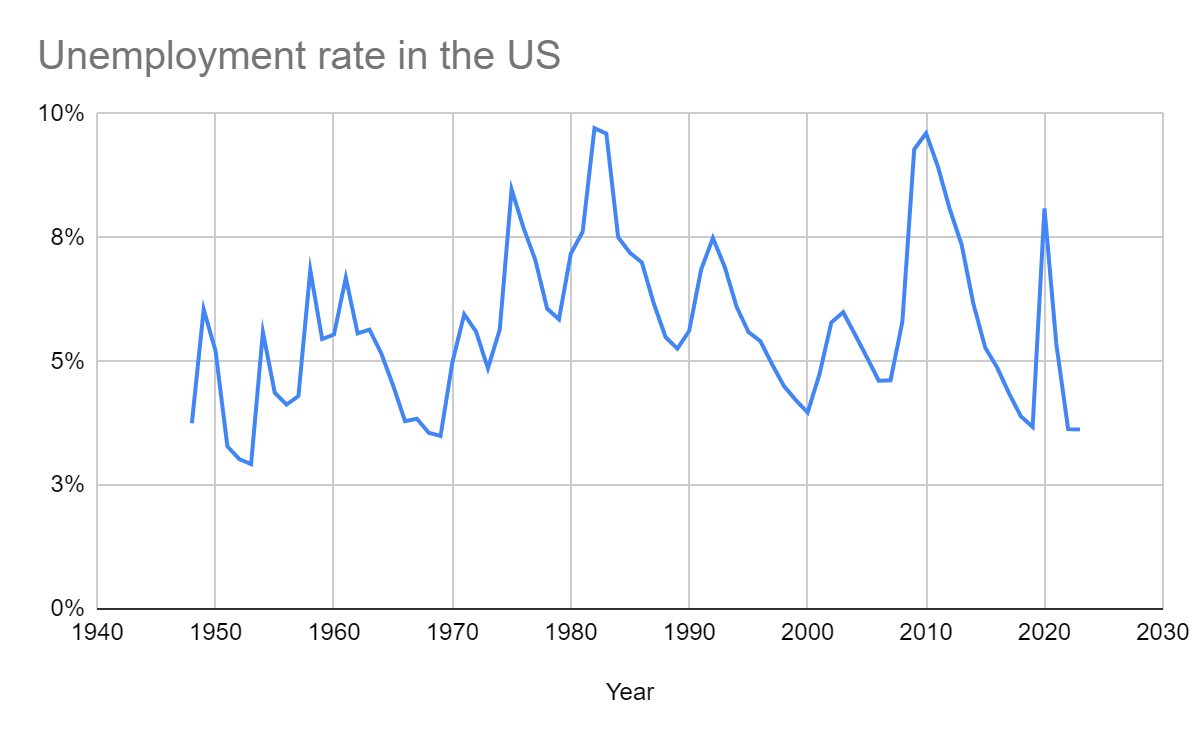
Time series
Basic stats
| Statistic | Annual unemployment rate in the US |
| Mean | 5.70 % |
| Minimum | 2.93 % |
| 5th percentile | 3.54 % |
| 10th percentile | 3.71 % |
| Median | 5.55 % |
| 90th percentile | 7.89 % |
| 95th percentile | 9.02 % |
| Maximum | 9.71 % |
Linear regression on the year
| Linear regression of the annual unemployment rate in the US on the year | ||
| Slope (pp/century) | Intercept (pp) | Coefficient of determination |
| 1.39 | -21.9 | 3.54 % |
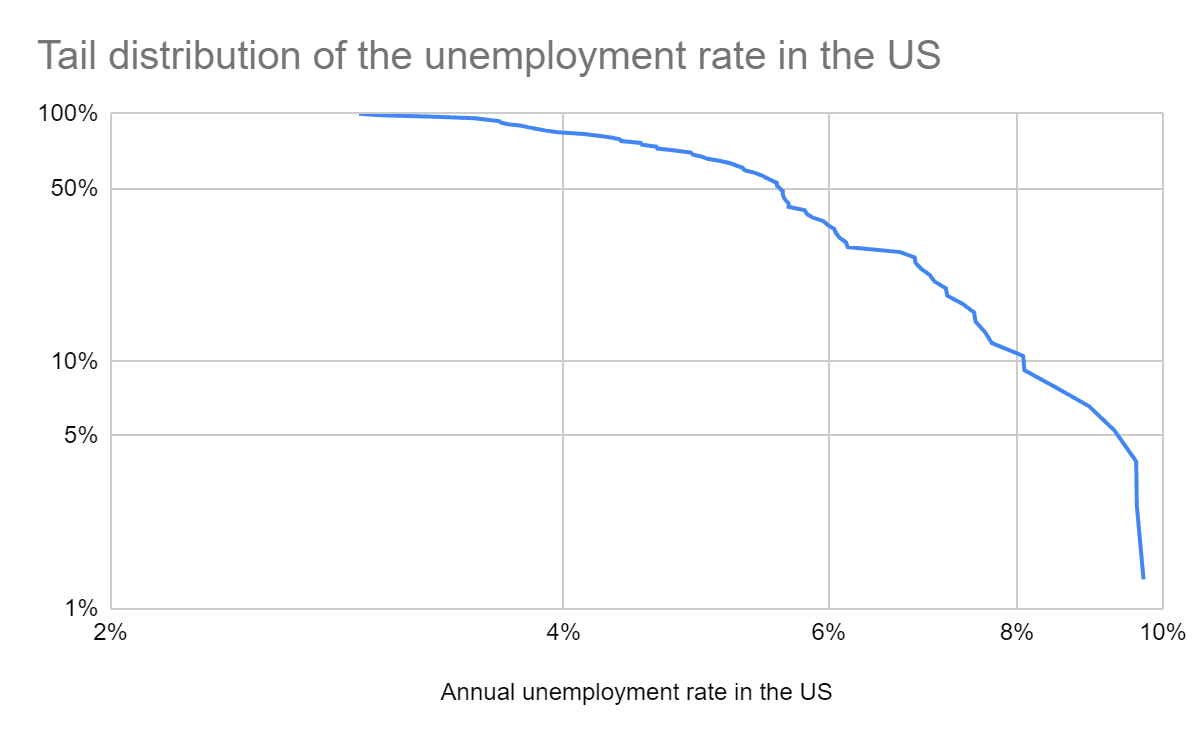
Tail distribution
Tail risk based on Pareto distributions
Discussion
Historical data
The 5th percentile, median and 95th percentile annual unemployment rate in the US from 1948 to 2023 were 3.54 %, 5.55 % and 9.02 %. The maximum was 9.71 % in 1982.
There has been a very weak upward trend in the annual unemployment rate in the US, with the R^2 of the linear regression of it on the year being 3.54 %.
The tail distribution of the annual unemployment rate in the US bends downwards in a log-log plot. I got a similar pattern for the annual conflict and epidemic/pandemic deaths as a fraction of the global population.
Tail risk
My estimates for the annual probability of an annual unemployment rate in the US of:
- At least 10 % range from 0.105 % to 6.54 %.
- 100 % range from 1.32*10^-88 to 0.00749 %.
For the Pareto distributions fit to the 10.5 % (8) rightmost points of the tail distribution in a log-log plot, the annual probability of this being:
- At least 10 % is 2.04 %.
- 100 % is 2.11*10^-10.
I believe the rightmost points of the tail should get the most weight to predict tail risk, which implies trusting lower estimates more. On the other hand, I expect inside view factors related to transformative AI (TAI) to push estimates upwards. All in all, I suspect many in the global catastrophic risk community underweight the outside view outlined in this post, and therefore overestimate the probability of massive unemployment.
Thanks for the comment, Johan!
It is hard for me to answer this. It depends on the methodology used to produce the inside view estimate. If this is just a guess from someone working on AI safety, I would put very little weight on it. If it is the output of a detailed quantitative empirical model like Epoch AI's, I could as a 1st approximation ignore the estimates from my post (although I would have to check the model to know).
Task automation has been happening for a long time (with the unemployment rate still being low), and one can think about advanced AI as a continuation of that trend. In addition, the definition of unemployment I used requires both not having a job and being actively looking for one. For sometime in the next few decades to centuries, I predict negligible human unemployment and roughly total AI automation (i.e. almost no human workers). I guess humans will just be happy letting the AIs do everything, and whoever wants to have a job (which will be a little bit of a fake job, as AIs would be able to perform the tasks more efficiently) will also have the chance to do it, i.e. there will be basically no humans actively looking for a job, and having no success (i.e. essentially no unemployment). More pessimistically, it is also possible to have almost total homelessness with negligible unemployment in a dystopian scenario where humans gave up looking for jobs because AIs are so much better, but still kind enough to give humans a subsistence income.
According to Table 1 (2) of Hanson 2000, the global economy used to double once every 230 k (224 k) years in hunting and gathering period of human history. Today it doubles once every 20 years or so[1]. Despite a much higher growth rate, the unemployment rate is still relatively low. So I do not think one can predict massive unemployment solely on the basis of AI boosting economic growth. Note am discussing what could happen in the real world, not what could happen in the absence of any mitigation actions.
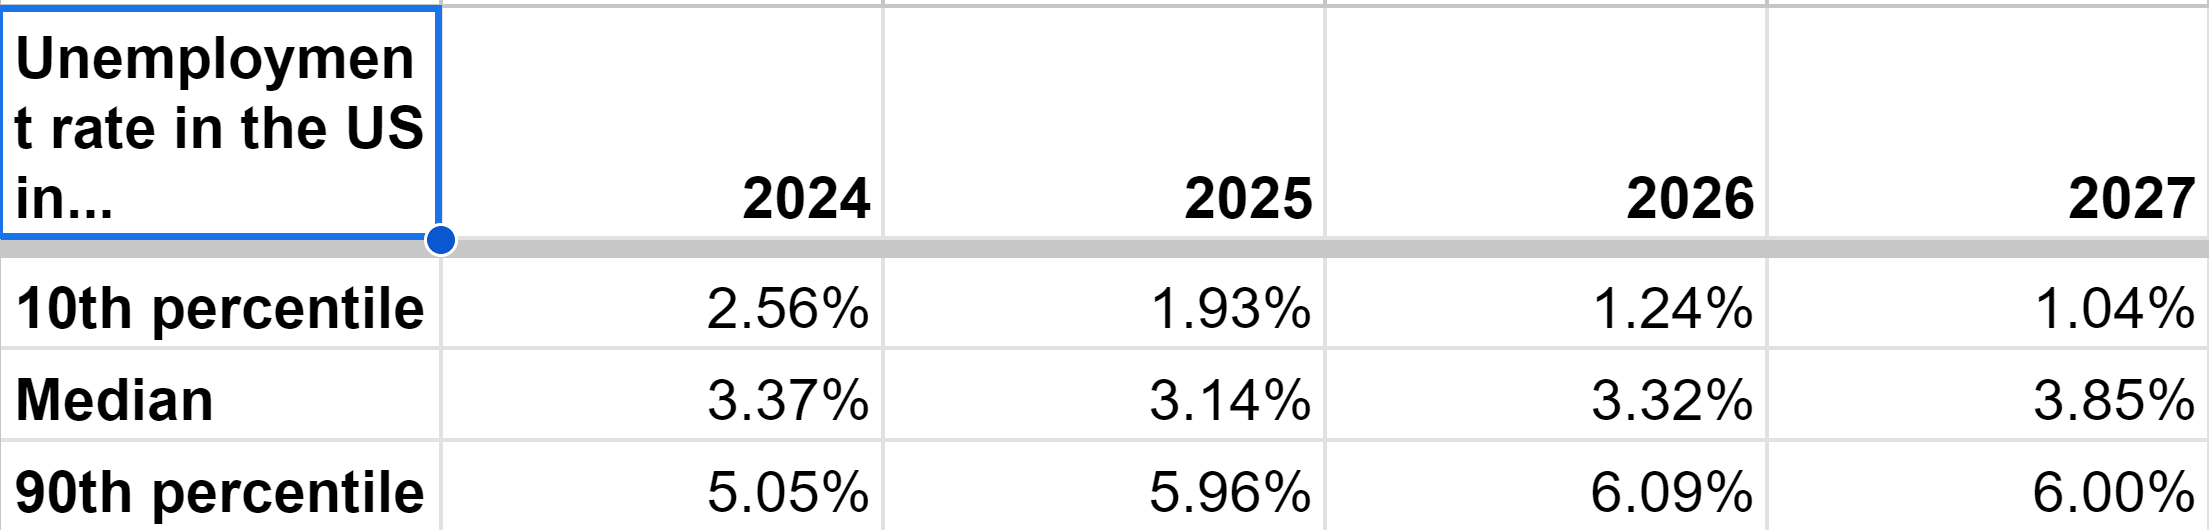
What is your median annual unemployment rate in the US in 2025, 2026 or 2027? If much higher than now, I am happy to set up a bet with you where:
My medians are not far from the ones suggested by historical data below, although I would want to think more about them if I was to bet 10 k€.
Thanks for engaging too!
The doubling time for 3 % annual growth is 23.4 years (= LN(2)/LN(1.03)).