Comments
I'm finding these surveys useful, this one in particular - thanks for doing them!
I'm finding these surveys useful, this one in particular - thanks for doing them!
On June 2nd-June 3rd 2023, Rethink Priorities conducted an online poll of US adults, to assess their views regarding a recent open statement from the Center for AI Safety (CAIS). The statement, which has been signed by a number of prominent figures in the AI industry and AI research communities, as well as other public figures, was:
“Mitigating the risk of extinction from AI should be a global priority alongside other societal-scale risks such as pandemics and nuclear war.”
The goal of this poll was to determine the degree to which the American public’s views of AI risk align with this statement.
The poll covered opinions regarding[1]:
Our population estimates reflect the responses of 2407 US adults, poststratified to be representative of the US population.[2] See the Methodology section of the Appendix for more information on sampling and estimation procedures.
Key findings
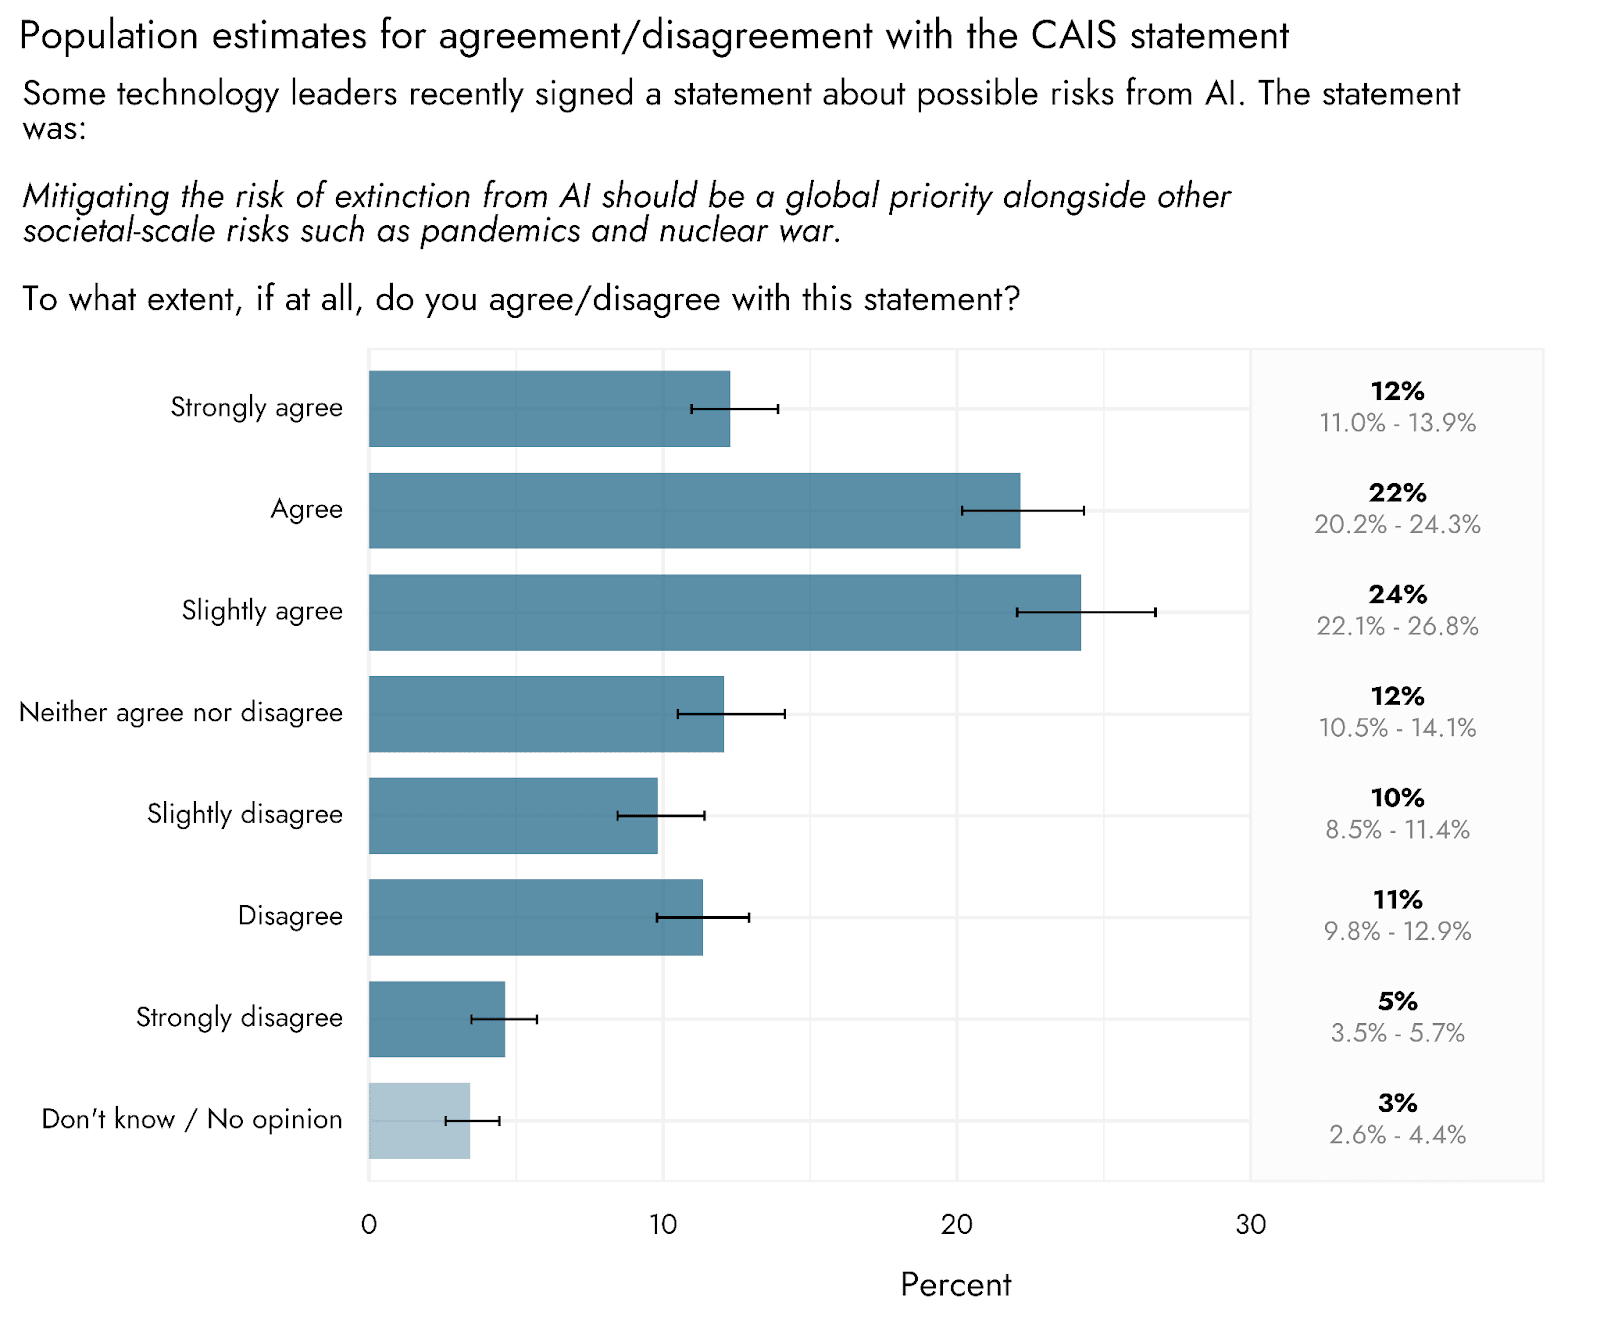
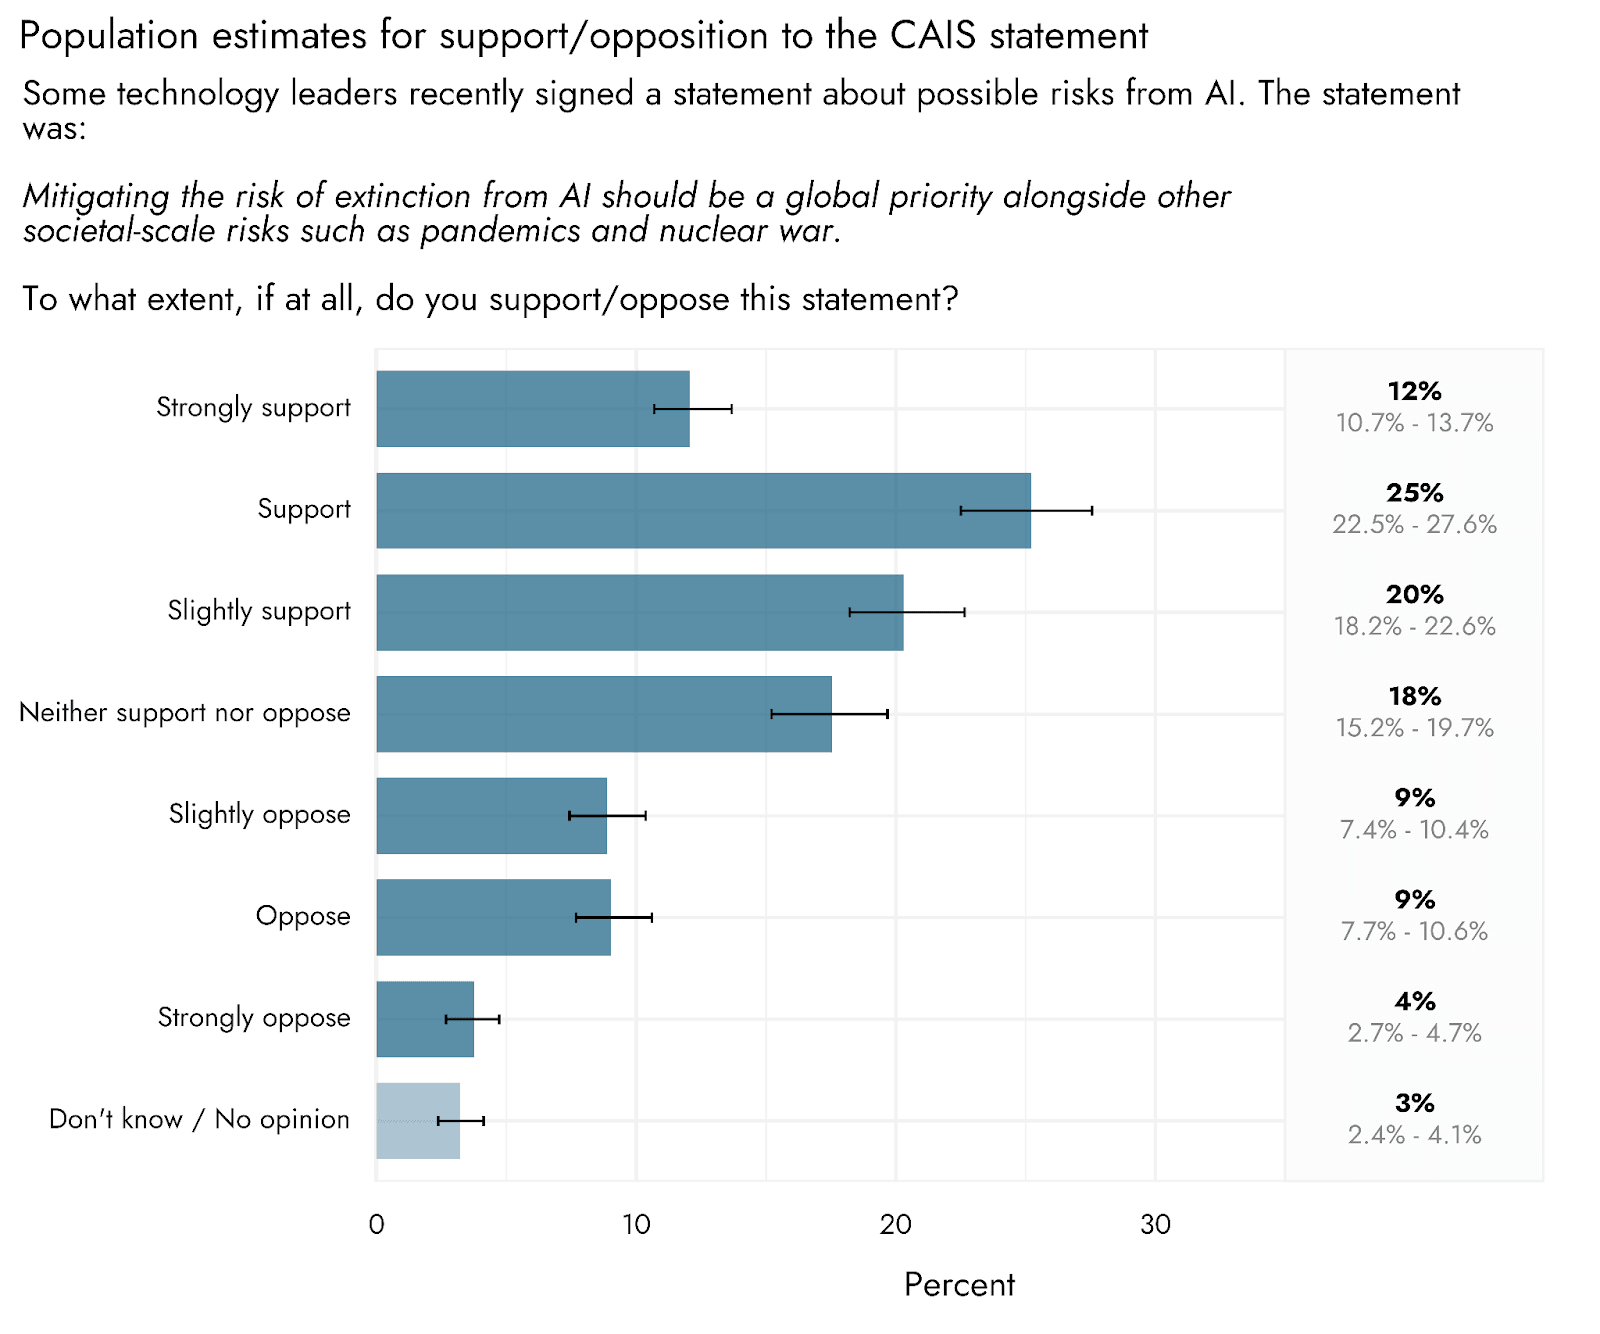
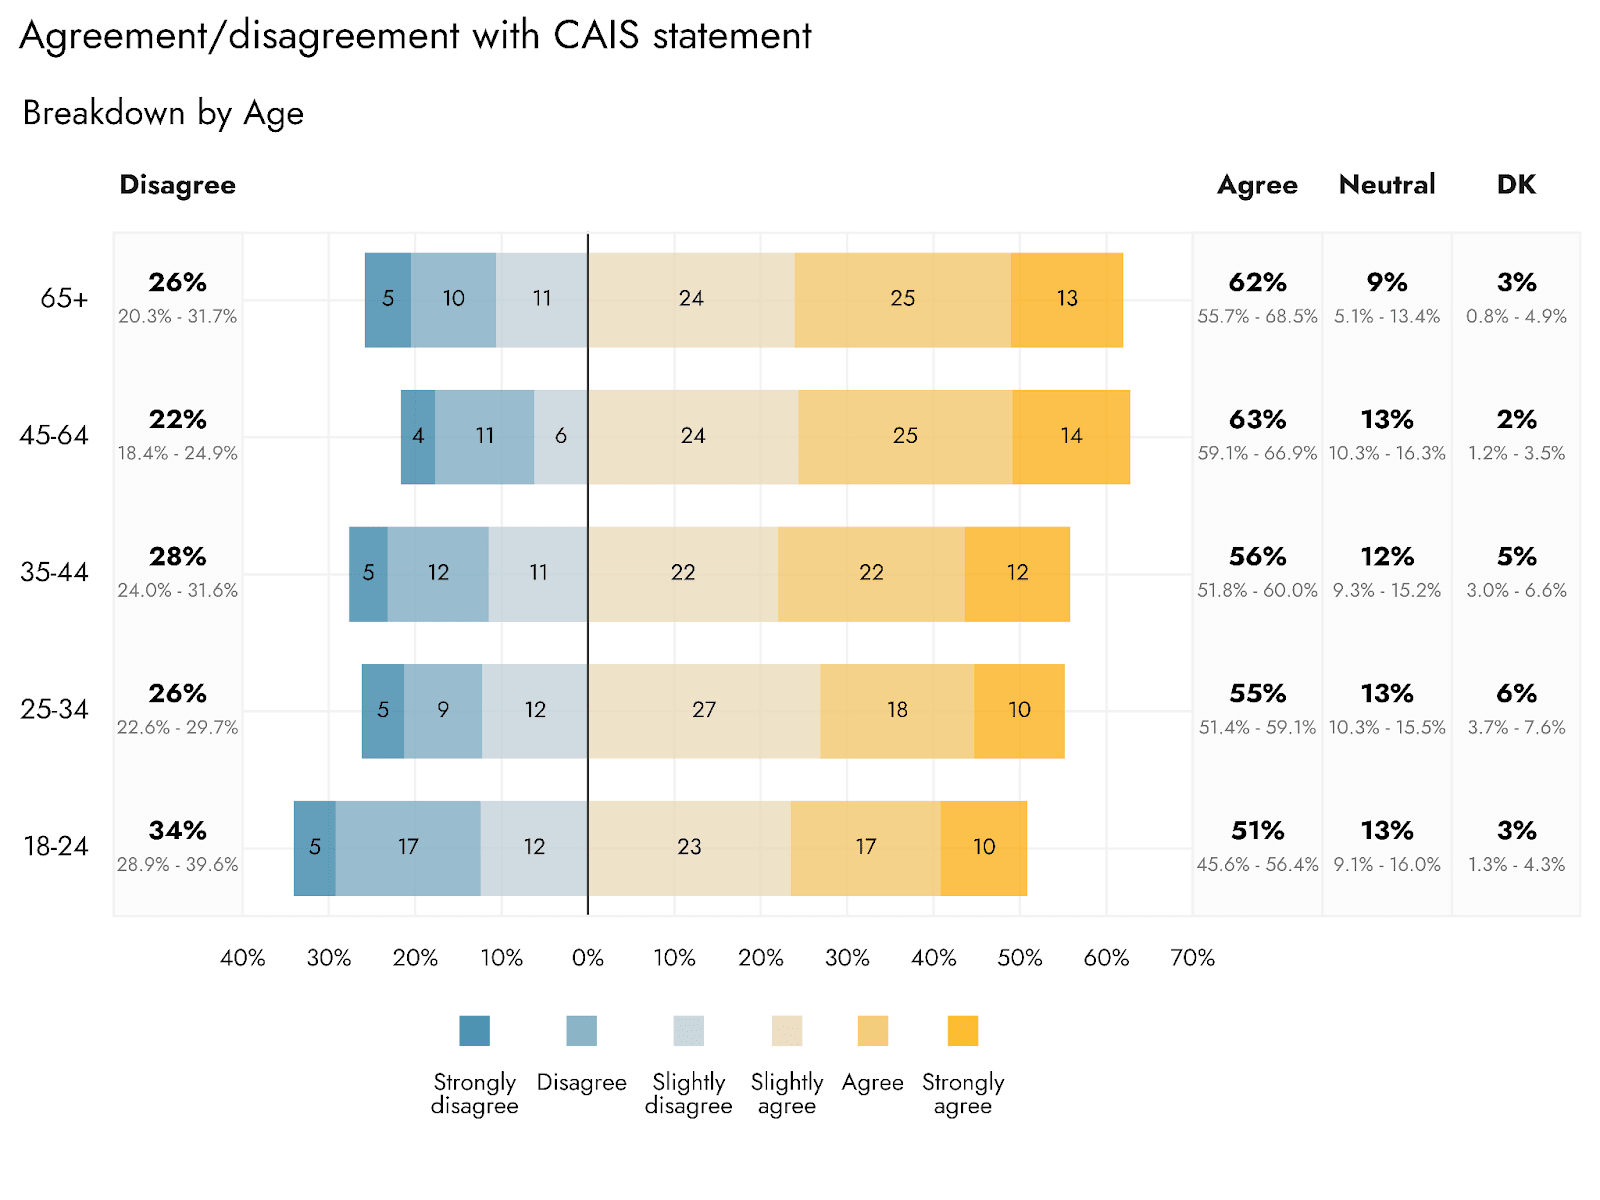
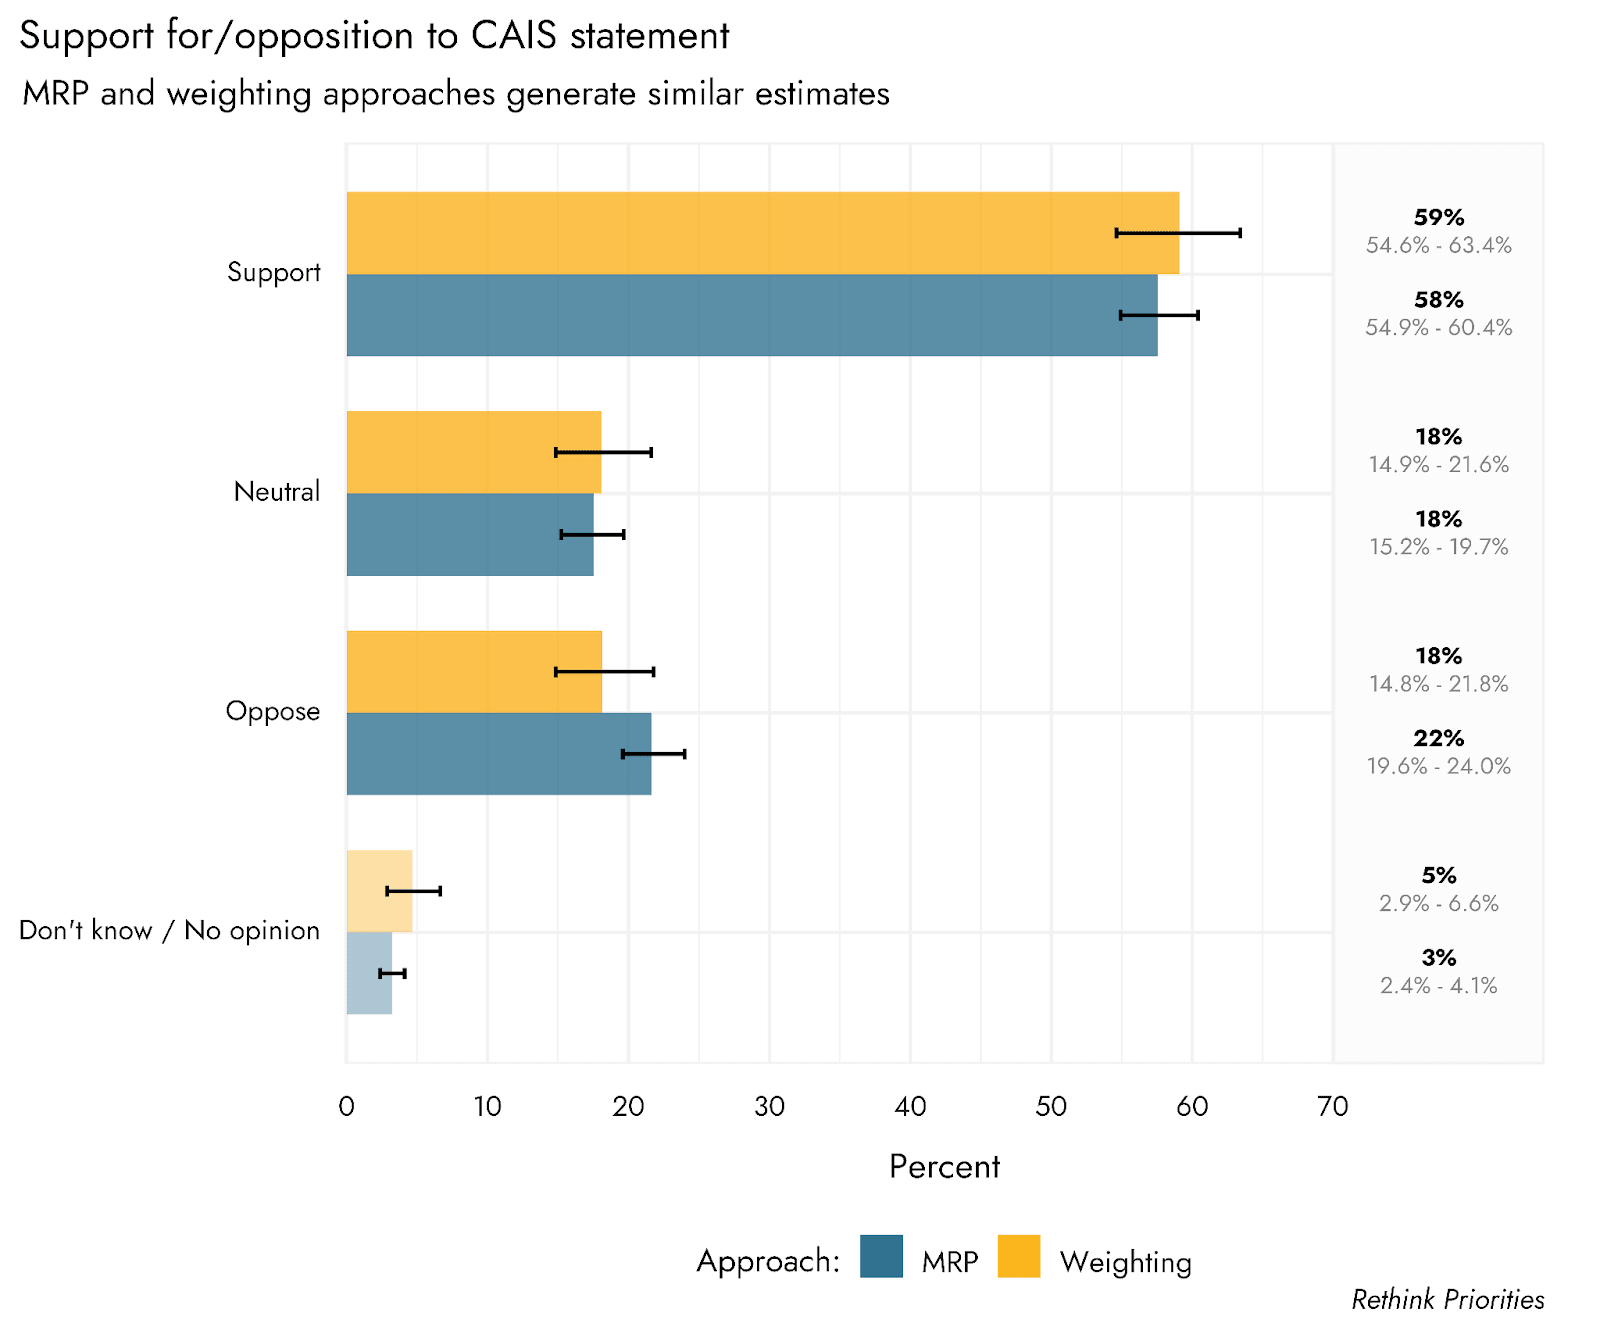
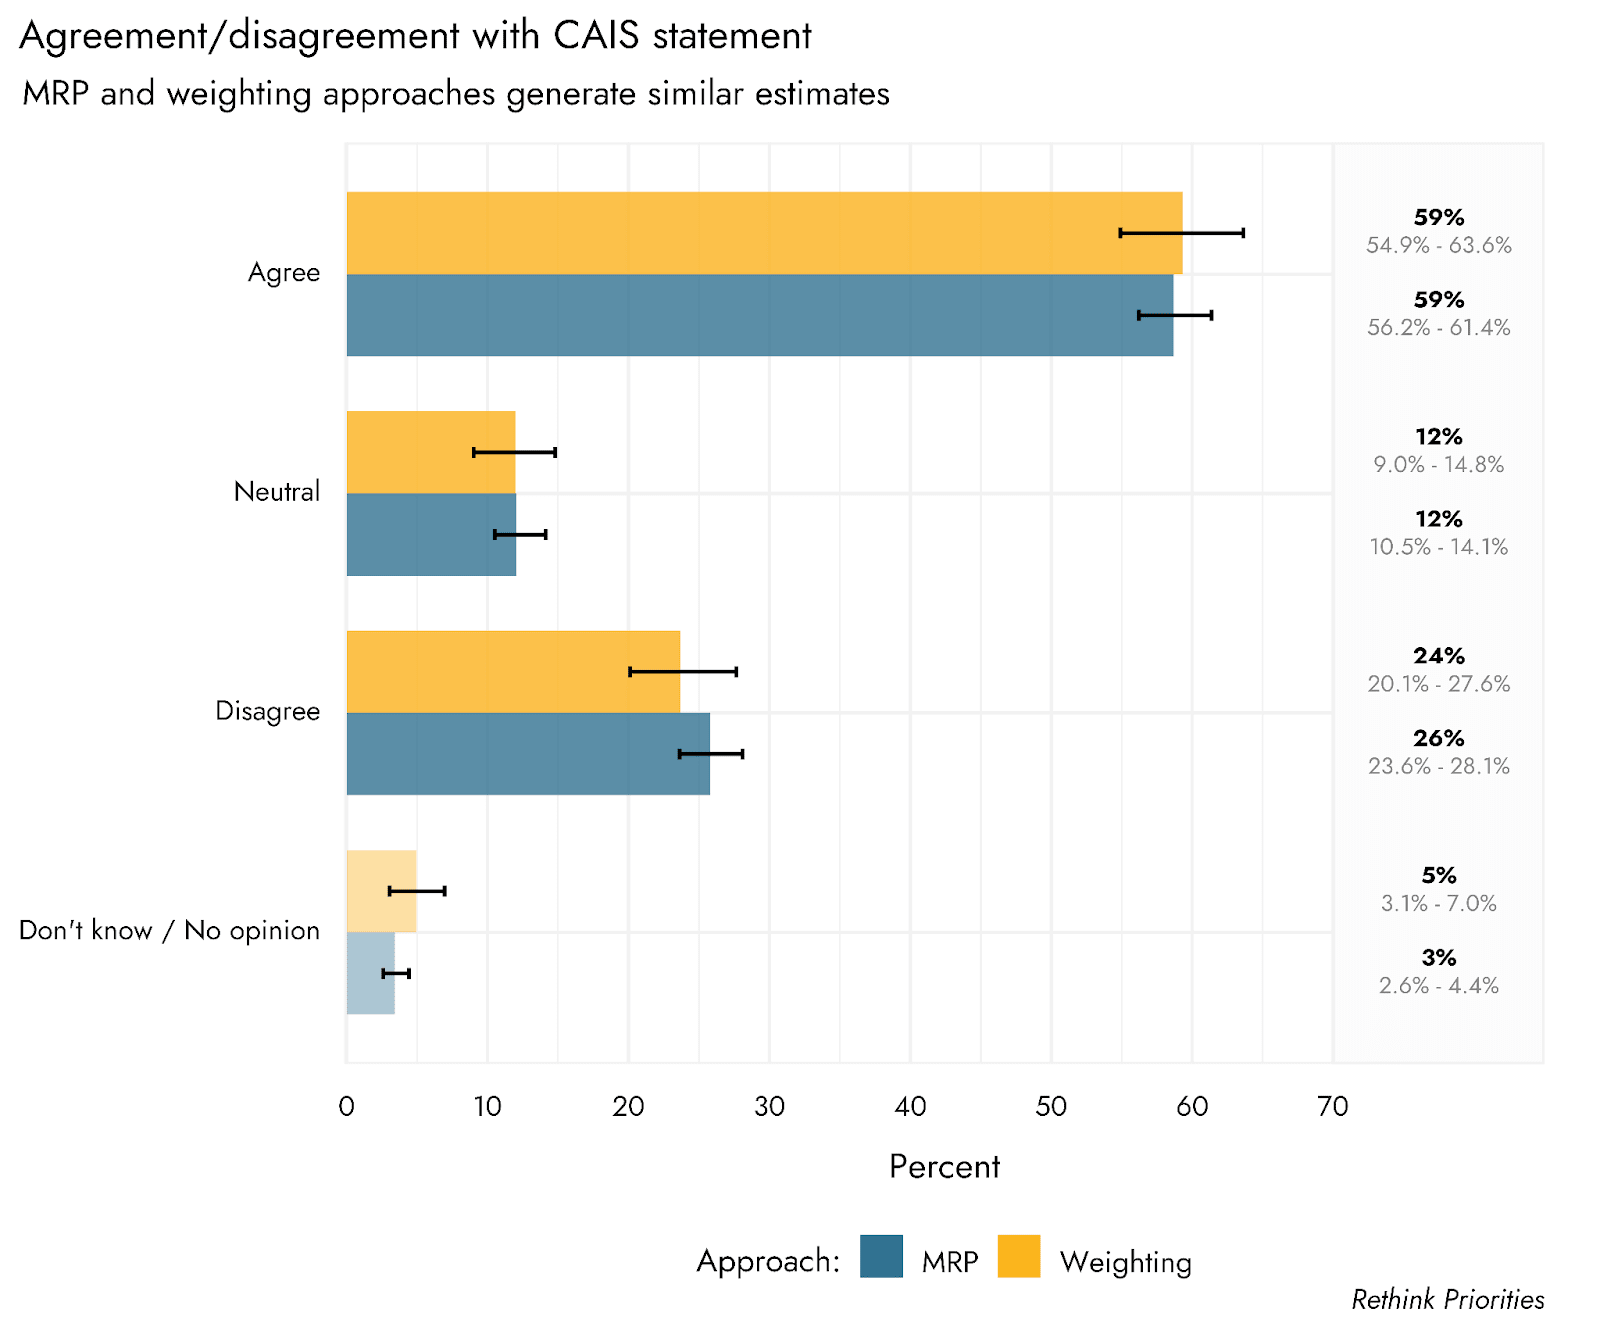
Respondents were presented with the CAIS statement on AI risk, and asked to indicate both the extent to which they agreed/disagreed with it, and the extent to which they supported/opposed it.[3] We estimate that the US population broadly agrees with (59%) and supports (58%) the statement. Disagreement (26%) and opposition (22%) were relatively low, and sizable proportions of people remained neutral (12% and 18% for agreement and support formats, respectively).
It is important to note that agreement with or support of this statement may not translate to agreement with or support of more specific policies geared towards actually making AI risk a comparable priority to pandemics or nuclear weapons. People may also support certain concrete actions that serve to mitigate AI risk despite not agreeing that it is of comparable concern to pandemics or nuclear security.
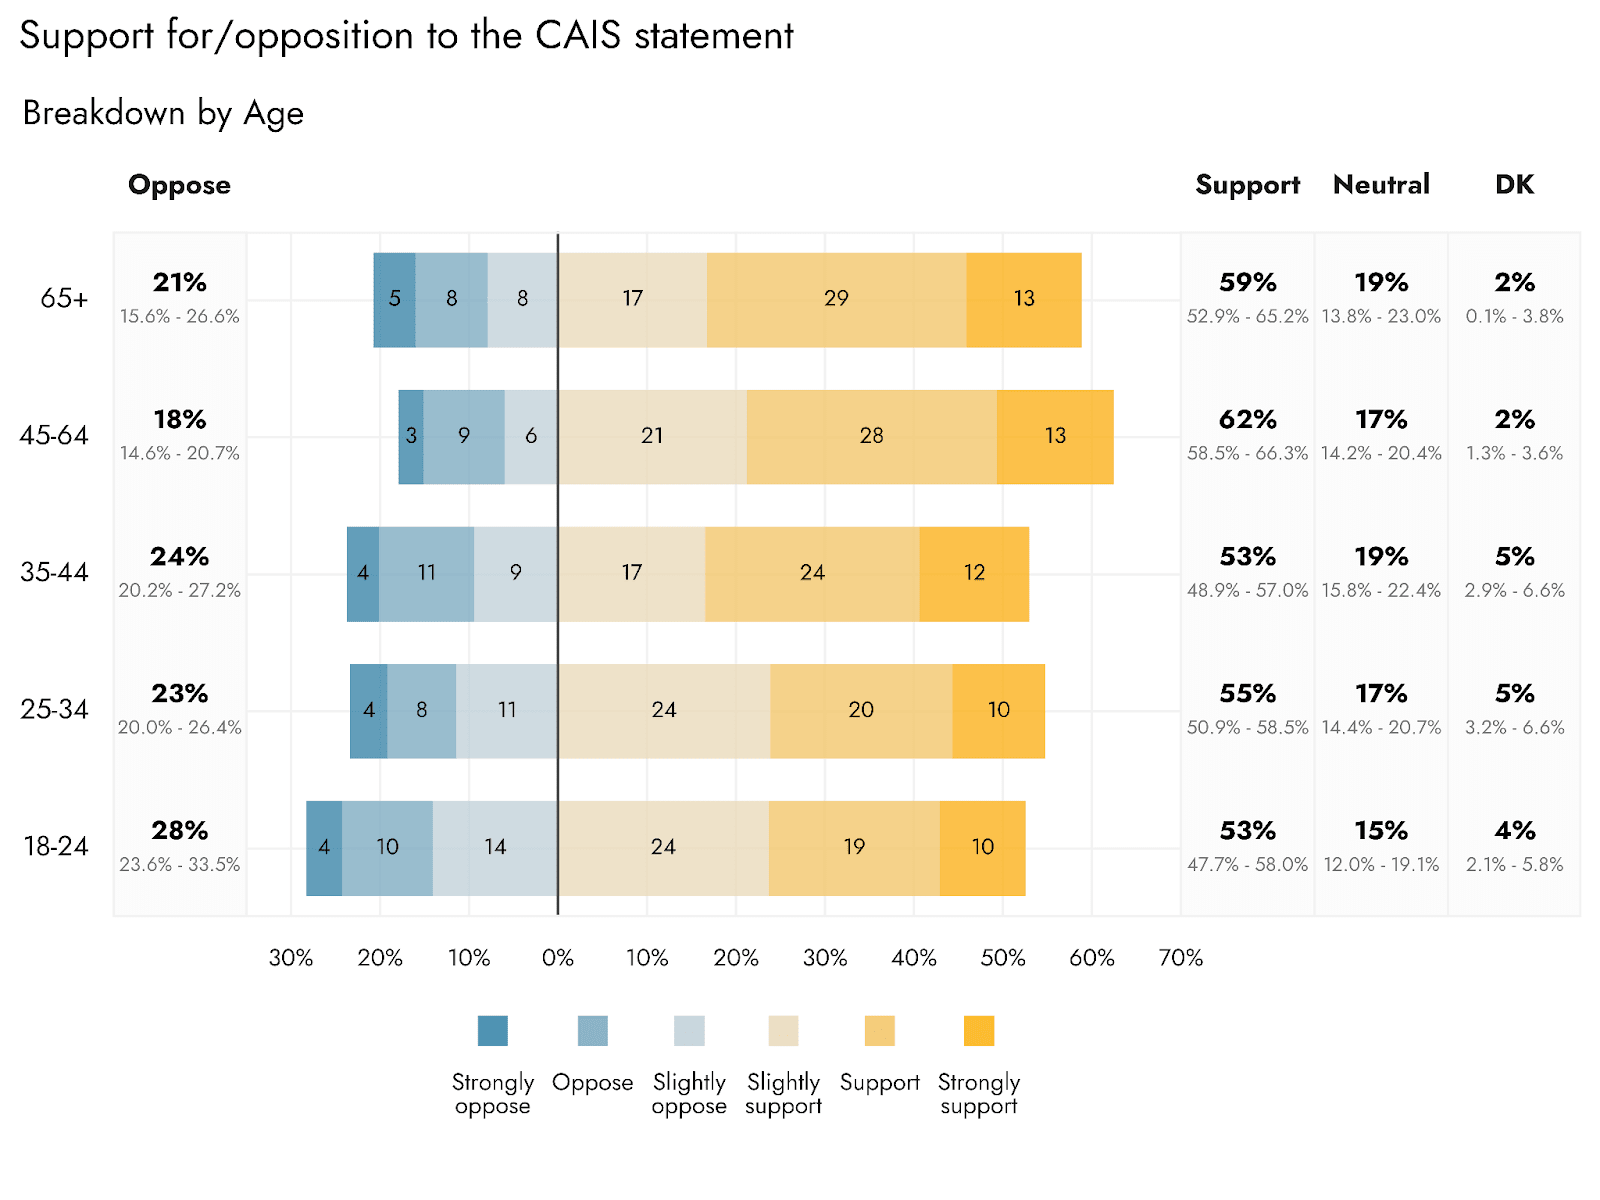
The level of agreement/support appears to vary with age: the youngest age brackets of 18-24 are expected to show the most disagreement with/opposition to the statement. However, all ages were still expected to have majority support for the statement.
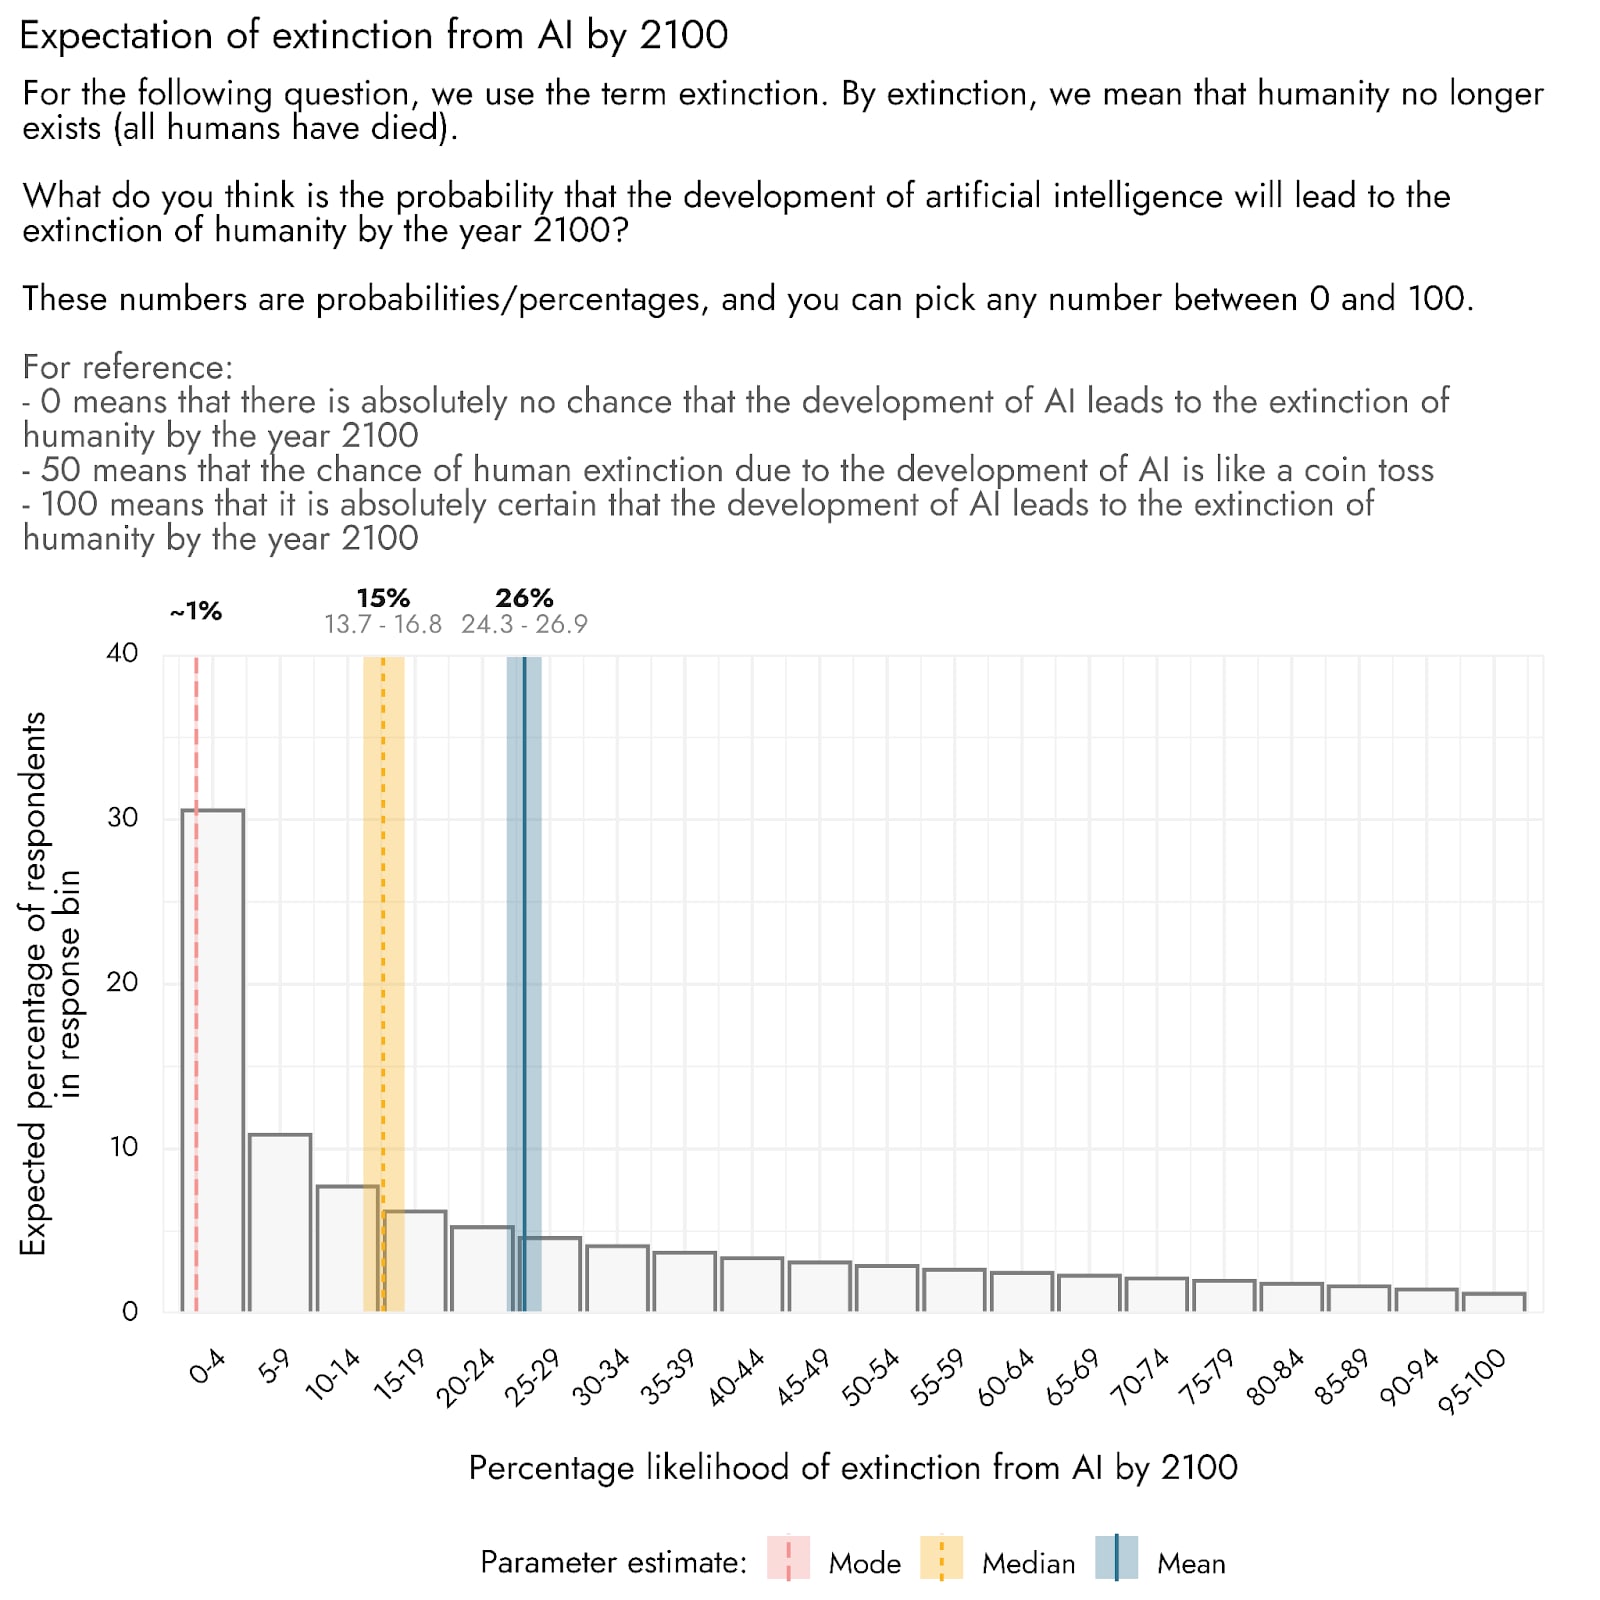
We were interested to understand how likely the public believed the risk of extinction from AI to be. In our previous survey of AI-related attitudes and beliefs, we asked about AI risk on an ordinal scale, with an estimated majority (66%) of the US population thinking this outcome to be ‘not at all likely’. For this version of the survey, we asked respondents to provide an actual percentage likelihood that AI would cause human extinction by the year 2100.
Although we estimate that the average expectation of extinction from AI in the population is a relatively high 26%, the distribution of responses is heavily skewed. The median response is 15%, meaning that 50% of US adults are expected to give a likelihood rating of approximately 15% or less, and 50% would give an estimate of approximately 15% or more. Furthermore, the most common expected response is approximately 1%. Hence, the average likelihood may give a somewhat misleading impression of what the general public thinks about the likelihood of extinction. Based on an additional model, we estimate the proportion of the population that would pick absolutely 0 to be 13% (11.1%-14.6%).
Estimates from influential figures discussing the risk of extinction caused by AI vary considerably. Estimates, collated by Scott Alexander, vary between 2% and 3% from Scott Aaronson and Will MacAskill respectively, and >90% from Eliezer Yudkowsky, with the median estimate from a survey of AI researchers around 5-10%.
Hence, the extent to which these public estimates can be seen to align with the views of the community of researchers concerned about AI risk depends on who one takes to be the reference point for that community, though public estimates are not obviously very out of step from community estimates.
Decision makers and communicators may benefit from keeping in mind that many of those whom they reach may initially believe that extinction from AI is very unlikely. Reports presenting estimates of percentages such as these should also be careful when summarizing their results: showing the distribution of responses is likely more informative and faithful than single summary statistics, and it is very unlikely that such percentage estimates will be well described by a mean and standard deviation.
It should also be noted that just because respondents gave their answers in the form of probabilities, it does not mean that they have a sound comprehension of exactly what the different probability ratings imply. We also expect people’s responses could be very susceptible to how the question is posed and the response options available to them. In future research, we could examine the probabilities people assign to a range of different extinction threats or other relevant outcomes, to better assess the relative risk assigned to AI, as well as better understand how well-calibrated the public estimates of risk are.
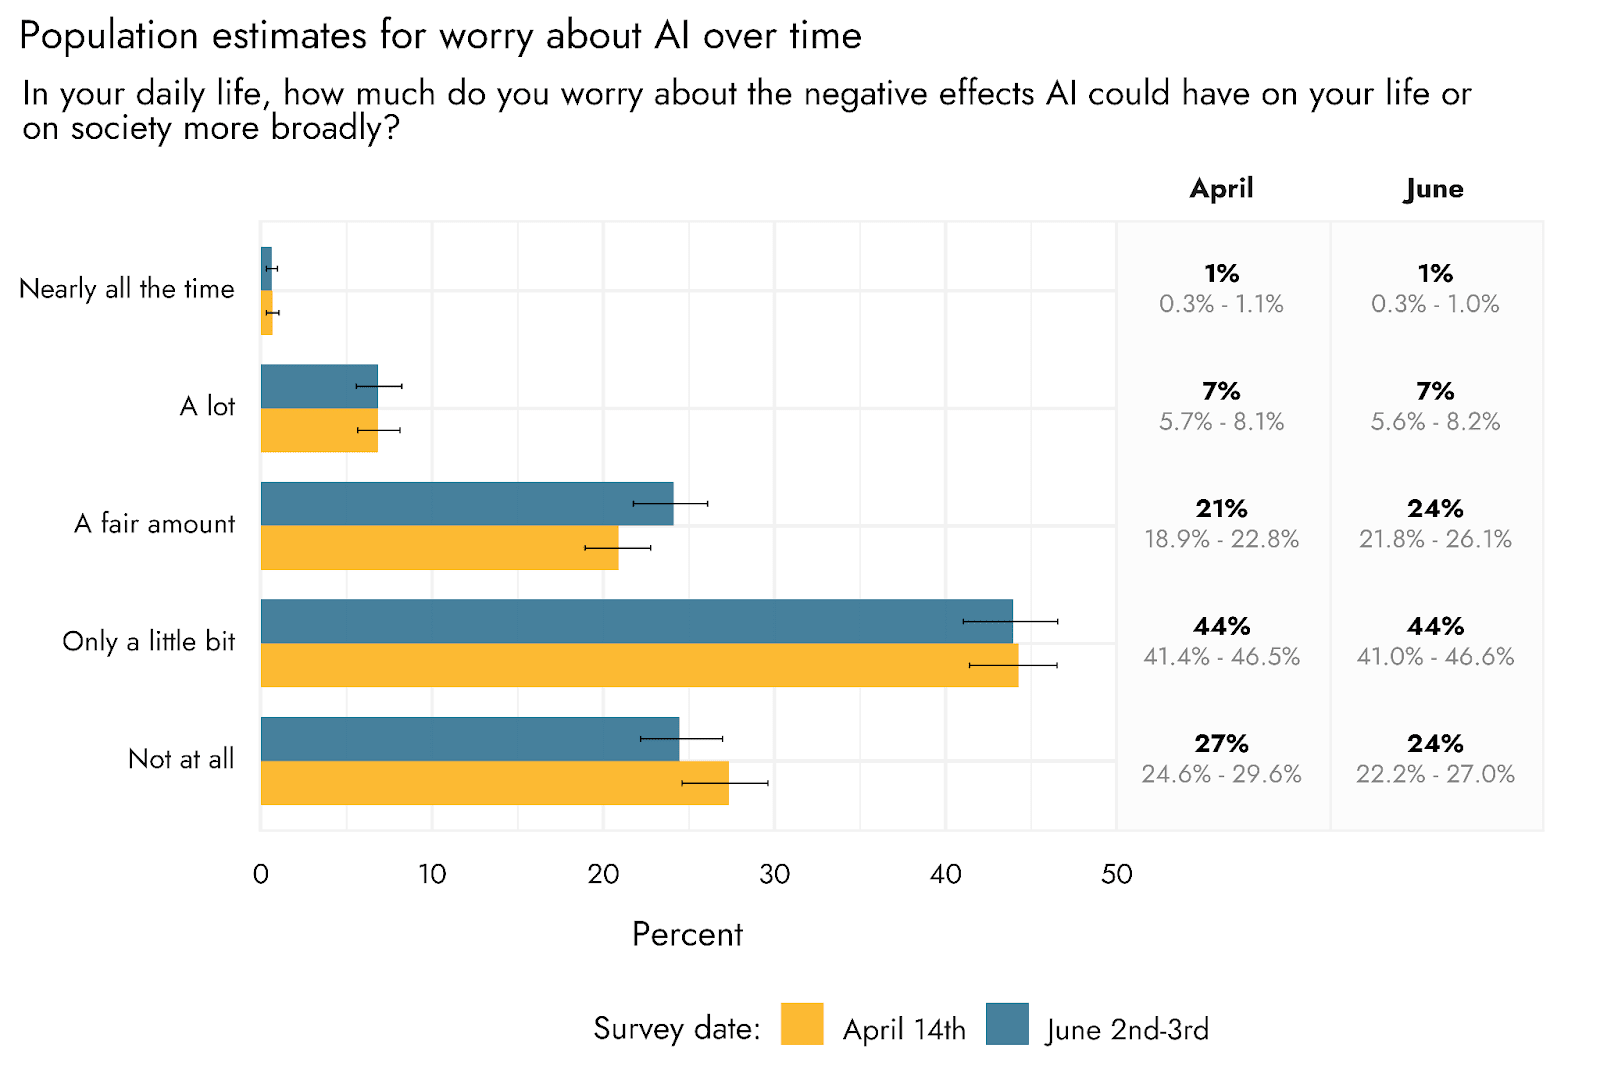
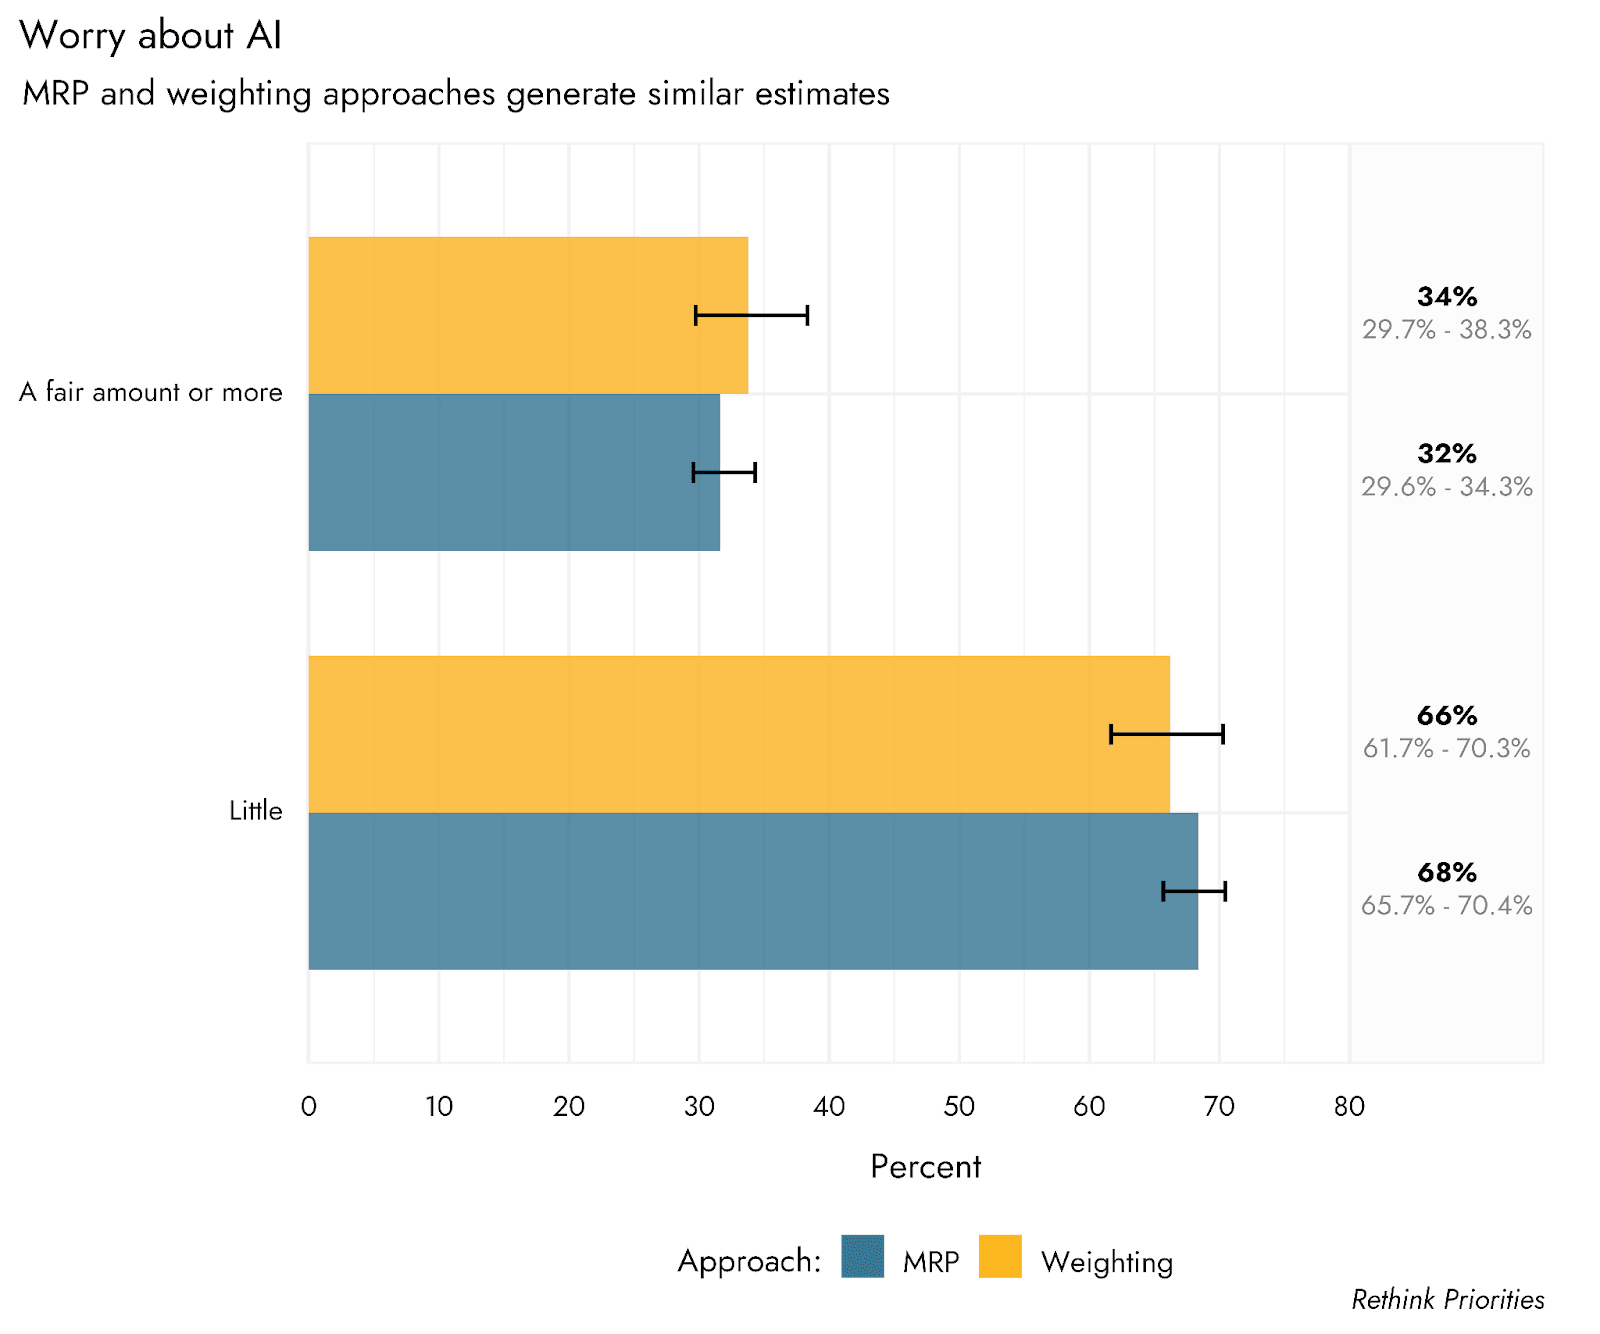
As with our previous survey in April, we asked respondents to indicate the extent to which they worried about the negative effects of AI in their daily lives. Comparing our most recent responses to those of April, we can see that the overall response tendencies are very similar, with most of the population (68%) estimated to worry at most ‘only a little bit’ in this survey. There is a small indication of potential change over time, with less (24% vs. 27%) of the population estimated to respond ‘Not at all’ in June, and more (24% vs. 21%) responding ‘A fair amount’.
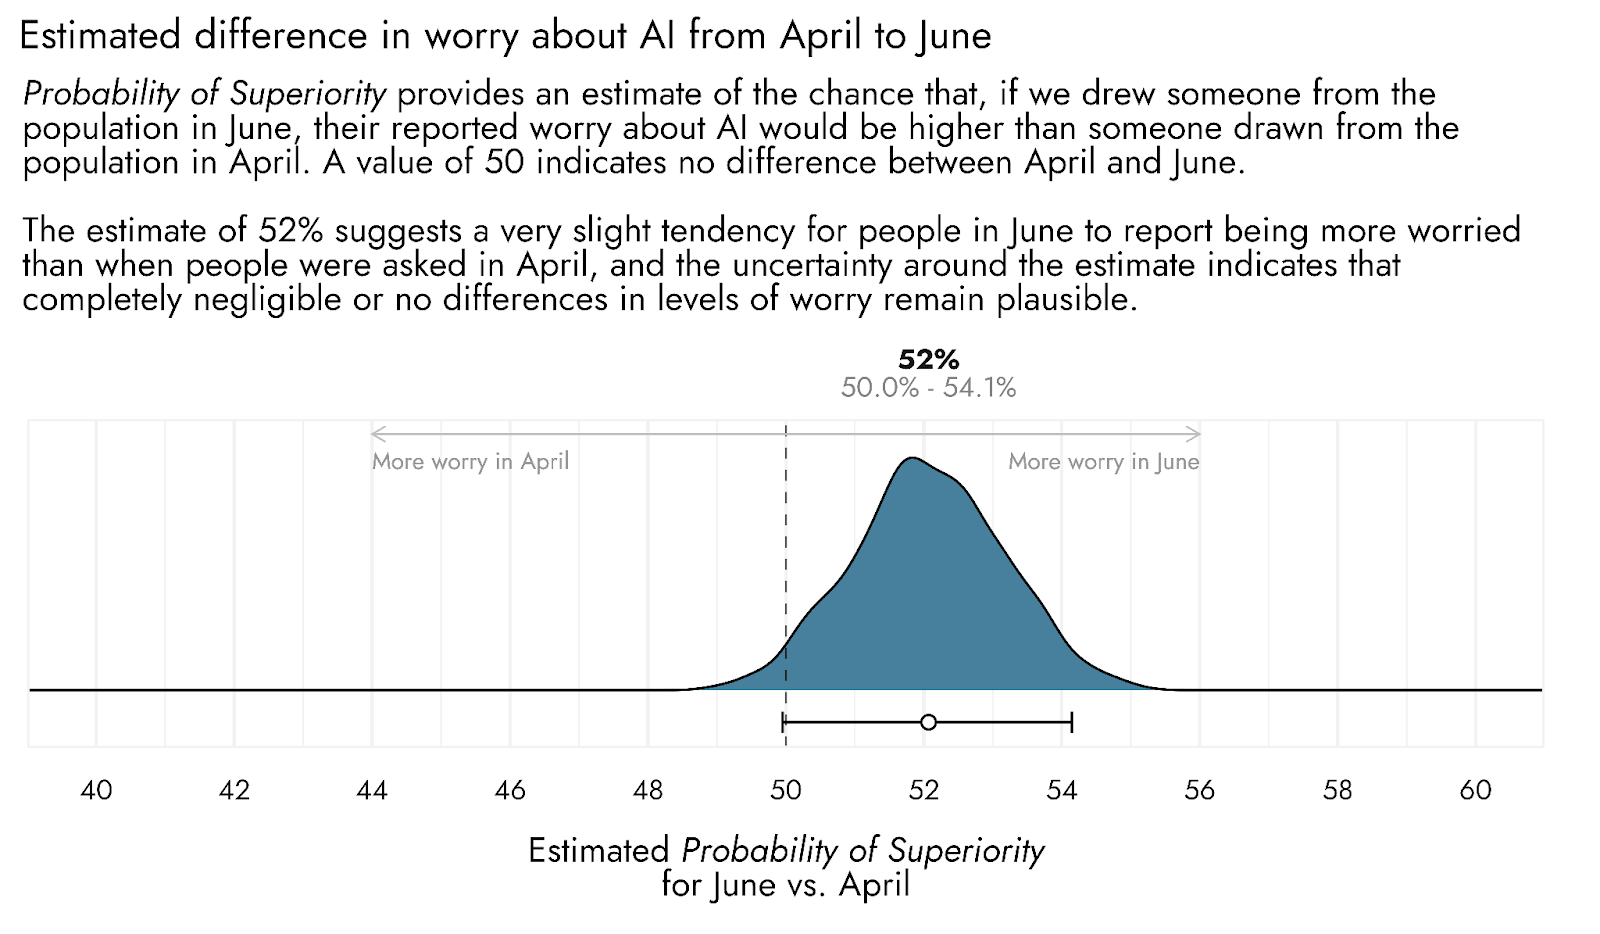
Comparing these population estimates with one another using a Probability of Superiority effect size metric, we estimate that if you were to pick a member of the US population at random in early June, and a member at random in mid April, there would be a 52% chance that the June respondent would have a higher level of worry.[4] Hence, there is a slight tendency for greater levels of worry in June, but the distributions are essentially equal (50% in Probability of Superiority indicates equivalence of the populations compared). If there is a difference, it would appear to be small, with the uncertainty around the estimate also including completely negligible differences over time and some probability of very small differences in the opposite direction.
The estimates from this poll suggest that the US public is largely supportive of a recent statement from the Center for AI Safety, which aimed to place AI risk mitigation alongside other societal-scale risks such as pandemics and nuclear war. This finding is in line with our previous poll showing that US adults would favor regulation of AI and even a pause on some types of AI development. However, we estimate that most US adults do not actively worry about the negative effects of AI.
AI risk mitigation is still only just surfacing as an area of public discourse, and we expect that current events and media coverage still have a major role to play in shaping public perceptions. We will continue to conduct timely work in this area to better understand how public opinion changes or consolidates over time.
Jamie Elsey and David Moss wrote this report. Jamie Elsey and David Moss developed the survey. Jamie Elsey performed the analyses and data visualization. We would also like to thank Peter Wildeford and external reviewers for review of and suggestions to the final draft of this report.
On June 2nd-June 3rd 2023, Rethink Priorities conducted an online poll regarding public attitudes towards a recently made statement regarding AI risk, as well as public perceptions of AI risk and its importance as a policy issue.
The poll sampled 2503 US respondents aged 18 or above on the online sampling pool Prolific, of whom 2407 consented, answered questions, and passed requisite attention checks for the analyses presented below. We then used Multilevel Regression and Poststratification (MRP) to generate population-level estimates for US adult public opinion, accounting for Age, Sex, Race, Household Income, Education, Political party affiliation, as well as the US State/District and 2020 Republican vote share for the state.
MRP is a technique that can be used to estimate outcomes in a specific target population based upon a potentially unrepresentative sample population. In brief, the technique involves generating estimates of how a range of features (e.g., education, income, age) are associated with the outcome of interest from the sampled population, using multilevel regression. Based on the known distribution of combinations of these features in the target population, the poststratification step then involves making predictions from the multilevel regression model for the target population. This approach is widely used to make accurate predictions of population level opinion and voting based upon unrepresentative samples (e.g., Wang, W., Rothschild, D., Goel, S., & Gelman, A. (2015). Forecasting elections with non-representative polls. International Journal of Forecasting, 31(3), 980-991.), and also allows inferences to be made about specific subgroups within the population of interest.
Given that our sample was generated from online respondents, there are some concerns that despite efforts to make the sample representative of the population, we cannot represent certain kinds of people who are simply not online. In data from 2021 from Pew Research, it was estimated that around 7% of US adults would report never using the internet. To try to correct for the possibility that an overly online sample might affect our results, we did include an assessment of internet frequency, and were then able to weight the sample according to answers to that question. Including this outcome variable is not possible in the MRP approach, but can be included in weights. As shown in the plots below, there is little if any difference between our MRP estimates and those generated by using an alternative weighting protocol that includes internet use frequency. However, it is not possible to generate estimates for people who are almost completely offline using an online poll. Given that this is a small minority of the population, however, their responses would have to be dramatically different from the general population to substantially shift the overall estimates.
This section contains information regarding details of the survey design, implementation, and analysis, as proposed by the American Association of Public Opinion Research (AAPOR).
Three additional questions were included which do not feature in the present report
Population estimates incorporate Age, Sex, Race, Household Income, Education, Political party affiliation, as well as the US State/District and its 2020 Republican presidential vote share. The poll sampled 2503 US respondents aged 18 or above on the online sampling pool Prolific, of whom 2407 consented, answered questions, and passed requisite attention checks for the analyses presented below.
Which of these formats was asked first was counterbalanced across participants, and whether agreement/support or disagreement/opposition were placed in ascending or descending order was also randomized across respondents.
This is not precisely correct, in that some ratings would be exactly equal, rather than always being either higher or lower. Probability of Superiority deals with this by essentially saying that if two scores are exactly equal, then it is as if either one is equally likely to be higher or lower (so if all responses were equal, then Probability of Superiority would be 50%). The exact specification of Probability of Superiority is: sum(A > B) + (0.5 * sum(A = B)) + (0 * sum(A < B)) / Number of comparisons). To express this proportion as a percentage we multiply it by 100.


I'd wondered about this. Doing this survey seems like a really useful contribution. Thanks!
Much appreciated Howie, thanks!