David_Moss
Bio
I am the Principal Research Director at Rethink Priorities. I lead our Surveys and Data Analysis department and our Worldview Investigation Team.
The Worldview Investigation Team previously completed the Moral Weight Project and CURVE Sequence / Cross-Cause Model. We're currently working on tools to help EAs decide how they should allocate resources within portfolios of different causes, and to how to use a moral parliament approach to allocate resources given metanormative uncertainty.
The Surveys and Data Analysis Team primarily works on private commissions for core EA movement and longtermist orgs, where we provide:
- Private polling to assess public attitudes
- Message testing / framing experiments, testing online ads
- Expert surveys
- Private data analyses and survey / analysis consultation
- Impact assessments of orgs/programs
Formerly, I also managed our Wild Animal Welfare department and I've previously worked for Charity Science, and been a trustee at Charity Entrepreneurship and EA London.
My academic interests are in moral psychology and methodology at the intersection of psychology and philosophy.
How I can help others
Survey methodology and data analysis.
Posts 74
Comments662
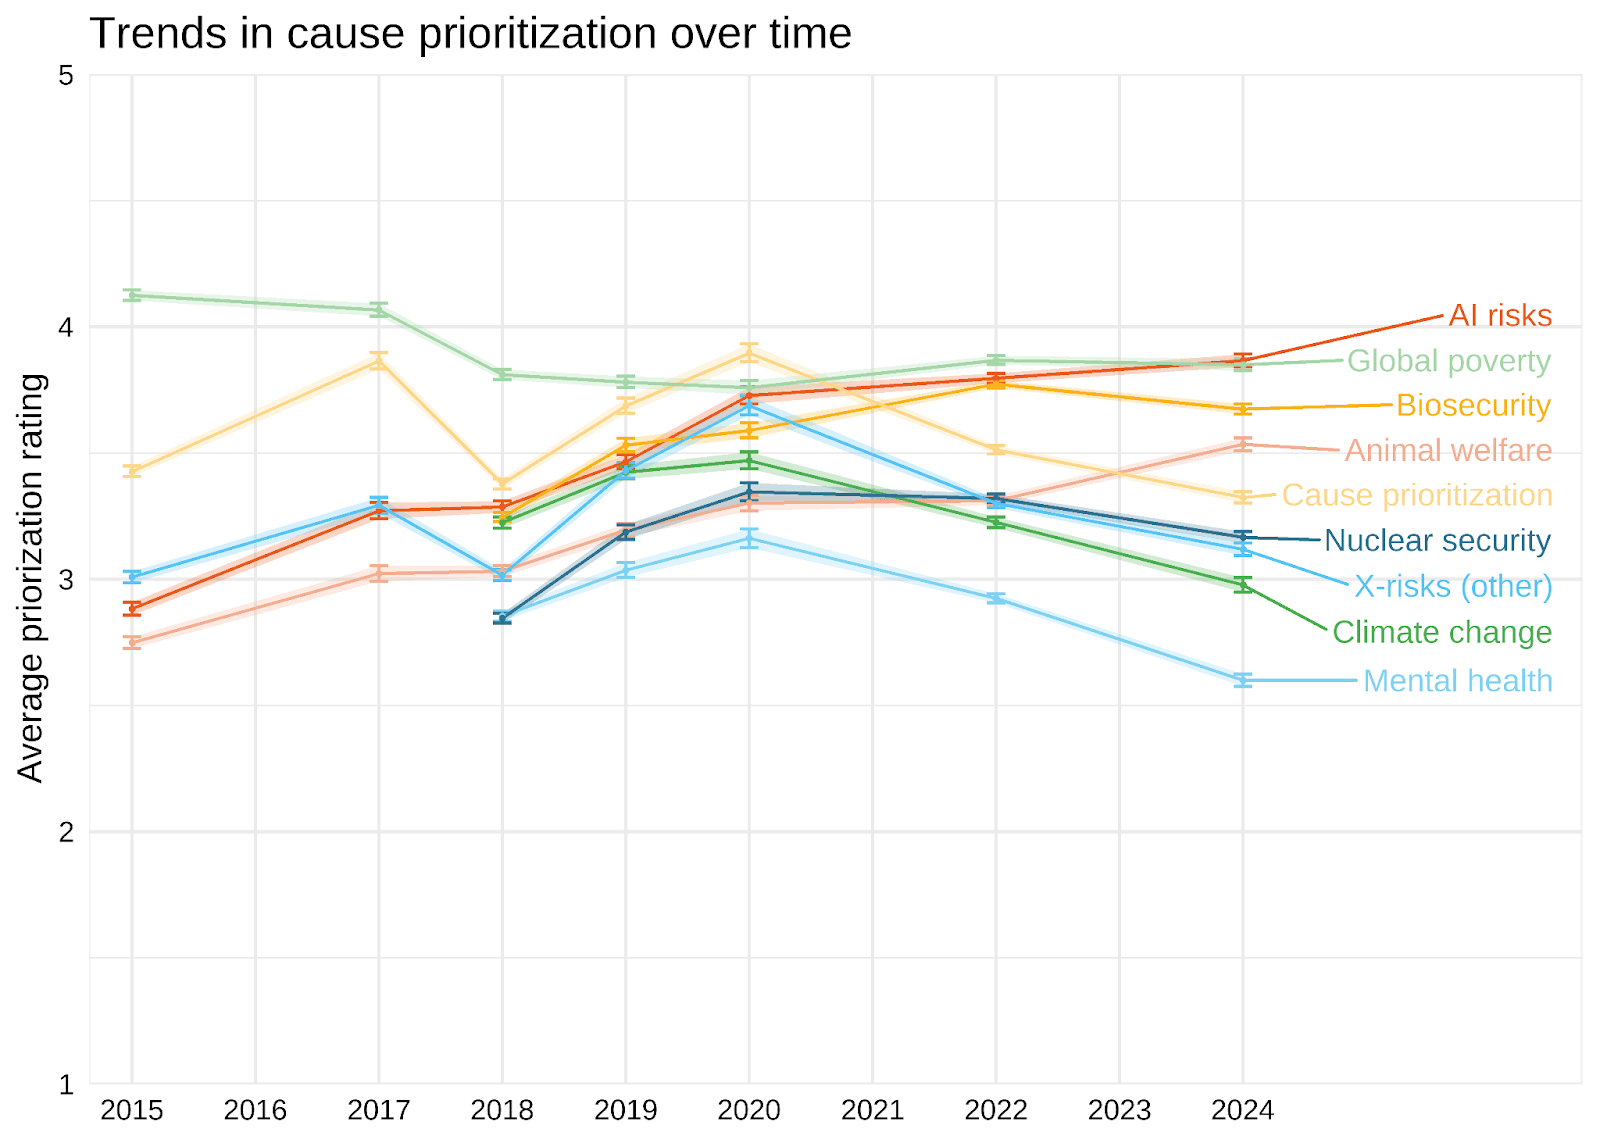
Interestingly, community members' prioritisation of animal welfare appears to have been increasing in recent years. (https://forum.effectivealtruism.org/posts/CKwDgZGLipchAoxtN/ea-survey-2024-cause-prioritization#Trends_in_cause_prioritization_over_time)
This is neither to agree or disagree with the observation about representation of animal welfare at EA conferences and such.
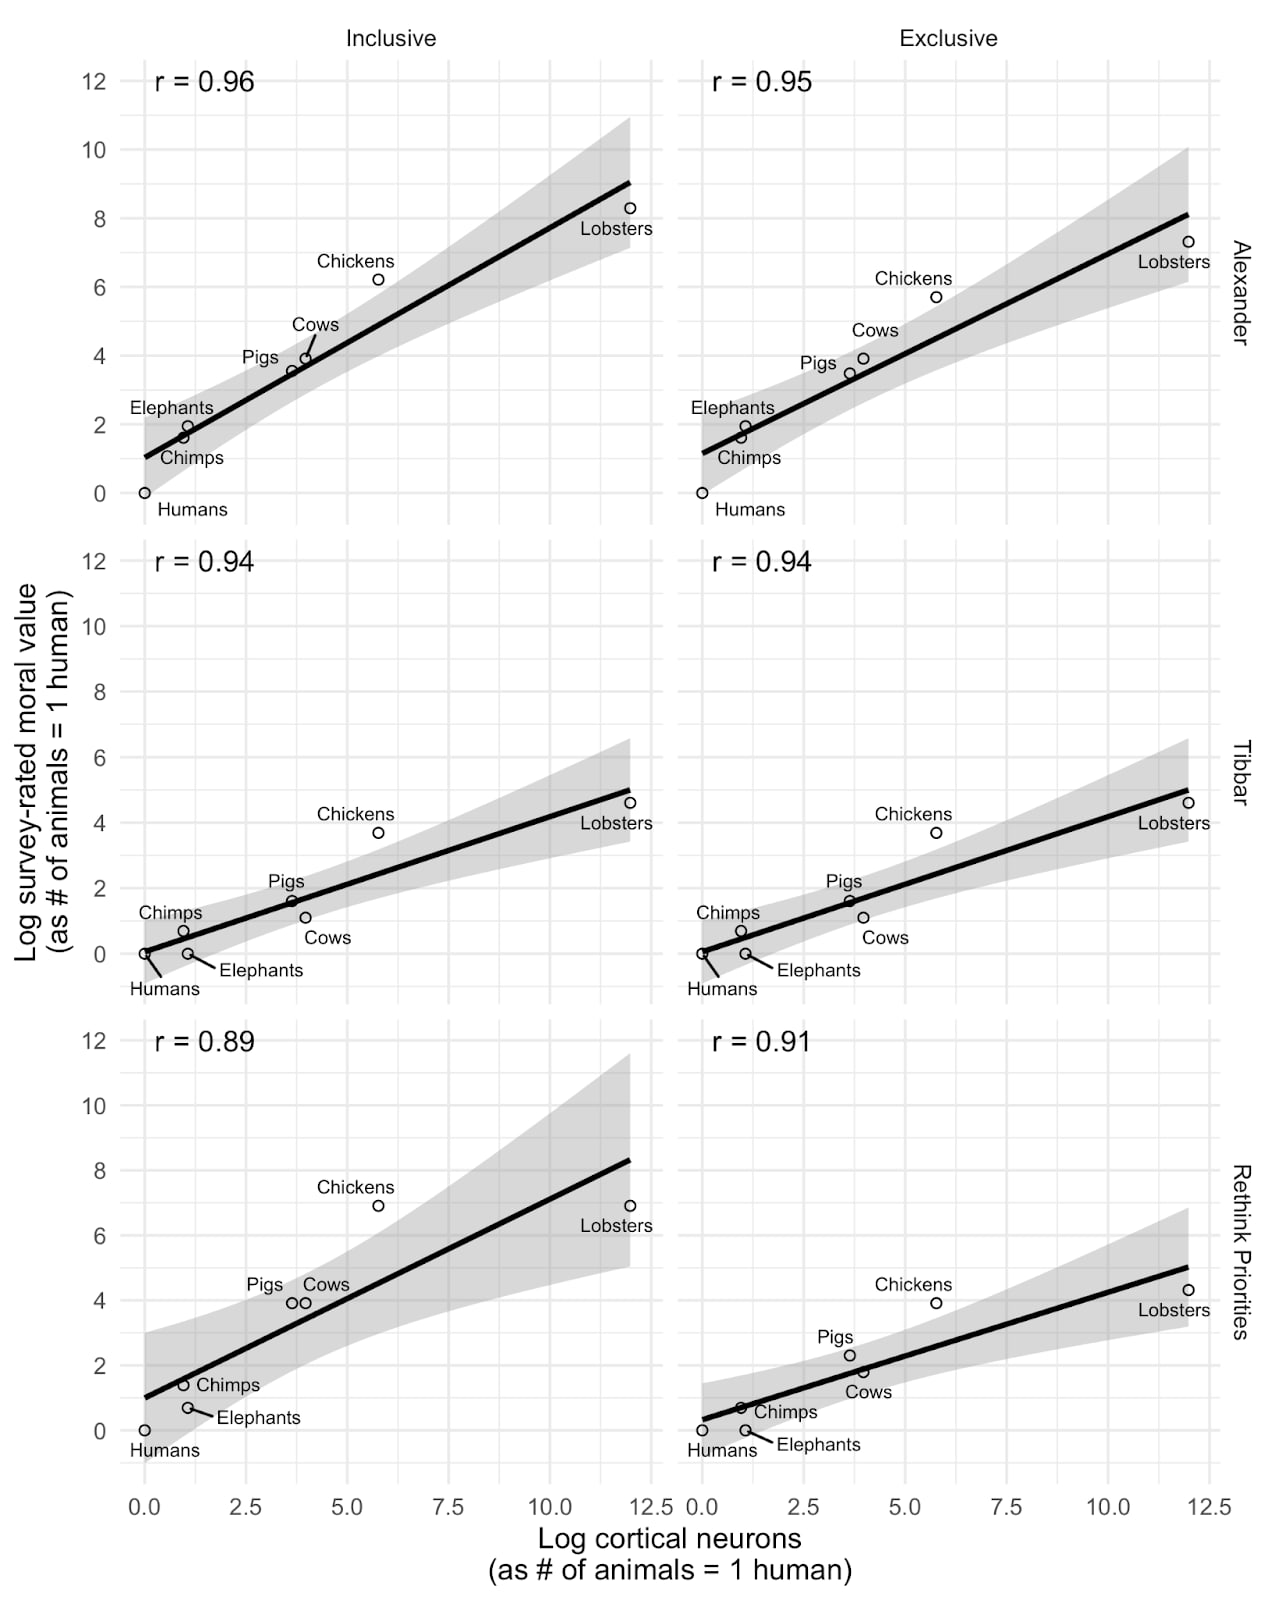
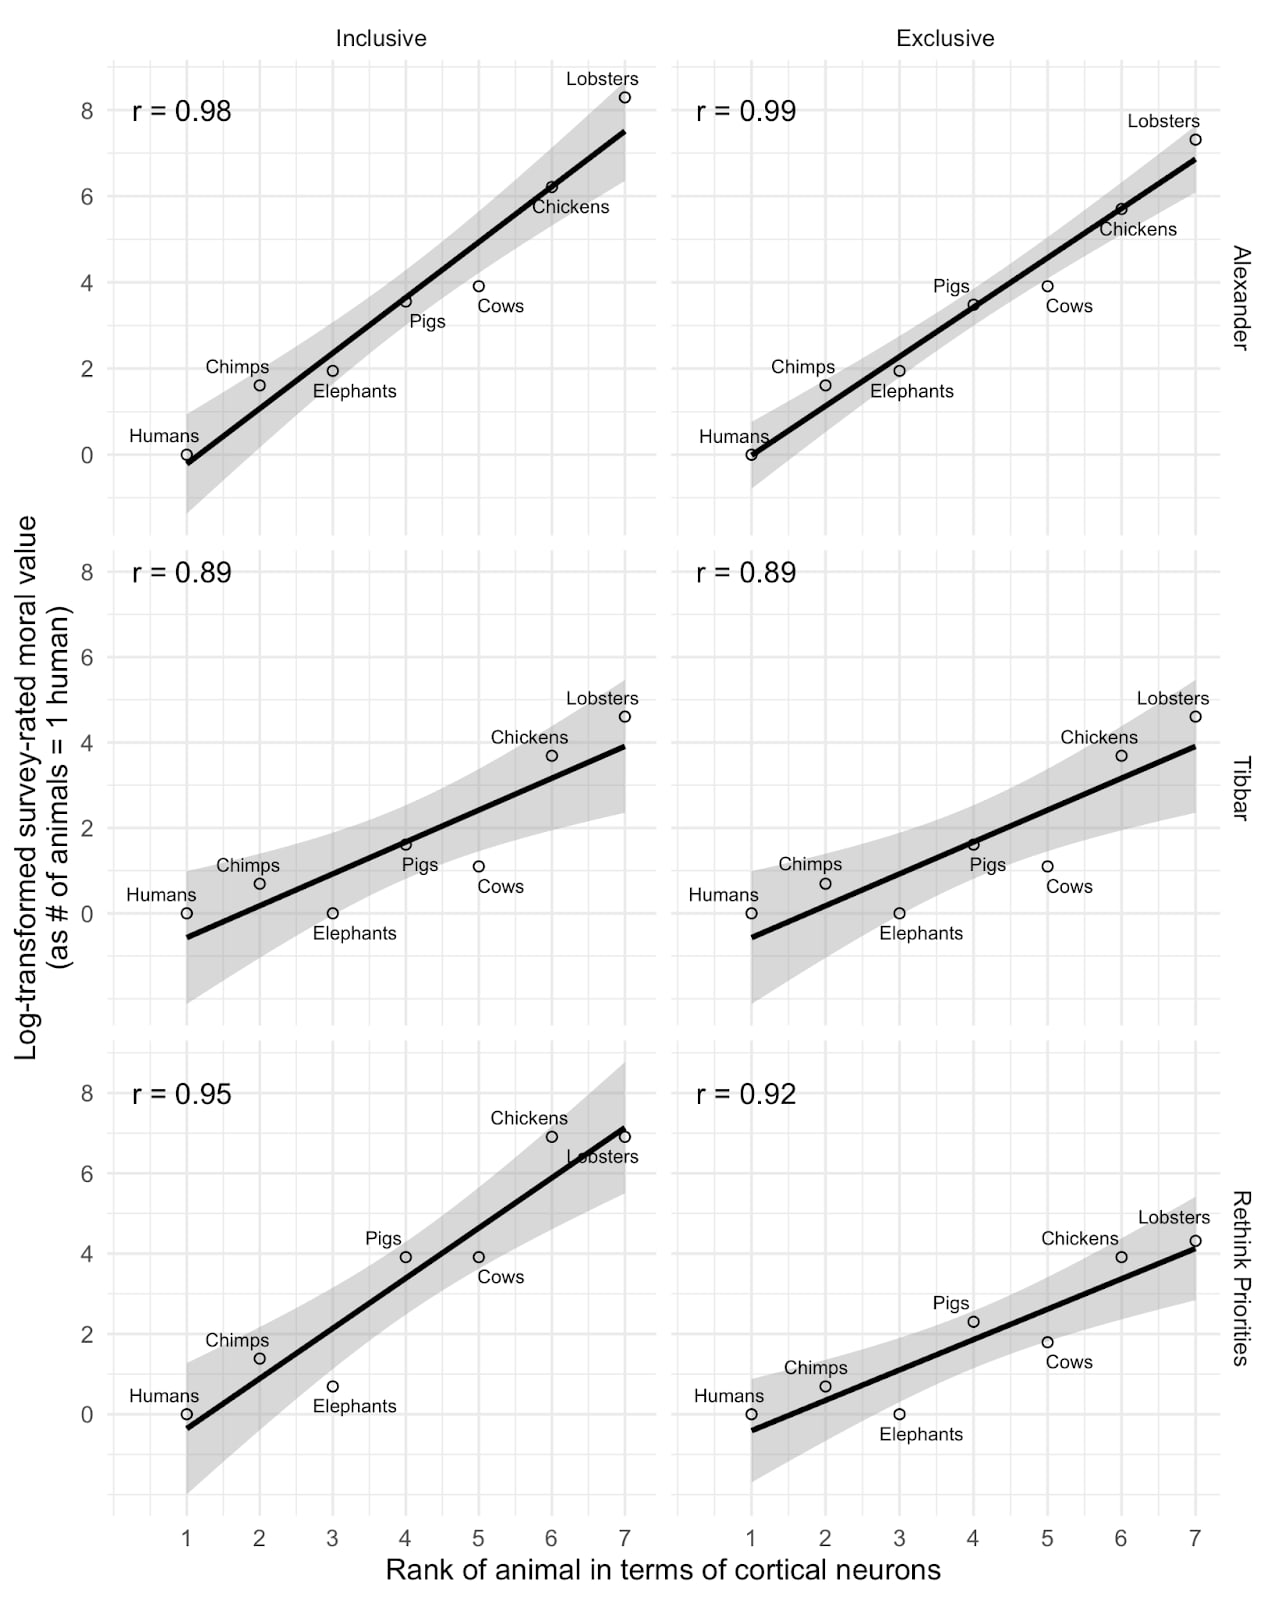
I think this is interesting, but I don't think we should infer too much from this relationship. This plot basically matches those we produced examining the relationship between cortical neuron count and perceived moral value of different animals (replicating SlateStarCodex and another's surveys). As you can see below, we found extremely strong correlations. But we also found similarly strong correlations using EQ or total brain size rather than cortical neuron count, or using a crude 0-100 measure of how people 'care' about the animal in place of tradeoff ratios. Notably, when we replace the moral value measure with a simple ordinal ranking of the animals by neuron count (as in the second plot below), we find even stronger relationships.
My impression is therefore that the strong correlations more reflect the fact that we have a small number of datapoints with animals differing dramatically on a wide variety of predictor (or, in principle, outcome) variables which are all highly correlated, rather than indicating that neuron counts are distinctively predictive of any outcomes of interest. See Andrew Gelman's similar discussion of our study.
I think to actually disentangle these we would need a larger sample of animals who diverge on the key dimensions (e.g., birds with high neuron density but small brains, or animals with higher neuron count but lower perceived similarity to humans).
Thanks Yarrow,
In this report, we don't actually classify any causes as longtermist or otherwise. We discuss this in footnote 3.
In this survey, as well as asking respondents about individual causes, we asked them how they would allocate resources across "Longtermist (including global catastrophic risks)", "Near-term (human-focused)" and "Near-term (animal focused)". We also asked a separate question in the 'ideas' section about their agreement with the statement "The impact of our actions on the very long-term future is the most important consideration when it comes to doing good."
This is in contrast to previous years, where we conducted Exploratory Factor Analysis / Exploratory Graph Analysis of the individual causes, and computed scores corresponding to the "longtermist" (Biosecurity, Nuclear risk, AI risk, X-risk other and Other longtermist) and "neartermist" (Mental health, Global poverty and Neartermist other) groupings we identified. As we discussed in those previous years (e.g. here and here), the terms "longtermist" and "neartermist", as just a matter of simplicity/convenience, matching the common EA understanding of those terms, but people might favour those causes for reasons other than longtermism / neartermism per se, e.g. decision-theoretic or epistemic differences.
Substantively, one might wonder: "Are people who support AI or other global catastrophic risk work, allocating more resources to the "Near-term" buckets, rather than to the "Longtermist (including global catastrophic risks)" bucket, because they think that AI will happen in the near-term and be sufficiently large that it would dominate even if you discount longterm effects?" This is a reasonable question. But as we show in the appendix, higher ratings of AI Safety are associated with significantly higher allocations (almost twice as large) to the "Longtermist" bucket, and lower allocations to the Near-term buckets. And, as we see in the Ideas and Cause Prioritizations section, endorsing the explicit "long-term future" item, is strongly positively associated with higher prioritization of AI Safety.
Perhaps they mentioned this elsewhere, but it could have added to their defence of this kind of question to note that 'third-person' questions like this are often asked to ameliorate social desirability and incentivise truth-telling, e.g. here or as in the bayesian truth serum. Of course, that's a separate question to whether this specific question was worded in the best way.
That's a good question. Although it somewhat depends on your purposes, there are multiple reasons why you might want to measure both separately.
Note that often affect is measured at the level of individual experiences or events, not just an overall balance. And there is evidence suggesting that negative and positive affect contribute differently to reported life satifaction. For example, germane to your earlier question, this study finds that "positive affect had strong effects on life satisfaction across the groups, whereas negative affect had weak or nonsignificant effects."
You might also be interested in measuring negative and positive affect for other reasons. For example, you might just normatively care about negative states more than symmetrical positive states, or you might have concerns about the symmetry of the measures.
We have some data on public support for WAW interventions of different kinds from our recent Attitudes Towards Wild Animal Welfare Scale paper. The academic paper itself does not highlight the results that would be most interesting to EAs in this context, so I'll reproduce them below, and also link to this more accessible summary on the Faunalytics website. (credit to @Willem Sleegers who was the first author of both).
We asked respondents about their level of support for different specific interventions. All the interventions tested had a plurality of support except for genetically modifying wild animals.[2] Helping wild animals in natural disasters, vaccinating and healing sick wild animals, and supplying food, water and shelter, all had large majorities in support. Note that the survey sample was not weighted to be representative (as the goal of the studies was to validate the measures not to assess public opinion), but I would not expect this to change the basic pattern of the results.
| Oppose | Neither | Support | |
| Helping wild animals in fires and natural disasters | 0.8% | 3.7% | 95.5% |
| Vaccinating and healing sick wild animals | 6.7% | 10.5% | 82.7% |
| Providing for the basic needs of wild animals (e.g., supplying food and water, creating shelters) | 9.5% | 11.5% | 79.1% |
| Conducting research into how to alter nature to improve the lives of wild animals | 26.5% | 19.1% | 54.3% |
| Controlling the fertility of wild animals to manage their population size | 33.9% | 23.8% | 42.3% |
| Genetically modifying wild animals to improve their welfare or the welfare of other wild animals | 70.3% | 16.2% | 13.5% |
Of course, some might claim that the popular interventions are not characteristic of WAW or are too small scale (though I do not think this is true of vaccinations). But I think it is notable than even research into "how to alter nature" has majority support, and fertility control has plurality support.
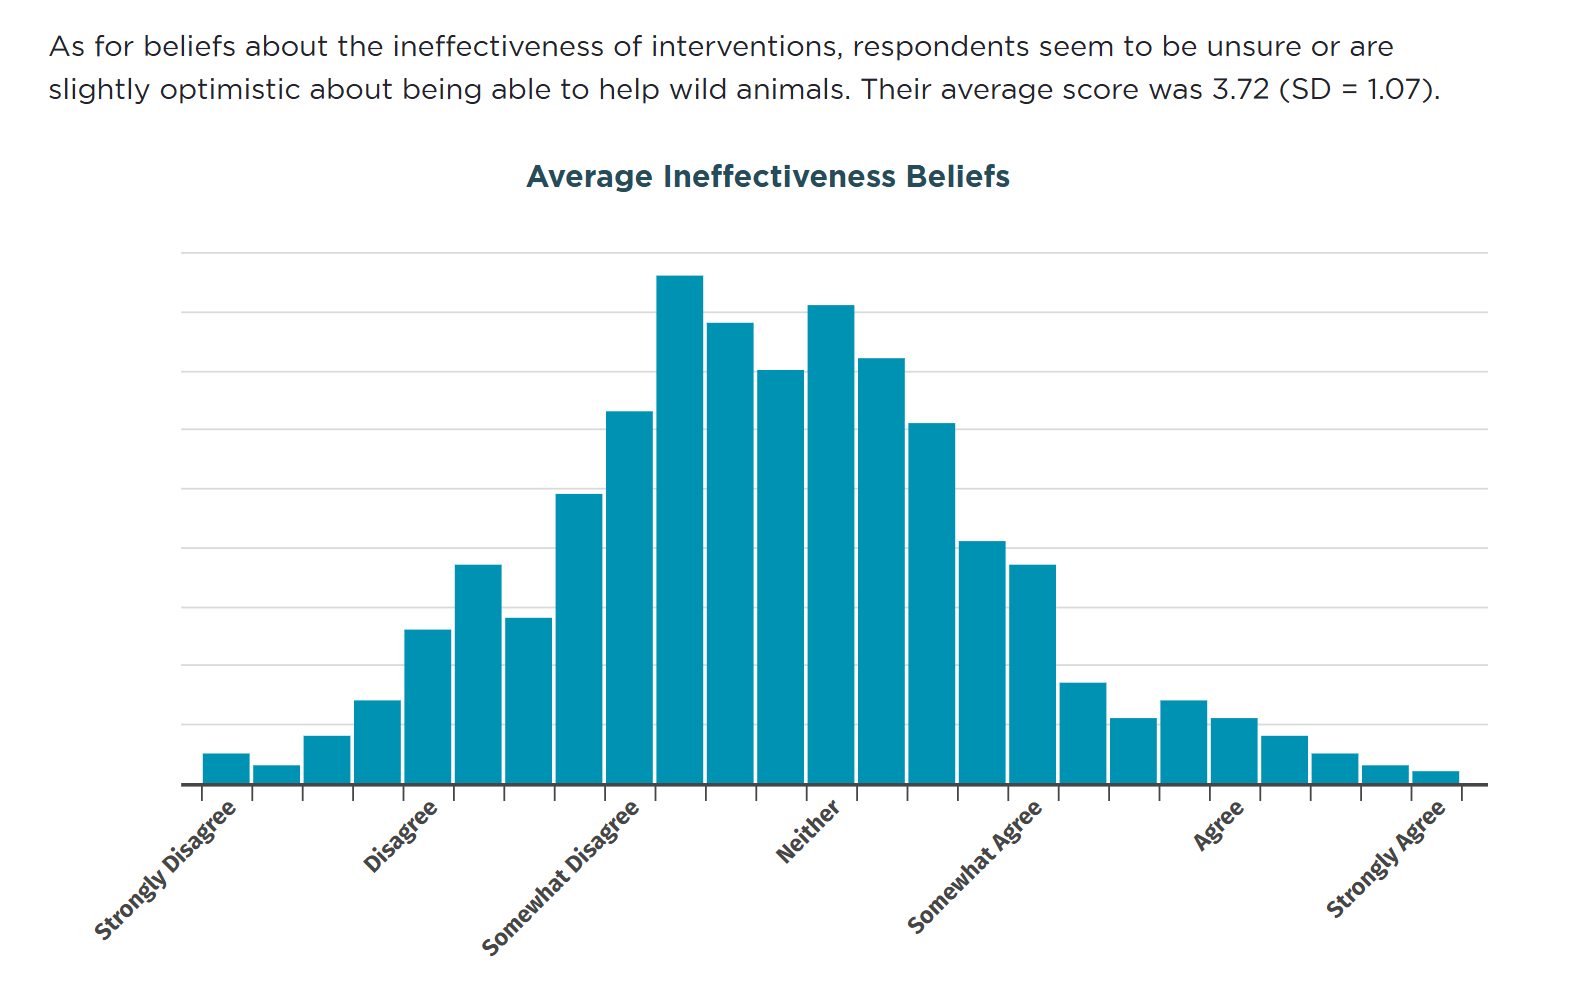
We also asked, more abstractly, about whether people endorse the attitudes that intervening to help wild animals is infeasible (what we call 'intervention ineffectiveness), with these items:
- Ecosystems are too complex to predict the outcomes of efforts aimed at improving the lives of wild animals.
- Nothing much can be done to reduce the hardships that affect animals living in the wild.
- It is not possible to reliably improve the lives of wild animals.
- It is not possible to solve the problems that wild animals face in nature.
With the caveat that this measure was not designed for polling absolute levels of public support, but rather than reliably capturing a specific underlying attitude, on average respondents did not strongly endorse this attitudes, and slightly leaned towards disagreement.
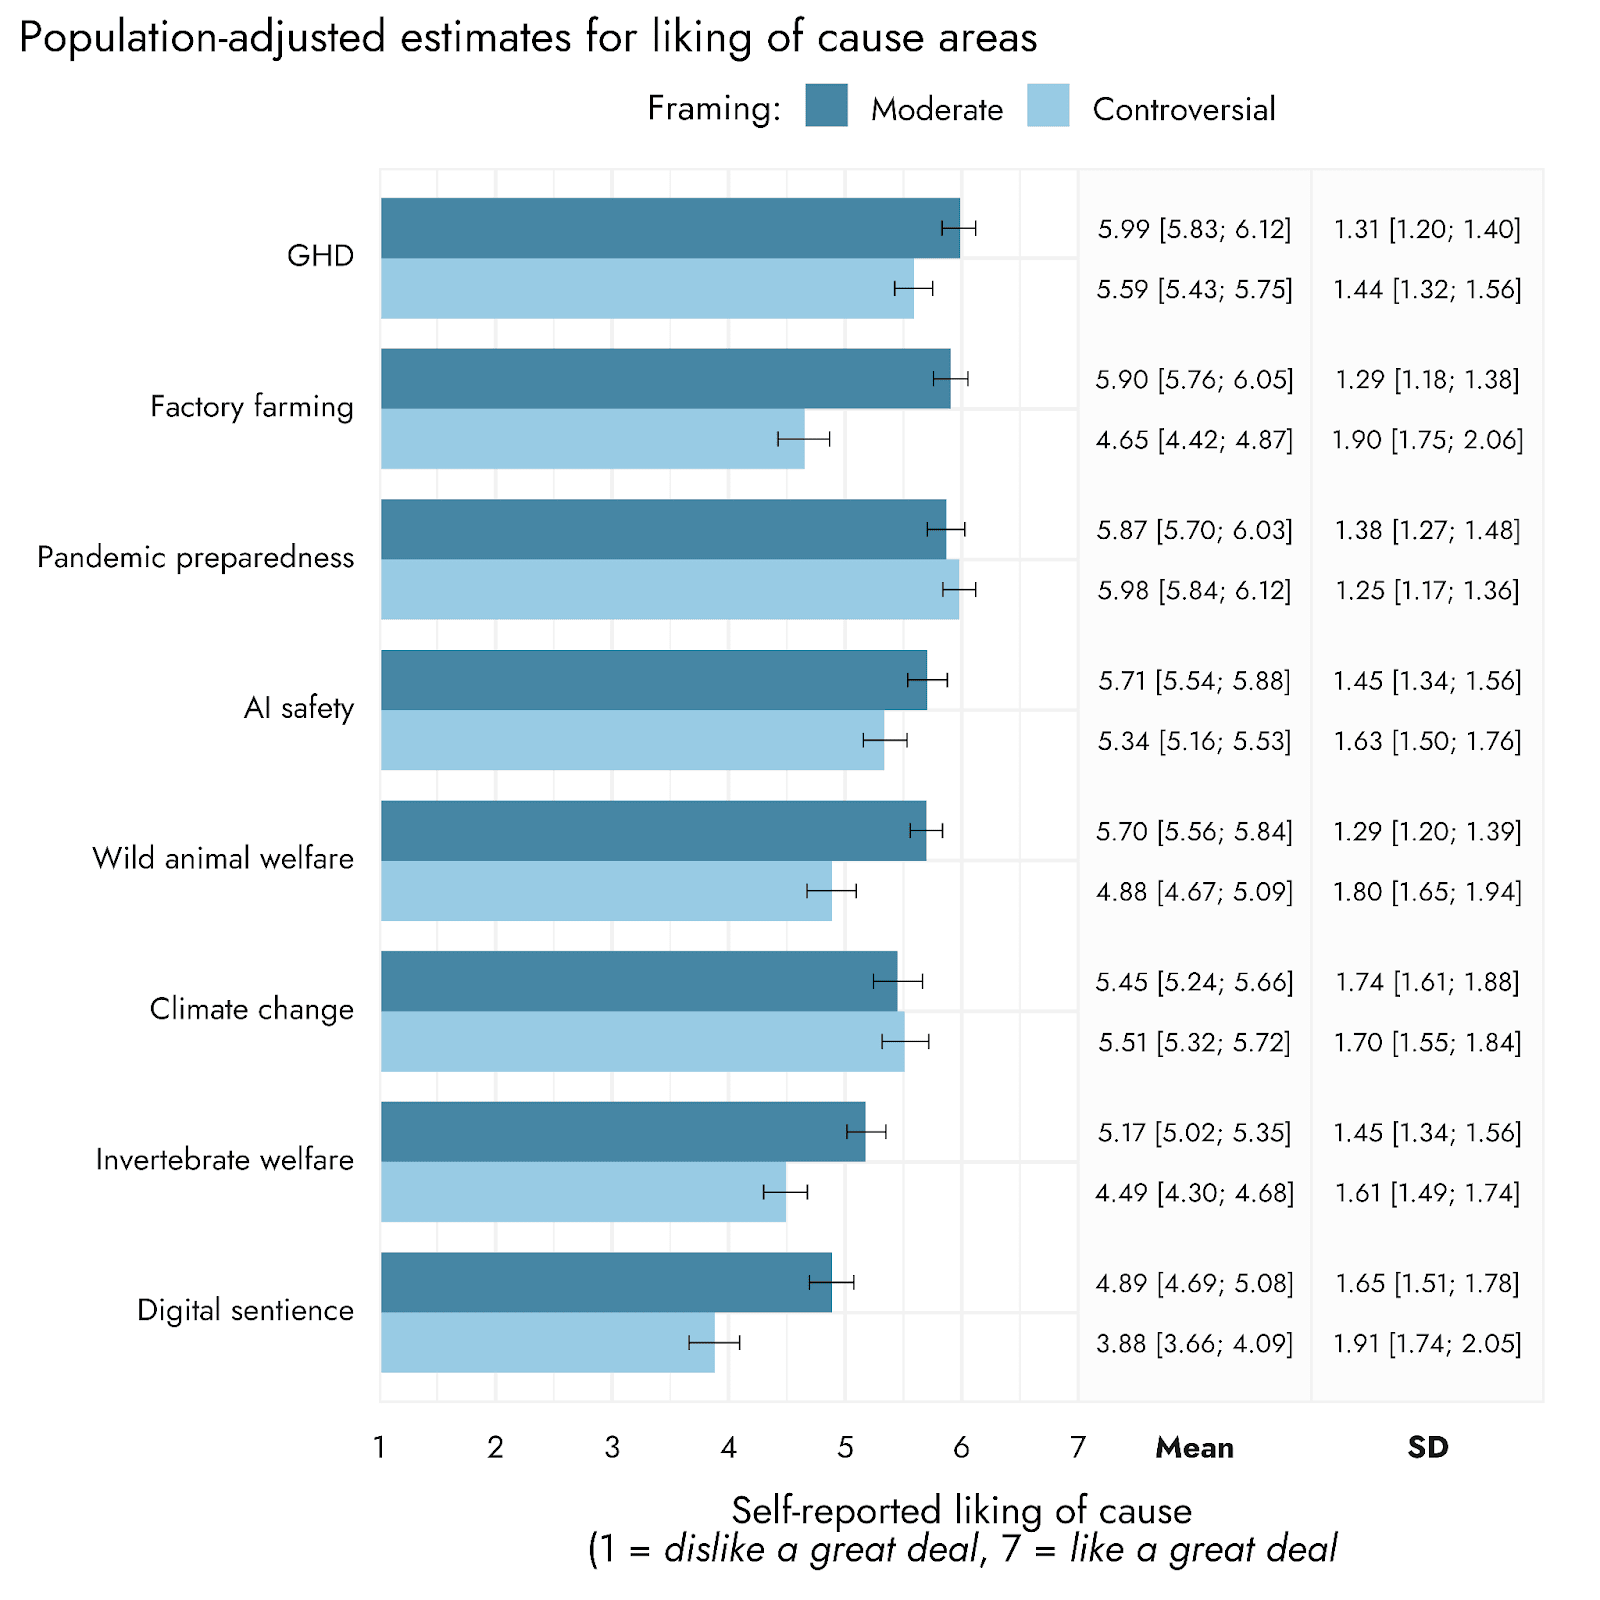
Stepping back, I would not take a very strong stance on the FAW vs WAW normality/popularity question. I think this is very likely to vary at the level of individual intervention, or depend on framing when presented abstractly. As an example of the latter point, when we presented FAW and WAW as abstract cause areas, each with a 'moderate' and 'controversial' framing, WAW was competitive with a moderate framing (non-significantly ahead of Climate Change as well), while it lagged when presented with a framing that mentioned genetic engineering. We'd be happy to gather further evidence to examine a wider variety of framings or interventions.
- ^
Though this was a secondary aspect of the paper. The core aim of the paper was to develop and validate a new set of measures towards wild animal welfare, and these questions about support for different interventions were intended only to validate those measures.
- ^
Which is, perhaps, not surprising, many people oppose GM tout court.
It seems like life satisfaction (a cognitive evaluation) and affect are simply different things, even if they are related, and have different correlates. It doesn't strike me as that intuitively surprising that people would often evaluate their lives positively even if they experience a lot of negative affective states, in part because people care a lot about things other than their hedonic state (EAs/hedonic utilitarians may be slightly ununusual in this respect), and partly due to various biases (e.g. self-protective and self-presentation biases) that might inclined people towards positive reports.
Thanks gergo!
A small number of small orgs do meet the bar, though! AIS Cape town, EA Philippines, EA & AIS Hungary (probably at least some others) has been funded consistently for years. The bar is really high though for these groups, and I guess funders don't see enough good opportunities to support to justify investing more resources into them through external services. (Maybe this is what you meant anyway but I wasn't sure)
My claim is actually slightly different (though much closer to your second claim than your first). It's definitely not that no small groups are funded (obviously untrue), but that funders are often not interested in funding work on the strength of it supporting smaller groups, where "smaller" includes the majority of orgs.
The highest counterfactual impact comes from working with organisations that could benefit but haven’t budgeted for marketing due to a lack of understanding.
As JS from Good Impressions told us:
“Willingness to pay is not as strong a predictor of commitment or perceived value as I thought it would be.”This creates a chicken-and-egg problem: funders expect clients to pay, but clients lack the means.
This matches our own experience (with the Rethink Priorities, Surveys and Data Analysis team).
I would add that, in our experience, the situation is worse than the chicken-and-egg problem as stated. As you note, funders are often not interested in funding work which is supporting smaller, more peripheral or less established groups (and to be clear, this seems to be a matter of 'most orgs don't meet the bar' rather than 'all but a few smaller groups do meet the bar').
But we have also been told by more than one funder that if our work is supporting core, well-resourced orgs, then those orgs ought to fund it themselves, and you shouldn't need central funding.[1] This creates a real catch-22 situation, where projects of this kind can neither be funded if they are supporting the biggest orgs or if they're not.
I also find that people often significantly overestimate the ability to pay of even the largest orgs to pay. We often find that orgs are willing to invest tens of staff hours in working with us on a project- implying they value it- but they still have hard limits of whether they can spend $500-1000 on costs for the project.[2]
- ^
I've not directly experienced this response recently, as we've not been applying for funding on this sort of basis, so YMMV.
- ^
Perhaps explained by (i) even well-resourced orgs don't have large amounts of unrestricted funds that they can spend on whatever unforeseen expenses they want (ii) internal approvals for funding being difficult, (iii) needing/wanting to stick to some, pretty low, sense of what reasonable costs for advertising/experiments are.

Thank you Vasco.
I agree this is an important and interesting topic. I will look into the prior studies to assess what I think would be needed to shed light on the above (e.g. required sample size, required measures) and get back to you.