Comments
Thank you!
Does anyone know how this compares to other EA sites, forums in general and to the EA growth rate?
How well is this forum doing as a main internet hub of the EA community?
Thank you!
Does anyone know how this compares to other EA sites, forums in general and to the EA growth rate?
How well is this forum doing as a main internet hub of the EA community?
Cool! Just in case you have the data quickly at hand, I’d‘ve been interested in more than just the top three articles, maybe you could add the top ten? Also, maybe minutes would be the more intuitive unit, compared to something like 2600 seconds.
On behalf of CEA, SEADS (Sharing EA Data Science) analysed view metrics of the EA Forum for the 14-month period from February 2020 to March 2021. We focused on two metrics:
SEADS — Sharing EA Data Science[2] — is an output-oriented project group. We aim to study questions relevant to EA and publish the results of our findings on the EA Forum. Our expertise lies in data analysis and data science.
We have been collaborating with CEA since around March 2020. Our first project with CEA focused on EAG survey data analysis (see our post on that). In this post, we discuss our analysis of view metrics of the EA Forum over a 14-month period spanning February 2020 through March 2021.
The EA Forum is the central knowledge-exchange platform of the EA community. Therefore, metrics on its usage are potentially of interest to both CEA and the community as a whole.
CEA provided the following question to guide our analysis of the EA Forum:
Given the metrics view count and view time, what information do we gain by aggregating them in the following ways: overall, by post, by author, and by tag?
CEA collects anonymised user data on view count and view time for each EA Forum post. We analysed these two metrics over a single 14-month time period. All findings on the metrics are therefore limited to this period; we cannot determine whether they are representative of other time periods.
Figure 1 shows the growth of the view metrics’ view count and view seconds over the analysed time period. Both metrics roughly doubled. When modeled linearly (see the red lines in Figure 1), the increase per day was about 3 views and 8 view minutes. By March 2021, the EA Forum registered ~2500 post views and ~100 post view hours per day.[3] Remember: this linear increase is specific only to the timeframe we analysed.
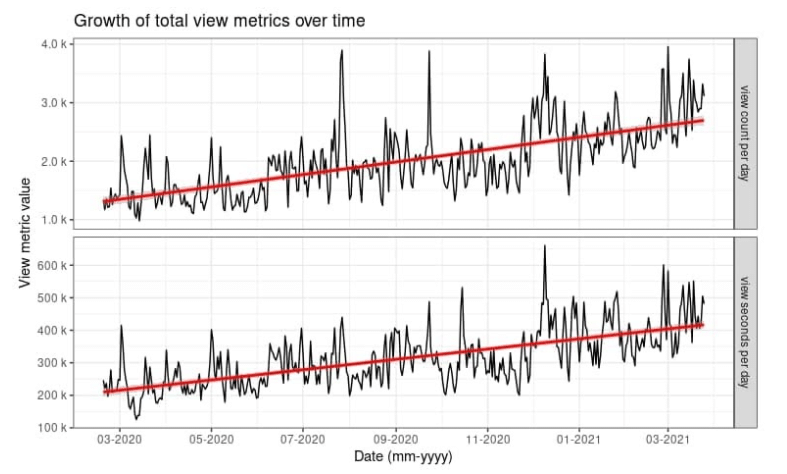
Figure 1: view count per day (upper) and view seconds per day (lower) plotted against view date. The plot of each view metric is overlaid with a linear fitting function (red).
The distribution of post view times per user per day was heavily skewed towards short view times. Very few views were for extended periods, with the median post view time equal to 60 seconds.
The all-time total number of EA Forum posts at the end of March 2021 was 14643. Of those, 6159 posts were viewed over the analysed time period. As with the post view times, the view count per post was heavily skewed — most posts had low counts, with the median at 28 views and with few posts showing high counts. The same distribution holds true for total view time per post (adding up all views ever), with the median at 1900 seconds.
In terms of view share, the top 5% of posts accounted for around half of the view metrics:
The top three posts for the period by view count were:
The top three posts for the period by total view seconds were:
The all-time number of authors[4] by the end of March 2021 stood at 3645. Of these, 1447 had views on one or more of their posts. The number of posts per author viewed in this period ranged from 1 to 398, with the median at 1. In other words, more than half of all authors published only one post.
Once again, the view metrics per author showed heavily skewed distributions: most authors’ posts had low averages, and just a few had high averages. The average total view time per post ranged from 10 to ~1.1 million seconds, with a median of 2620 seconds. The average number of views per post ranged from 1 to ~5800, with a median of 34 views.
233 different tags were assigned to the posts published over the analysed period.[5] The most-used tag was used 1061 times, with the median at 15 posts per tag. These are the top three tags which were assigned to posts:
Again, the view counts per tag were heavily skewed; most tags had low average views and few had high ones. The median was 269. The median post view time per tag was 700 minutes.
Figure 2 shows the top ten tags by average view count (left) and by average view time (right). The top four tags were the same for both metrics, albeit in differing order: “Totalitarianism” (which had the highest view count), “Persistence of political cultural variables” (which had the highest view time), “bounded rationality”, and “memetics”. All tags were included, even those with only one post.
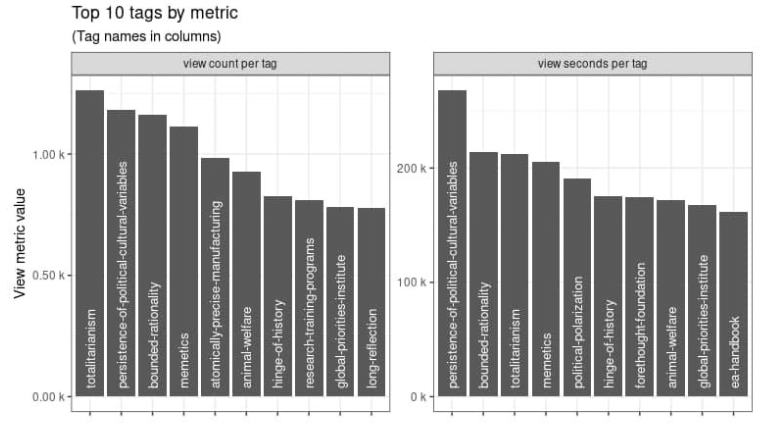
Figure 2: top ten tags by average view count (left) and by average view seconds (right). By average view count, the tag “totalitarianism” ranked highest and by average view time the tag “persistence of political cultural variables” came first.
Our analysis of the two EA Forum view metrics view count and view time over a 14-month time period shows that both metrics roughly doubled, to about 2500 views and 100 view hours per day. Each of the views by post, author, and tag were heavily skewed towards very low numbers. The top 5% of posts accounted for about half of the views and view time.
Special case: If a user with the same browser tag accesses the same post several times a day, then this time is added up. So we measured “view time per post per user per day”. ↩︎
We replaced “Swiss” with “Sharing” in anticipation of future collaborators, and to be more inclusive. ↩︎
By only including views/hours for post viewing, we excluded all views/hours on pages like the homepage, the “All Posts” page, and tag pages. ↩︎
People who published at least one post. ↩︎
Note that this was before the Editing Festival, when there were many fewer tags than there are now. ↩︎

"The top 5% of posts accounted for about half of the views and view time."
Looks like the EA forum, just like the overall project of effective altruism itself, is a hits-based business!
Does anyone know what other forums and media are like in this regard? One guess is that the distribution of views on major media sites is not as lopsided.
I recall Kelsey Piper mentioning that there was significant variation in the popularity of Future Perfect articles. It would be interesting to see how it compares to the EA Forum in this respect.