Performed by: Geologist Gabriel Rafael Rosario Bolivar.
This project was conducted as part of the "Careers with Impact" program during the 14-week mentoring phase. You can find more information about the program in this post.
1. Contextualization of the problem
This project addresses a relevant problem today where artificial intelligence dominates the global scene, the geographic and corporate concentration of computing infrastructure, in this case for the U.S., which determines access to critical resources such as advanced GPUs and energy. Previous studies such as the Public Cloud Region Census 2023 mapped data center locations, in contrast, this research delves into aspects such as energy efficiency (via PUE) and a wider variety of hardware models, revealing patterns such as infrastructure being concentrated in the Western and Southern U.S. with nearly 80% of the areas studied and U.S. companies dominating cutting-edge technology, while Chinese players face barriers. These differences raise questions about how computational power could be redistributed, avoiding technological deserts and geopolitical vulnerabilities.
The main objective of the study is to analyze how the physical distribution of data centers affects the governance of computation, which is crucial because, unlike traditional data- or algorithm-centric approaches, this framework prioritizes control over tangible resources that drive the Artificial Intelligence (AI), by offering
more effective information to ensure decision making based on equity, national security and energy transition.
The importance of the project lies in its practical conclusions: first, that energy efficiency is sufficient, but strict regulations and alternatives are still needed to reduce dependence on fossil fuels in the energy matrix. Second, that the concentration of infrastructure in a few corporations and regions creates systemic risks, from technological monopolies to fragility in the face of disasters. These results bring three main contributions to the field:
● A public and easily accessible database with metrics such as PUE and GPU types, useful for geopolitical and environmental analysis.
● Evidence that economic factors (operating costs) outweigh political ideologies in the location of data centers, demystifying simplistic narratives.
● A call for transparency and mandatory standards to balance innovation with planetary boundaries.
By linking physical infrastructure with governance, tools are provided for a future where computing, as a strategic resource, is accessible, sustainable and distributed with equity criteria.
2. Research Question.
What is the geographic distribution and ownership of U.S. data center technology resources and how do these affect computing governance, energy efficiency, and equity in technology access?
3. Objectives
3.1. General
This project seeks to analyze the geographic distribution and ownership of key technology resources (such as GPUs) in U.S. data centers, examining their impact on computational governance, energy efficiency, and equity of access to technology. Through this mapping, patterns of computational power concentration and their impact on AI development will be identified, with the finds of providing critical data and analytical tools to enable decision makers to foster a more transparent, sustainable, and equitable technology ecosystem.
3.2. Particular (Specific) Objectives
● Generate an AI Infrastructure Database: Create a public, up-to date and easily accessible database of data centers in the U.S., including information on GPU usage, location and energy consumption, as a useful tool for decision making in both the public and private sectors.
● Mapping the Geographic Distribution of Data Centers: Analyzing the distribution of data centers of large technology companies such as Alibaba, AWS, Google, Microsoft, and Tencent in the U.S. territory, and how this impacts the concentration of computing power.
● Evaluate the Technology Infrastructure: Examine the types of GPUs (such as H100, A100, V100) available in data centers, in order to understand their computational capability and their role in advancing modern artificial intelligence.
● Identifify the energy efficiency of Data Centers: Study the energy consumption of data centers through metrics such as PUE (Power Usage Effectiveness) to assess the sustainability and energy efficiency of these infrastructures.
● Research Energy and Economic Policies: energy policies, electricity costs, and local regulations that influence the location and operation of data centers, with an emphasis on access to renewable energy sources and economic implications.
● Explore Data Center Ownership and Nationality: Investigate the ownership of data centers, distinguishing between domestic and foreign companies, and analyze how this concentration of computational power impacts the governance of computation.
● Explore Strategic and Governance Implications: Explore how U.S. data center infrastructure affects the country's economic competitiveness, computing governance, and technology policies, with a particular focus on the
risks associated with centralized control of infrastructure and the threat of digital authoritarianism.
3.3 Personal Objectives
● Develop skills in the analysis of geographic data applied to technological infrastructure, specifically to understand how the location of data centers can be related to renewable energy resources (such as solar or geothermal energy) and their environmental impact.
● Strengthen my ability to interpret energy efficiency metrics (such as PUE). This knowledge is key because, as a geologist, I want to contribute to the energy transition by identificating optimal areas to install data with a smaller ecological footprint, taking advantage of natural benefits (climate, local renewable sources) and dependence on fossil fuels.
● My next professional steps include:
1. Apply what has been learned in this project to work in consultancies or companies that integrate renewable energies with technological infrastructure.
2. Specialize in energy transition or GIS (Geographic Information Systems) tools.
3. Collaborate with multidisciplinary teams (engineers, political scientists) to design proposals linking geology, clean energy and technological governance.
● In the long term, he aspired to contribute to projects that position geology as a critical science to solve challenges in the age of the
digital, from themanagement sustainable
management of resources to the territorial
planning of IA infrastructure.
4. Methodology
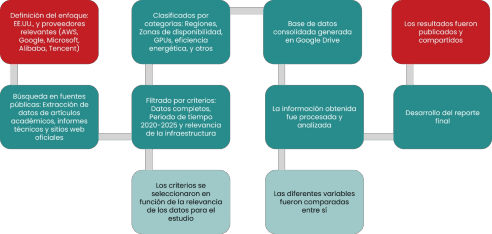
Various public sources and databases were used to collect the data used in this project. present study focused on the US as the object of interest, given its prominence in the number of AI-related data centers. To ensure adequate coverage, sources from relevant vendors in the data center services market such as Alibaba, AWS, Google, Microsoft, and Tencent were tapped, in addition to oficial information from oficial sites.
and technical documents. Search terms included following keywords:
● "Data Center" OR "Cloud Infrastructure".
● "Data Center Space" OR "Power Usage Effectiveness" OR "Energy Consumption" OR "Availability Zones" OR "GPU".
These terms were used to identificate and extract data from academic articles, technical reports, oficial vendor websites, and other relevant documents. Documents without access to complete or verificable data were excluded, as well as those that did not provide relevant information on infrastructure parameters or were outside the defined time frame (2020-2025).
After the initial search was conducted, relevant information was collected and filtered from vendor websites and technical documents. The data was classified according to data center infrastructure categories, such as regions, availability zones, GPU types, and energy efficiency measures, and then added to the study's compilation database.
5. Results and Discussion
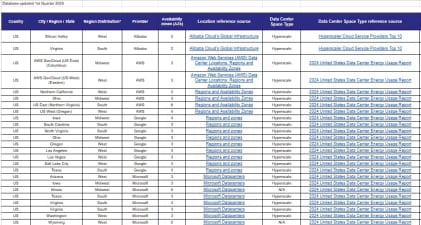
5.1 Database
The Database resulting from this project (Figure 2) significantly outperforms the one used as a reference, Public cloud region census 2023 database by Lehdonvirta V., Wu B. and Hawkins Z., in technical detail and analytical utility. While the benchmark by Lehdonvirta V., Wu
B. and Hawkins Z. is limited to data such as zone availability (AZ) and presence of only some GPU models (H100s, A100s), our database integrates advanced metrics such as PUE (Power Usage Effectiveness), energy consumption (MW and TWh), infrastructure typology (hyperscale) and verificable sources of information. For example, our baseline not only confirms that AWS in Ohio has GPUs (H100, A100), but also reveals their high energy efficiency (PUE
1.12) and consumption (74 TWh), critical data for assessing sustainability and efficiency, which are absent in the reference census.
The innovation of this database lies in its capacity for multidimensional analysis. It includes unique variables such as nationality of owners (key for geopolitical studies) and specific models of GPUs (L40s, T4s). In addition, our methodology prioritizes transparency, citing direct sources (e.g., Alibaba Progresses Towards Carbon Neutrality Goals and Digital Inclusion 2024 ESG Report). These attributes position our foundation as a useful tool for technical and strategic decisions in cloud infrastructure, especially in scenarios where power, location and hardware capabilities are critical.
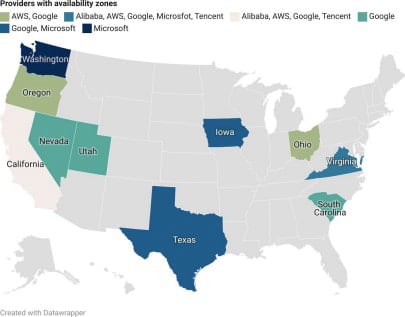
5.2 Geographical Distribution and Nationality of Owners
The results reveal that the cloud service providers evaluated exhibit predominant geographic coverage in three of the four key U.S. regions: the West, South and Midwest (Figure 3). With the following proportion: the West (42%), with hubs such as Silicon
Valley and Los Angeles; the South (37%), with Virginia and Texas dominating that region; and the Midwest (21%), with strategic centers in Ohio and Iowa. In contrast, the non-presence in the Northeast (e.g., New York or Boston) could be attributed to high operating expenses (Stripe, 2024), despite its financial and technological relevance; further research would be required to unveil the reasons more precisely.
This distribution responds to critical factors such as connectivity infrastructure, both California and Northern Virginia have a large number of the global traffic thanks to submarine cables (Submarine Cable Map) and enterprise demand, driven by providers such as AWS, Google and Microsoft respectively.
The geographic distribution of the data centers of the main technology companies analyzed reflects a differentiated pattern.
On the one hand, US companies (AWS, Google and Microsoft) show a wider and more diversified presence in US territory, covering three of the four main regions: the West, the Midwest and the South, with infrastructures distributed in multiple states. This distribution of US companies could be associated with their historical dominance in the local market (Haranas, 2025), their capacity for innovation and the need to ensure low latency and redundancy to meet the demands of a massive domestic market.
In contrast, Chinese companies (Alibaba and Tencent) present a more limited distribution, concentrating their data centers only in the Western and Southern regions of the U.S., specifically in California and Virginia. This selective geographic strategy would respond to a gradual entry approach to the US market, prioritizing areas with high technological demand and consolidated infrastructure.
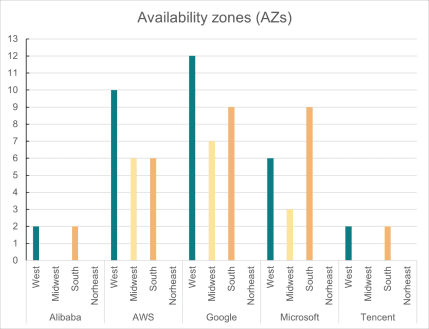
5.3 GPU availability
| Supplier | GPU Models Available |
| Alibaba | V100, P100, T4 |
| AWS | H200, H100, A100, V100, V100, L40, A10, L4, T4 |
| H100, A100, V100, P100, P100, L4, T4, P4 | |
| Microsoft | H100, A100, V100, V100, A10 and T4 |
| Tencent | V100, P40, T4 |
Table 1. GPU models available per vendor, considering their presence in at least one of the availability zone locations (AZs). It shows that AWS leads in GPU diversity, with advanced models (H200, H100) and versatile options (A100, V100, L4, etc.). Google and Microsoft follow, offering H100, A100 and V100, although Google has more variety (P100, P4) and Microsoft A10 and T4. Alibaba and Tencent have a selection limited to older models (V100, T4, P40), with no modern GPUs.
As evidenced in Table 1, the disparity in GPU availability among vendors reflects clearly differentiated technology strategies. The information gathered shows that AWS not only offers the widest range of models (including the modern H200, H100 and A100), but also surpasses other vendors in number of options, consolidating its position as a leader in edge computing capability. Google, on the other hand, appears as a
direct competitor with its H100 and A100 portfolio, complemented by more affordable models such as L4 and T4, suggesting a balanced strategy between high performance and versatility.
As shown in Table 1, Microsoft competes in the field modern GPUs (H100, A100) and its availability of models is completed by the following: V100, A10 and T4. In contrast, Alibaba and Tencent, whose options are mainly limited to V100, T4 and P40 (models with several years on the market1), lag behind in the race to offer state-of-the-art hardware, this may coincide with the restrictions on exporting advanced chips to China (Allen, 2022).
5.4 Energy Efficiency
Data centers measure their energy eficiency by means of a metric called Power Usage Effectiveness (hereafter PUE), which is a way of measuring the eficiency of data center operations. PUE is expressed by a formula, which is calculated as follows:
PUE = Total facility energy ÷ IT equipment energy
A PUE value of 1.0 would represent a perfectly efficient data center (AWS, n.d.), in which all energy entering the building reaches the information technology (IT) equipment.
1 Each GPU model was consulted separately on the NVIDIA website.
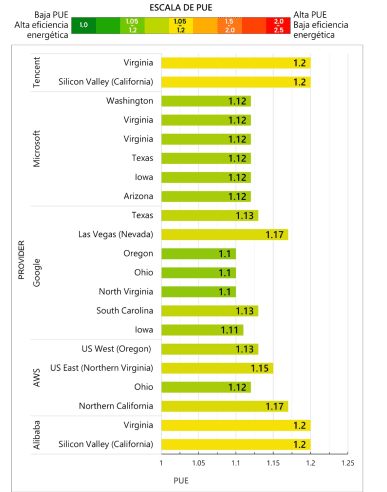
With respect to the PUE of the data centers studied, the data presented in Figure 5 shows interesting patterns in the energy efficiency of the data centers of the major providers of services at the cloud. A finding key is the
variability in PUE values between different companies, although these differences do not show a directly clear correlation with the climatic conditions of each location2. This suggests that suppliers have implemented effective strategies to mitigate environmental impact, managing to maintain eficiency standards regardless of the geographic setting.
Google stands out as the provider with the lowest PUE values (1.1 in several locations), demonstrating clear leadership in energy optimization. However, significant variations are observed even within its own infrastructure, as in the case of Las Vegas (1.17) versus Oregon (1.1). These results, visible in Figure 5, raise the idea that factors such as the age of the data centers and the specific technologies implemented could have greater influence than the local climate.
Microsoft presents a particular case by presenting an average PUE of 1.12 in all its regions, from Arizona to Washington, due to the fact that this company only presents average values of its centers without going into details of each location individually. On the other hand, Alibaba and Tencent register higher values (1.2), and like Microsoft only report an average PUE, this may indicate strategic differences in their approach to energy efficiency.
Analyzing the data it can be identified that although weather could be a relevant factor in theory, in practice its impact seems to have been mitigated by advanced technical solutions. The variations in PUE seem to respond mainly to internal decisions of each vendor, such as their level of investment in eficiency technologies, the modernization of their infrastructure or GPU models available, as in the case of Alibaba and Tencent that by presenting older GPU models a clear increase in PUE value is observed with respect to the other vendors studied. This perspective, underlines the importance of continuous innovation in the sector to achieve even higher standards of energy sustainability.
2 Research was conducted on the major climate types in the U.S. and concluded that in an initial instance there is no direct correlation between PUE variations vs. climate types. [Guide to Determining Climate Zones by County: Building America and IECC 2021 Updates]
In terms of energy consumption, key information on annual consumption was obtained from the main suppliers:
● AWS leads in volume with a consumption of 74 TWh, reflecting its extensive infrastructure.
● Google recorded 21 TWh, highlighting its high eficiency (PUE ~1.1) despite a smaller scale.
● Microsoft reached 46 TWh, with a competitive average PUE (1.12).
In addition, information was obtained on Tencent's power demand, with a value of 160 MW in all its centers.
These data reinforce that, although absolute energy consumption varies significantly, the eficiency measured by PUE is critically dependent on technology investments. Transparency in reporting (Alibaba, Microsoft, and Tencent only average data) also emerges as a challenge for accurate benchmarking.
5.5 Data center energy infrastructure
The technology sector is facing a complex energy scenario that is becoming increasingly urgent. According to Shehabi, A., et al., (2024), by 2023, all data centers in the United States already consumed 4.4% of the country's electricity, and the same research projects that this number could triple by 2028 because of the growth of AI. While three of the country's largest companies, Microsoft, Google, and AWS, have made progress on sustainability, such as Microsoft's 6% decrease in direct emissions or Google's energy eficiency milestone (PUE of 1.10), these attempts appear to be insufficient in the face of exponentially increasing energy demand.
This challenge can be intensified by taking into account the energy matrix of the United States, where natural gas continues to dominate. According to the Energy Information Administration (EIA), by 2023, this fossil fuel provided 43.1% of the country's electrical energy, positing that dependence on this resource will
generates uncertainties about the feasibility of an accelerated energy transition, despite the fact that the United States has natural gas self sufficiency, with production of 45.55 trillion cubic feet (Tcf) in 2023 and verified reserves of 653 Tcf.
The contradiction between the discourse of sustainability and the reality of energy consumption in the technology sector is palpable. Shehabi, A., et al., (2024), propose structural solutions, such as reusing retired coal plants or designing green electricity tariffs. However, these actions may not be adequate if the energy demand of Artificial Intelligence and data centers continues to increase without restrictions.
5.6 Policy and data centers
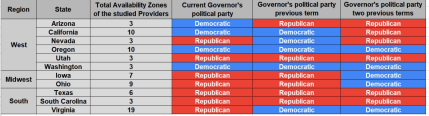
When analyzing the states with data centers of the providers under study, it is striking that there is no clear correlation between the partisan affiliation of the governors and the presence (or absence) of these infrastructures. Nor does there appear to be a direct link with technical variables such as the availability of GPUs or energy efficiency (PUE). This suggests that technology investment might be more influenced by economic, geographic or market factors than by political ideologies.
5.7 Strategic and Governance Implications
The results of this study allow us to analyze how data center infrastructure in the United States shapes dynamics of technological power, economic competitiveness and governance risks. The evidence gathered shows a landscape dominated by U.S. providers (AWS, Google and Microsoft), who not only concentrate the largest number of availability in key regions such as the West (42%) and the South (37%), but also lead in technical capabilities. This dominance is particularly manifested in their privileged access to next-generation GPUs (H100, H200, A100) and in their energy efficiency standards, with remarkable PUE values such as Google's 1.1 in Oregon or Microsoft's uniform 1.12 in all their regions.
In contrast, the Chinese vendors (Alibaba and Tencent) present a distinct disadvantageous position. Their infrastructure in the U.S. is limited to a few locations, mainly in California and Virginia, and they rely on older GPU models such as the V100 and T4. This technological disparity appears to reflect current geopolitical tensions and trade restrictions, cementing the competitive advantage of U.S. companies in the development of advanced AI and high-performance computing applications.
However, this concentration of technical capabilities in a few private national players raises important questions about governance. The control exercised by these companies over critical infrastructure gives them quasi-regulatory power, evidenced by their ability to disconnect services or prioritize customers according to corporate criteria. In addition, the current geographic distribution creates systemic vulnerabilities, as regions such as Virginia, which is home to 37% of the Availability Zones analyzed, become single points of potential failure in the face of disasters or cyberattacks.
The energy aspect emerges as another relevant contradiction. Despite the advances in eficiency reflected in the PUE values, the sector's electricity consumption follows an unsustainable trajectory. Current demand clashes with an energy matrix that still relies 43.1% on natural gas, raising serious doubts about the compatibility between technological growth and climate commitments.
A particularly significant finding is the apparent disconnect between these technological dynamics and traditional political variables. The study found no correlation between the partisan affiliation of state governors and the location of data , suggesting that investment decisions respond primarily to economic factors such as operating costs, energy availability, and business demand, rather than ideological considerations.
In summary, the U.S. data center infrastructure represents a strategic asset that reinforces its global technological leadership, but simultaneously poses complex challenges. The concentration of capabilities in a few national companies, combined with exponential growth in energy demand, requires more robust governance frameworks that balance innovation, national security and sustainability. Future research should delve into how to design public policies that mitigate the risks of centralization without compromising competitiveness, as well as developing more accurate metrics to assess the actual environmental impact of these critical infrastructures.
6. Perspectives
For future extensions of this study, the following steps and lines of research are recommended:
● Analyze the impact of local renewable energies on the location of data centers, evaluating how their integration would reduce natural gas consumption.
● Investigate public-private cooperation models to decentralize infrastructure in marginalized regions, using fiscal incentives or access to renewables.
● Explore the presence/absence of fiscal incentives for the presence of data centers in certain regions.
● Expand the suppliers under study to get a broader picture.
● Consider more GPU models that may be available in different data centers.
● Extend the sample to other countries with different energy matrices, such as Europe.
● Include social variables such as employment generated or impact on local communities.
● Incorporate other metrics and/or variables such as evaluating carbon footprint and water consumption.
This work highlights the need for multidisciplinary collaboration:
● Renewable energy specialists: To identify areas with renewable energy potential to optimize the location of data centers.
● Legislators and regulators: To generate policies that link energy efficiency (PUE.15) with access to renewables (>70%).
● Digital justice organizations: To ensure that infrastructure expansion does not repeat patterns of territorial exclusion.
● AI specialists to provide insight and integration of physical infrastructure coupled with software infrastructure.
7. References
AI Smarties (2025). Comprehensive Market Research on Cloud Infrastructure in United States 2024. Accessed April 8, 2025. Retrieved fr
om
https://ai-smarties.com/en/market/cloud-infrastructure-in-united-state s-2024
Alibaba. (2024). ENVIRONMENTAL, SOCIAL, AND GOVERNANCE REPORT 2024. Accessed February 8, 2025. Recuperado de https://data.alibabagroup.com/ecms-files/1375187346/c4b32e0a-e6ba-4 dea-a371-ac476a865a61/2024%20Alibaba%20Group%20Environmental
%2C%20Social%20and%20Governance%20Report.pdf?spm=a2c65.1146 1447.0.0.23b75f90E0JlWV&file=2024%20Alibaba%20Group%20Environ mental%2C%20Social%20and%20Governance%20Report.pdf
Alibaba Cloud (2021). An Introduction to Alibaba Cloud. Accessed on 10 from February 10 from 2025. Retrieved from https://www.westcoastcloud.co.uk/wp content/uploads/2023/02/An-Intr oduction-to-Alibaba-Cloud.pdf.
Alibaba Cloud (n/d). Alibaba Cloud's Global Infrastructure. Accessed on 23 of January 23,from 2025. Retrieved
from https://www.alibabacloud.com/en/global

locations?_p_lc=1 J_8338958 430
Alibaba Cloud (n/d). Elastic GPU Service. Accessed February 1, 2025. Retrieved
from
https://www.alibabacloud.com/es/product/heterogeneous_computing ?_p_lc=1
Alibaba Cloud Community (2024). Alibaba Progresses Towards Carbon Neutrality Goals and Digital Inclusion 2024 ESG Report. Accessed February 8February 8 from 2025. Retrieved de https://www.alibabacloud.com/blog/601423?spm=a3c0i.29367734.6737 026690.1.6d217d3f2rTwtw
Allen, G. (2022). Choking off China's Access to the Future of AI. Accessed April 9, 2025. Retrieved from https://www.csis.org/analysis/choking-chinas access-future-ai
Antonopoulos, C., Gilbride, T., Margiotta, E. (2022). Guide to Determining Climate Zones by County: Building America and IECC 2021 Updates. Accessed March 29, 2025. Retrieved from https://www.osti.gov/servlets/purl/1893981
AWS (n/d). Amazon EC2 instance types by Region. Accessed February 8 from 2025. Retrieved
from
https://docs.aws.amazon.com/ec2/latest/instancetypes/ec2-instance-re gions.html
AWS (n/d). Amazon EC2 Instance types. Accessed February 8, 2025. Retrieved
from
https://aws.amazon.com/ec2/instance-types/?nc1=h_ls
AWS (undated). AWS Cloud. Accessed February 8, 2025. Retrieved from https://sustainability.aboutamazon.com/products-services/aws-cloud
AWS (n/d). Regions and Availability Zones. Accessed January 23, 2025. Retrieved
from https://aws.amazon.com/es/about
aws/global-infrastructure/regions_az
/?nc1=h_ls
Google Cloud (n/d). GPU machine types. Accessed February 8, 2025. Retrieved from https://cloud.google.com/compute/docs/gpus
Google Cloud (n/d). GPU regions and zones. Accessed February 1, 2025. 2025. Retrieved
from
https://cloud.google.com/compute/docs/gpus/gpu-regions-zones
Google Cloud (n/d). Regions and zones. Accessed January 23, 2025. Retrieved
from
https://cloud.google.com/compute/docs/regions-zones
Google (2024). Google data center PUE performance. Retrieved February 7 February 7 from 2025. Retrieved from https://datacenters.google/efficiency/
Google (n/d). From the garage to the Googleplex. Retrieved February 10 from 2025. Retrieved
from https://about.google/company-info/our-story/
Haranas, M. (2025). AWS, Microsoft, Google Fight For $90B Q4 2024 Cloud Market Share. Accessed April 10, 2025. Retrieved fr
om
https://www.crn.com/news/cloud/2025/aws-microsoft-google-fight-for 90b-q4-2024-cloud-market-share
https://www.tencentcloud.com/global-infrastructure/sustainability
Lehdonvirta, V., Wu, B., Hawkins, Z. (2024). Public cloud census 2023. Accessed January 23, 2025. Retrieved from https://osf.io/zt8yk
Lino, G. (2024). The Complete Amazon Company History Timeline: A Guide to the E-Commerce Giant's Journey. Accessed February 10, 2025. 2025. Retrieved
from https://www.girolino.com/the-complete
amazon-company-history-tim eline-a-guide-to-the-e-commerce-giants journey/
Martin, J., Gabriel, M. (2021). Hyperscaler Cloud Service Providers Top 10. Accessed February 8, 2025. Retrieved from https://newsroom.accenture.com/content/1101/files/hyperscaler.pdf
Microsoft (2024). 2024 Environmental Sustainability Report. Retrieved on 8 from February from 2025. Retrieved from https://cdn dynmedia-1.microsoft.com/is/content/microsoftcorp/micros
oft/msc/documents/presentations/CSR/Microsoft-2024-Environmental Sustainability-Report.pdf
Microsoft (n/d). Microsoft Datacenters. Accessed January 23, 2025. Retrieved
from
https://datacenters.microsoft.com/globe/explore/?view=table
Microsoft (n/d). Product Availability by Region. Accessed February 8 from 2025. Retrieved
from https://azure.microsoft.com/en-us/explore/global infrastructure/produc ts-by-region/table
Ramanathan, T., Comstock, F. (2024). Tencent. Accessed February 10 from 2025. Retrieved
from https://www.britannica.com/money/Tencent
Republican Governors Association (2025). 2025 PARTY CONTROL MAP. Accessed February 21, 2025. Retrieved from https://www.rga.org/maps/
Shehabi, A., et al. (2024). 2024 United States Data Center Energy Usage Report. Lawrence Berkeley National Laboratory, Berkeley, California. LBNL-2001637. Retrieved
from https://eta
publications.lbl.gov/sites/default/files/2024-12/lbnl-2024-unit ed-states data-center-energy-usage-report.pdf
Stripe (2024). What are the best states for startups? Here's how they compare. Accessed April 10, 2025. Retrieved from https://stripe.com/resources/more/what-are-the-best-states-for-startup s here-is-how-they-compare.
Tencent Cloud (n/d). Computing Instance. Accessed February 1, 2025. Retrieved
from
https://www.tencentcloud.com/document/product/560/19701
Tencent Cloud (n/d). Sustainability in Tencent Cloud. Retrieved February 1 from 2025. Retrieved
from https://www.tencentcloud.com/global infrastructure/sustainability
Tencent Cloud (n/d). Tencent Cloud Global Infrastructure. Accessed on 23 from January 23 from 2025. Retrieved from https://www.tencentcloud.com/global-infrastructure
U.S. Energy Information Administration (2024). Frequently Asked Questions (FAQs) - What is U.S. electricity generation by energy source?. Accessed March 29, 2025. Retrieved from https://www.eia.gov/tools/faqs/faq.php?id=427&t=3
U.S. Energy Information Administration (2024). Natural Gas Annual 2023 Accessed March 29, 2025. Retrieved from https://www.eia.gov/naturalgas/annual/pdf/nga23.pdf
U.S. Energy Information Administration (2024). Natural gas explained -
How much natural gas is left. Accessed March 29, 2025. Retrieved fr
om
https://www.eia.gov/energyexplained/natural-gas/how-much-gas-is-lef t.php
U.S. Energy Information Administration (2023). U.S. States - State Profiles and Energy Estimates. Accessed February 14, 2025. Retrieved from https://www.eia.gov/state/
Zachary, G., Hall, M., Montevirgen, K. (2025). Microsoft Corporation. Retrieved February 10, 2025. Retrieved from https://www.britannica.com/money/Microsoft-Corporation
Zhang, M. (2024). Amazon Web Services (AWS) data center locations: Regions and availability zones. Accessed April 8, 2025. Retrieved from fr
om
https://dgtlinfra.com/amazon-web-services-aws-data-center-locations/
8. Personal Reflexion.
This project has reaffirmed my conviction that geology, when applied with a social vision, can be a powerful tool for collective well-being. By studying data center infrastructure from a critical perspective, analyzing its energy consumption, geographic location, and inequalities in access, I have come to understand that behind every technological advance are decisions that affect entire communities.
Careers with Impact has broadened my ethical framework to make me question not only how to make something technically feasible, but also how to ensure that these developments benefit the majority. My time in the program taught me that technical excellence and social conscience are not distinct goals, but complementary aspects of a truly transformative profession.
Annexes
ANNEXES 1 Databases
1. Database of data centers in the U.S.: access 2. GPUs database: access
Executive summary: This exploratory project by Gabriel Rafael Rosario Bolivar maps the geographic and corporate distribution of U.S. data center infrastructure to reveal how physical access to advanced computing resources—especially GPUs and energy—shapes AI development, sustainability, and technological governance, concluding that strategic concentration poses systemic risks and should be addressed through transparency, decentralization, and policy reform.
Key points:
This comment was auto-generated by the EA Forum Team. Feel free to point out issues with this summary by replying to the comment, and contact us if you have feedback.