This is a series of posts for the Bayesian in a hurry. The Bayesian who wants to put probabilities to quantities, but doesn't have the time or inclination to collect data, write code, or even use a calculator.
In these posts I'll give a template for doing probabilistic reasoning in your head. The goal is to provide heuristics which are memorable and easy to calculate, while being approximately correct according to standard statistics. If approximate correctness isn't possible, then I'll aim for intuitively sensible.
An example of when these techniques may come in handy is when you want to quickly generate probabilistic predictions for a forecasting tournament.
The first post in this series covered distributions over positive values with a lower bound, with estimating the lifespan of humanity as a motivating example. In this post, we'll build on that foundation to discuss probabilistic reasoning when you only have a single datapoint.
For those who struggle with the mathematical details, you may skip to the TL;DRs.
Recap: Positive Values with a Lower Bound
First, a recap of the previous post. A process will survive for some unknown time . So far, the process has survived from time to the present time . With no additional knowledge, we have the following survival function:
which can be summarised as "the probability of surviving until is equal to the proportion of which has already been survived".
From this distribution, we get the following facts.
- The median value is (Lindy's Law).
- With 50% confidence the process will survive at least an additional but at most an additional .
- With 90% confidence the process will survive at least an additional but at most an additional .
Positive Values with an Upper Bound
We now consider the case where a process is guaranteed to end by .
If all we know is that a number falls somewhere between and , then a sensible prior over possible values of is a uniform distribution over the range :
with a cumulative function
Note that we get the doomsday argument (and the distirbution) by applying this treatment to the variable , which has an upper bound of .
Postive Distributions from One Datapoint
The Problem
You see an urn labelled "positive numbers". You draw a ball from an urn. The ball has "1.0" written on it. What can you say about the number which will be written on the next ball you draw from the urn?
There's some sense in which you can't really say anything. The value you drew gives you an estimate of the centre of the distribution of numbers, but you don't know anything about its variance. The values may be distributed from 0.99 to 1.01, or they may be distributed from 1 to 1,000,000. Who knows? We have no idea what kind of scale we're dealing with here.
If you're doing frequentist statistics, then this problem manifests in that you can estimate the mean of the distribution with one datapoint, but the standard deviation is undefined.
If you're doing Bayesian statistics, then you can say something like "given such and such model with such and such prior over parameters, the posterior over parameters is such and such and so the expected distribution is such and such". What that expected distribution looks like will be highly sensitive to the details of "such and such".
But as this post points out:
Things that sometimes weigh 142 grams don't typically also sometimes weigh 12 solar masses. Similarly, things that take 5 minutes don't typically also take 5 days, and things that are 5 cm long aren't typically also 5 km long.
Can we come up with a hand-wave-y justification for some distribution which roughly matches this intuition?
Yes!
The Solution
What is the probability that the second ball has a larger number than the first ball? It's possible that balls with larger numbers are heaver and tend to accumulate at the bottom of the urn. In this case, you'd expect the numbers to increase on average as you draw further balls. But the opposite could just as likely be true. So by symmetry, we'd say there's a equal probability of the next ball having a larger or small number.
What about the next ball having the same number as the first ball? Good question. I'm not sure how to answer that. To keep things simple, I'm going to assume we're dealing real-valued domain where the probability of two samples having exactly the same value is zero. So no integers and no Dirichlet Processes.
So there's a 50/50 chance that the second sample is greater or small than the first sample. Let be the first sample, and be the second sample. Then we can consider the cases separately
- 50% probability that is an upper bound, in which case the probability density function would be
- 50% probability that is a lower bound, in which case the probability density function would be
Stitching these two cases together, we get the following density function:
And the following cumulative function:
Which we can plot as follows:
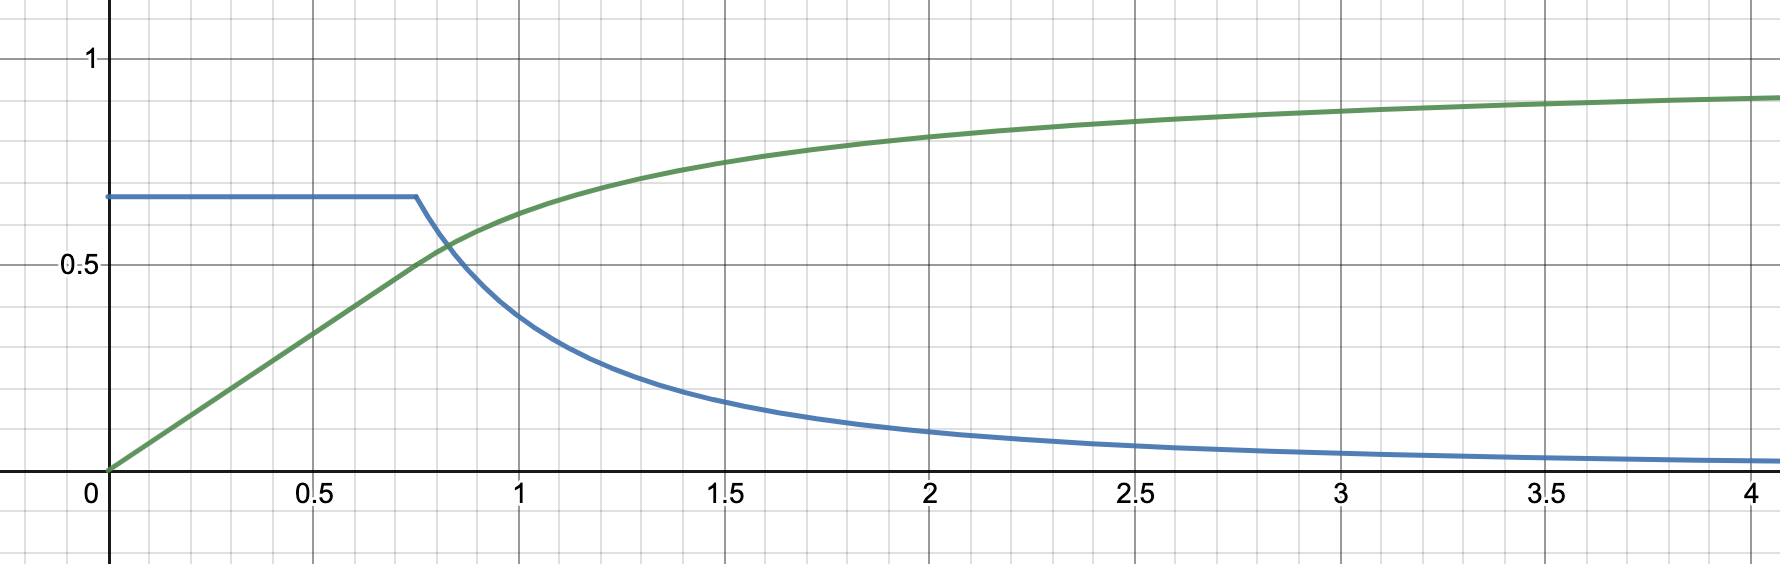
What does this distribution represent exactly? Our discussion so far has focused on the second sample from a some distribution (specifically the second draw from an urn of numbered balls). But there's nothing special about the second sample: the same reasoning applies to any sample. So in fact this distribution describes our "best guess" of the distribution which gave our first sample. In Bayesian terms it is our expected distribution.
We can also think of this as our posterior over the median value of the distribution. By definition, any sample has a 50/50 chance of being greater than or less than the median. It follows that the median has a 50/50 chance of being an upper bound or a lower bound of our first sample. So if we are estimating a point value with a noisy measurement, then this is our probability distribution over the point value given our measurement.
Example: Borogroves
To make this a bit more concrete and intuitive, imagine you come across a borogrove for the first time. This particular borogrove is 2m tall. Let's do a Q&A about borogroves.
Q: Are more borogroves taller or shorter than 2m?
A: I think half of borogroves are taller than 2m and half are shorter.
Q: So the median height of borogrove is 2m?
A: Yes.
Q: What about the mean height?
A: The mean of the right tail of borogrove height is undefined, so the mean height is undefined.
Q: How many borogroves are shorter than 1m?
A: The probability of a borogrove being shorter than 2m is 0.5. Conditional on being shorter than 2m, borogrove heights are evenly distributed, so the probability of being shorter than 1m is 1m/2m=0.5. Multiplying these together gets an overall proportion of 0.25 of borogroves that are shorter than 1m.
Q: How many borogroves are taller than 4m?
A: The probability of a borogrove being taller than 2m is 0.5. Conditional on being taller than 2m, borogrove heights have a survival function , so (Lindy's Law again). Multiplying these together gets an overall proportion of 0.25 of borogroves that are taller than 4m.
Q: What is the 50% confidence interval for the height of a borogrove?
A: There's a 25% probability of being shorter than 1m and a 25% probability of being taller than 4m, so the 50% confidence interval is 1m to 4m.
Q: What about the 90% confidence interval?
A: If the borogrove is shorter than 2m, then it will be taller than 2m/10=0.2m with 90% confidence. If the borogrove is taller than 2m, then the height with a survival of 10% is 2m/x=0.1, so x=2m/0.1=20m. So our 90% confidence interval is 0.2m to 20m. That is, one-tenth to ten times the value of our first sample.
Q: 99% CI?
A: By similar reasoning: 0.02m to 200m.
TL;DR
If you take a sample from some distribution, then following samples will
- have median value .
- be between and with 50% confidence.
- be between and with 90% confidence.
- be between and with 99% confidence.
These facts also apply to the median of the distribution. Thus if you've taken a noisy estimate of a point value, then the facts prescribe your beliefs about the point value.
The Fundamental Conjecture of Lazy Statistics
We can summarise our discussion so far with what I call The Fundamental Conjecture of Lazy Statistics:
Given any two numbers, and , you can get a sensible probability value by dividing the smaller number by the bigger number.
Examples:
- A car has worked for five years. What is the probability that it will still be working after twenty years (including the original five)? Answer: 5/20=25%.
- The first car for sale I see on some website costs $8k. What is the probability that the second car costs over $800k? Answer: 8/800 = 1%.
Actually the second probability should be divided by two (0.5%) because the second car could go higher or lower than the first car. But if you're dealing with low probabilities then this doesn't make much difference.
The Fundamental Conjecture is not often the best tool to use when making predictions. It is, however, the easiest tool. Use it as a first pass on problems while your brain is booting up.
The hard part is often finding two numbers which you can divide in the first place.
Examples
If you are so inclined, try to solve these problems before looking at the answers.
Example 1: Radius of a planet
The Earth has a radius of about 6,000 km. A new exoplanet is discovered in a nearby star system. What is its radius?
Answer: 600km to 60,000km with 90% confidence, or 60km to 600,000km with 99% confidence.
Example 2: AI Timeline
According to this paper:
Researchers believe there is a 50% chance of AI outperforming humans in all tasks in 45 years and of automating all human jobs in 120 year
When can we be 99% certain that AI will automate all human jobs? What is the probability of all human jobs being automated next year?
Answer: 99% confidence of all jobs automated within years. Probability of job automation within one year is , which we then divide by two (because 45 years could be an upper or a lower bound), to get probability.
Next Time...
In the next installment in this series, we'll drop the non-negativity constraint and continue with real-valued distributions from a single data point.
You may have noticed that this post didn't have any proper Bayesian or frequentist statistics. Hopefully we'll loop back to that next time.
After that we'll start looking at situations where we have multiple data points. Exciting!


Thanks. Fixed.