This project was carried out as part of the “Carreras con Impacto” program during the 14-week mentorship phase. You can find more information about the program in this entry.
Introduction
In order to get prepared for the emergence of new and disruptive AI capabilities, which could potentially lead to catastrophic scenarios, it is crucial to fully understand the current and near-future capabilities and limitations of this technology.
One way to achieve this is by evaluating the performance of IA models across a diverse set of tasks. However, it is expected that, to efficiently complete these tasks, AI models would transfer knowledge from prior tasks and incorporate abilities from different models. Therefore, it becomes increasingly important to assess AI performance in complex domains, such as mathematics, where problem-solving and logical reasoning are essential.
Driven by this need, the focus of this project is to evaluate language models in the specific context of graph theory, which require advanced problem-solving skills. By designing and implementing specific tasks through experiments, it is aimed to gain valuable insights into AI’s broader capabilities, including its potential to adapt and generalize knowledge in this domain.
To better understand the background and rationale behind this project, we first address a series of key questions that provide essential context to clarify the approach taken and the relevance of the tasks, as well as the reasons for choosing language models to solve graph theory problems:
Why a problem-solving approach?
The problem-solving approach is useful for evaluating how well the model retains key information, such as definitions, algorithms, and results, as well as its ability to accurately apply these algorithms. This is particularly relevant in graph theory, where tasks typically involve finite objects.
Why language models?
Language models were chosen due to their accessibility and their remarkable advancements in recent years. Also, these models have been subjected to a wide range of benchmarks, making it easier to evaluate their performance in different tasks. Given their ability to generate language and tackle problem-solving, they were considered ideal candidates for this project.
What is a task?
We can think of a task as a structured test, which consist of:
- A specific ability we want to measure (e.g., memorization, problem-solving)
- An instrument to assess that ability (e.g., a set of questions designed by a teacher)
- An interaction (e.g., the printed test being handed to the student, completed, and returned)
- An evaluation (e.g., the teacher grading the test).
In this context, tasks can take different forms: a simulation, a set of questions in a test, a part of a conversation, among other possible formats. However, just like any test, a task can have imperfections. For example, it may exhibit bias, provide a poor simulation, or even be affected by external factors such as luck or cheating.
What is a graph?
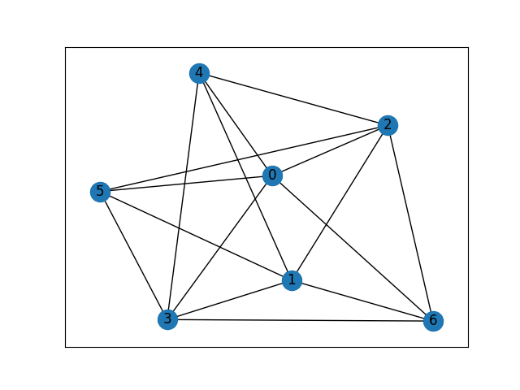
In this project, we refer to a graph as a simple, undirected graph. It consists of two sets: one of vertices (which could represent anything from numbers to cities, people, etc.), and another of edges, which are pairs of vertices. The order of the vertices in each pair does not matter, but no repeated or self-looping edges (edges connected a vertex to itself) are allowed.
In a graph, we can represent the nodes as points and the edges as lines connecting them, as shown in the following figure:
Objectives
The objectives of this project are as follows:
- To understand the processes of designing mathematical tasks for AI.
- To create a series of complex tasks that challenge AI models.
- To evaluate AI models based on their ability to solve these tasks.
- To estimate the performance of the models in completing these tasks.
Initial assumptions
Initially, it was assumed that models would not have extensive knowledge of graph theory. It was expected to encounter nonsensical or incorrect answers, or responses that referenced graphs without properly addressing the questions. These assumptions were important to developing specific problems that were general enough to challenge the models without being overly specialized.
Methodology
The initial methodology for this project was based on the Beyond Imitation Game (BIG) benchmark, particularly in the Chinese Remainder Theorem task. In this approach, a template is designed and filled with data from a list to generate a series of prompts, where each prompt had a clear, correct answer that could be easily verified. However, designing the template requires a deep understanding of how to translate the problem into real-world terms, with no clear justification as to whether the chosen template would be optimal for accurately assessing the model's performance.
During the design of the evaluation process, it became clear that several factors are crucial: what is being asked, how the question is framed, how the results are analyzed, and how the findings are communicated. As the project evolved, these considerations led to the adoption of a methodology based on Talk Like a Graph: Encoding Graphs for Large Language Models, which addresses the specific challenges of prompting language models in graph theory tasks.
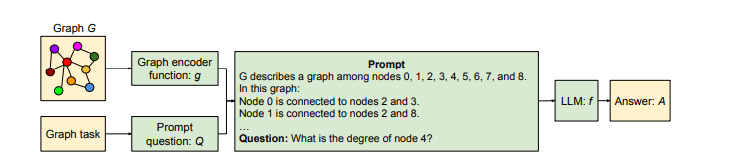
In mathematical problems, from an initial object we ask to build another object and/or answer a question about them. This structure is grounded in Talk Like a Graph through the framework for reasoning with graphs. In this framework the problem is separated into graph encoding and prompt question: the prompt question contains the request for the model, while the graph encoding translates the initial graph into a natural language description (Figure 1)
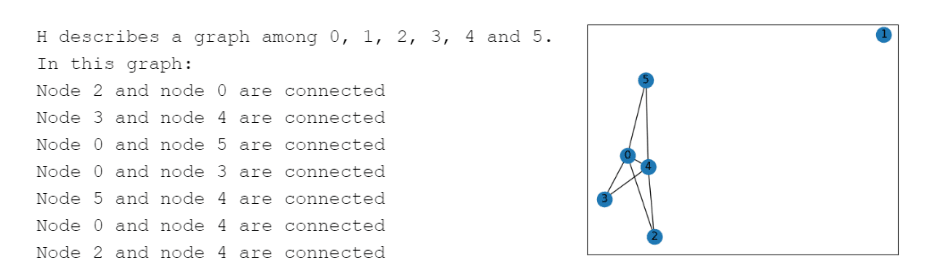
The graph encoding is performed through Graph Encoding Functions that take a graph, which would be the initial object, and represent its nodes and edges in natural language. Nine Graph Encoding Functions are presented, including Incidence Encoding, which describes nodes as numbers and edges as connections among those numbers (Figure 2)
Given the complexity of working with larger graphs, developing custom code became necessary. This code was implemented in a Jupyter Notebook to facilitate the execution and ensure continuity in future research, which is available here.
Experiments and results
Task 1: n-Coloration. Experiment with Gemini Pro
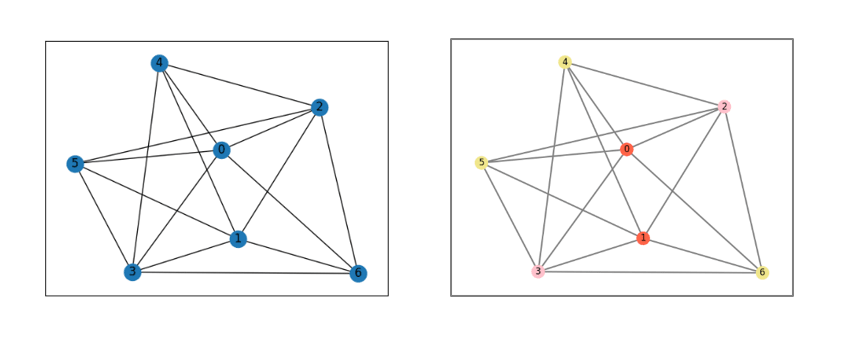
The first task required determining whether there exists a proper n-coloration for a given graph G and provide it. A proper n-coloration is a function from the vertices of G to {color_1, color_2,…,color_n} that assigns a color to each vertex, ensuring that no adjacent vertices share the same color. In the following example (Figure 3) the n-coloration is {0:red, 1:red, 2:pink, 3:pink, 4:yellow, 5:yellow, 6:yellow}
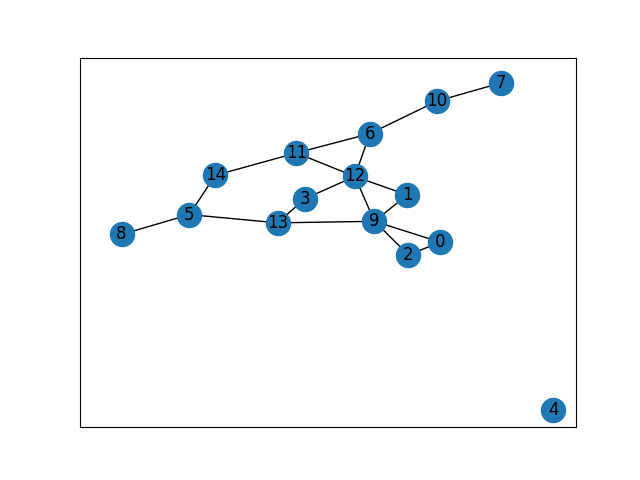
- Dataset: The task used 20 graphs in random orders between 5 and 40, generated with NetworkX's gnp_random_graph() function. An example of one of these graphs is shown in Figure 4
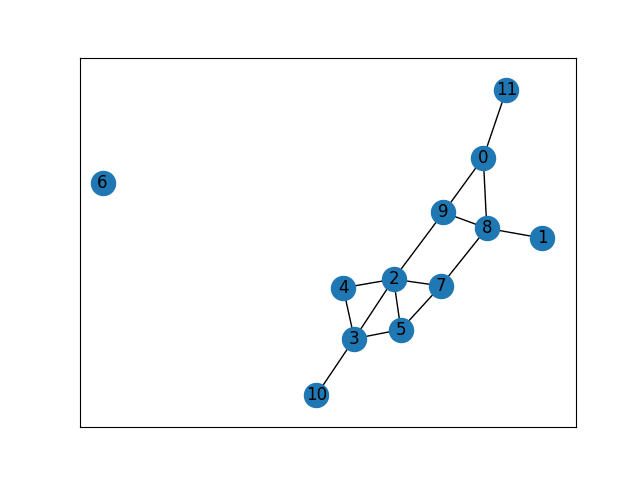
- Prompt: Incidence encoding was employed, using a few-shot prompting technique with prompt question “Give a proper n-coloration of G”. Notice that a (n+1)-proper coloration of G is provided for the few-shot prompting (Figure 5)
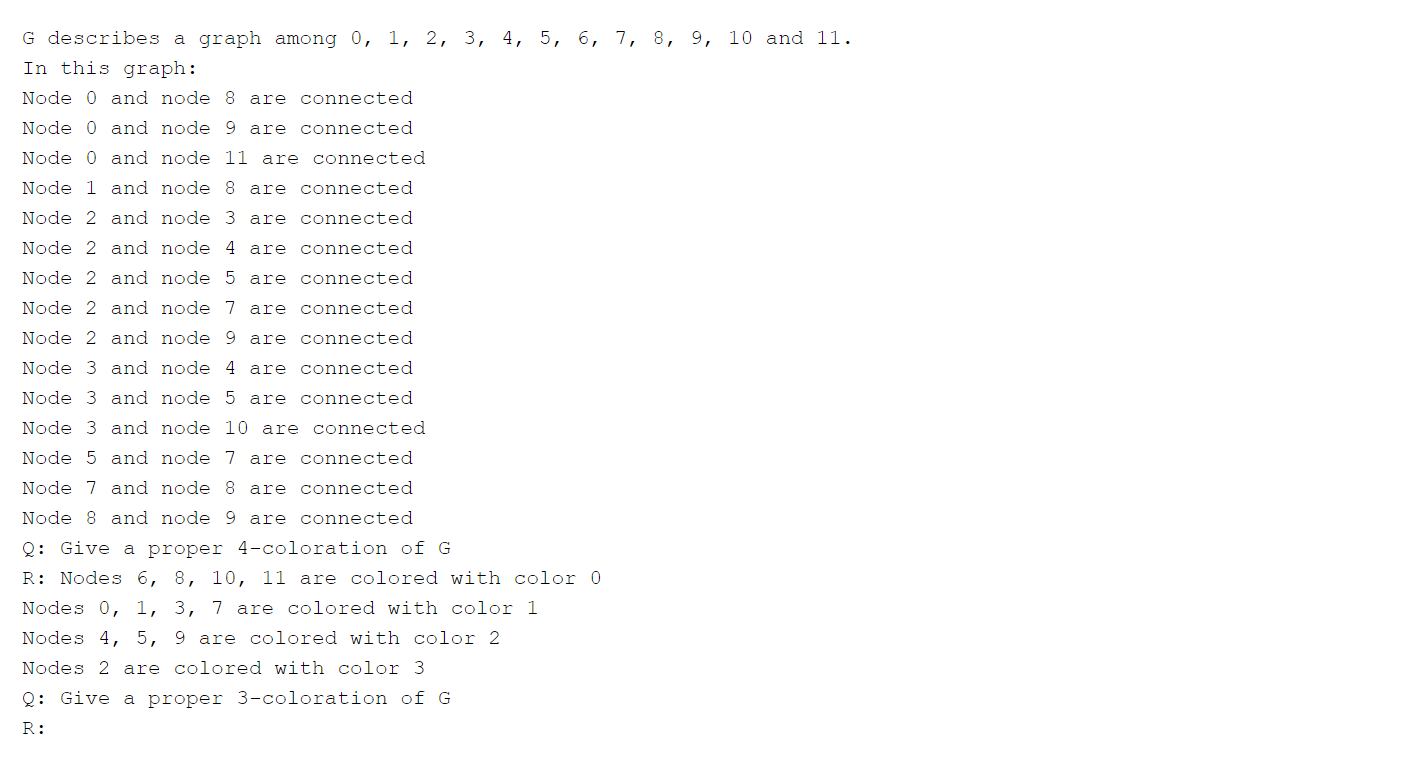
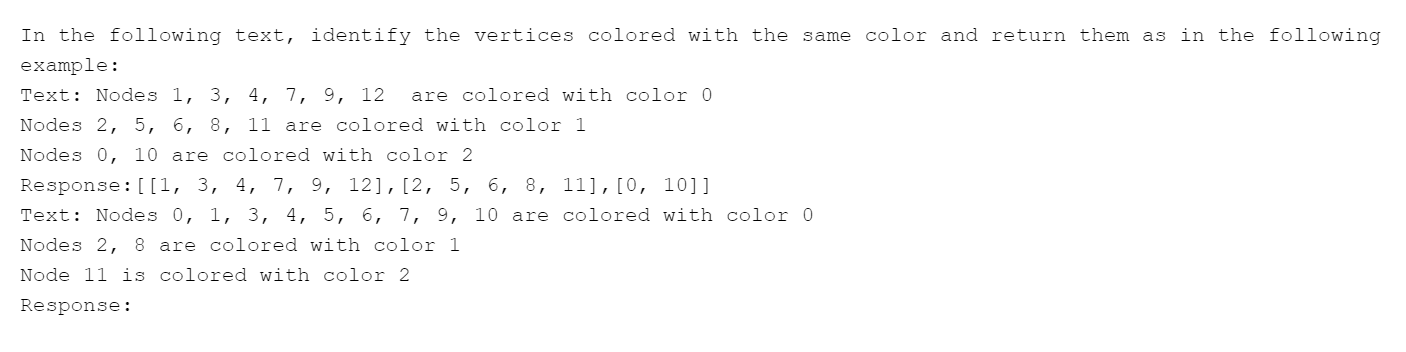
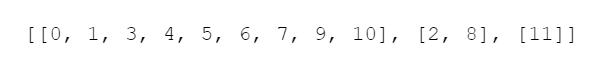
- Evaluation: A new prompt (Figure 6) was used, instructing the model to extract the inferred function (Figure 7) from its previously given answer (which was previously saved). Then, it was evaluated whether the extracted function is in fact a valid function, whether it constitutes an n-coloring, and whether it qualifies as a proper n-coloring
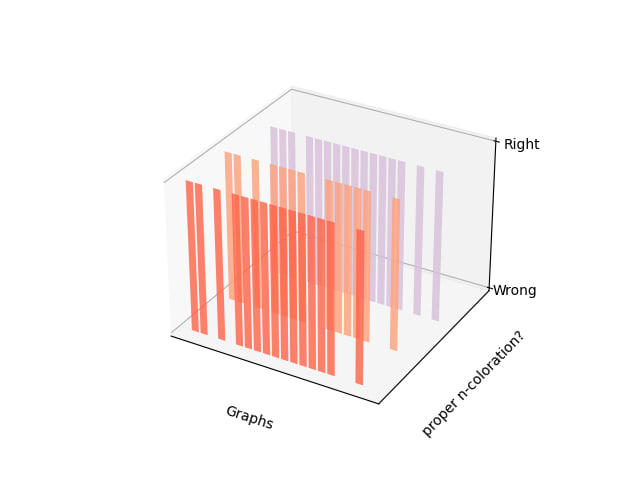
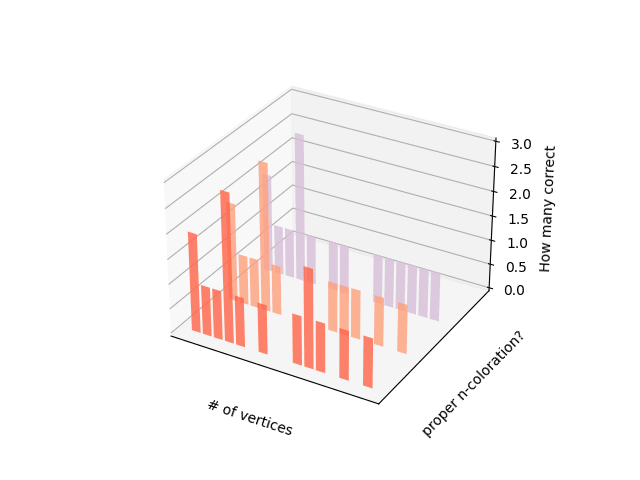
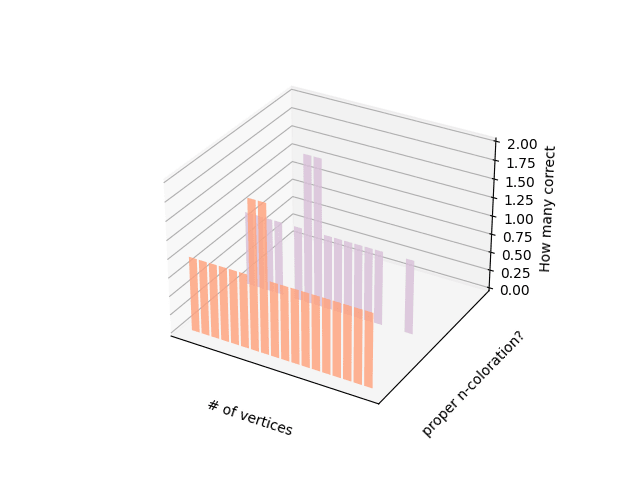
- Results: Of the 20 relations generated, 65% were valid functions, 80% had the set {1, ... ,n} as codomain, and 0% of the generated colorations (65%) were proper (Figure 8). The same evaluations but compared among the number of nodes can be observed in Figure 9.
- Observations:
- It was asked about cities that do in fact exist, and the model assumed this appropriately in each case.
- It was used NetworkX’s greedy_color() function to generate a proper n-coloration, then a (n+1)-coloration was obtained by coloring a node of a new color. This (n+1)-coloration was given in the prompt to the model. Notice that going from a m-coloration to an (m-1)-coloration is harder than going to an (m+1)-coloration.
- The extraction of the coloration from the model's response may reduce confidence in the outcome, but simplifies working with a large number of graphs. Future experiments could explore asking for the answer in a specific format.
- Due to the limited number of graphs, the graphs’ orders are not equally distributed among 0 and 40. For 10, 11, 13, 14, 17, 18, 22, 27, 30, 33, 34, 39 and 40 nodes we have 1 graph each, for 7 and 29 nodes we have 2 graphs each, and for 12 nodes we have 3 graphs.
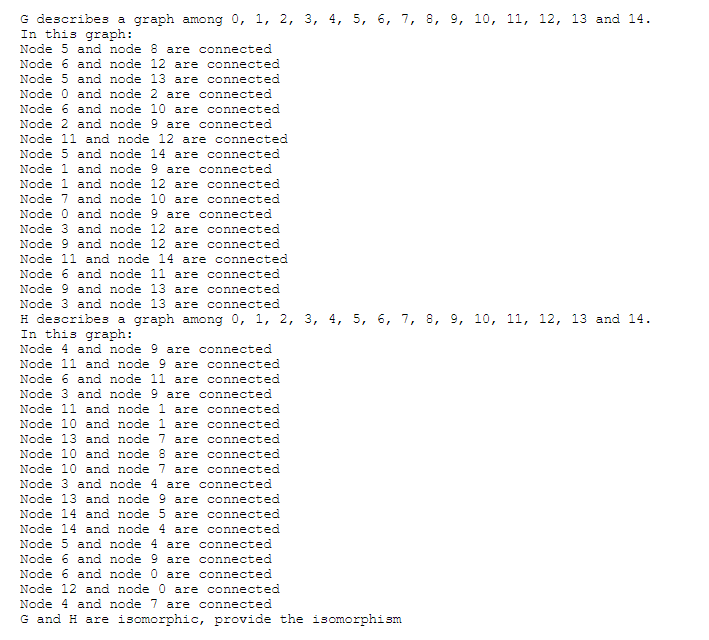
Task 2: Isomorphisms. Experiment with Gemini 1.5 Flash
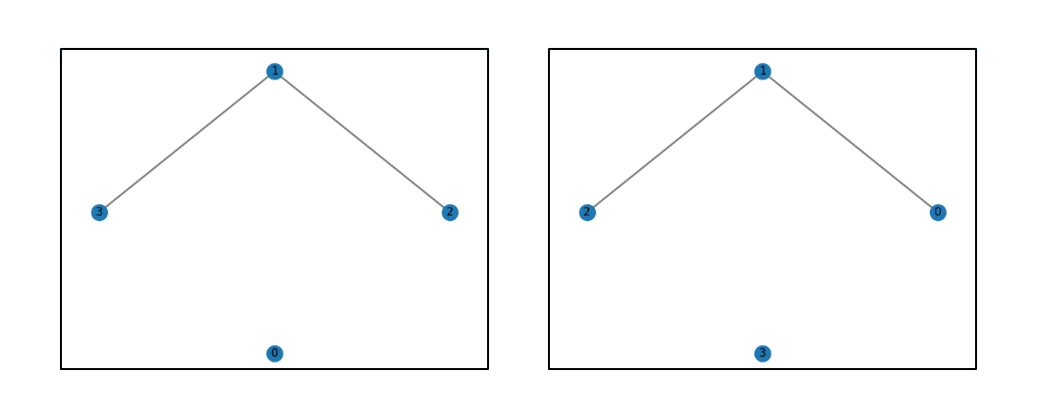
The second task focused on identifying an isomorphism between two isomorphic graphs G and H. An isomorphism is a bijection f between the vertices of G and H such that uv is an edge of G if and only if f(u)f(v) is an edge of H. In the example of Figure 10, the graphs G and H are isomorphic and { 3:0, 1:1, 2:2, 0:3 } is an isomorphism from the vertices of G to the vertices of H.
- Dataset: The second task also used 20 graphs in random orders between 5 and 40, generated with NetworkX's gnp_random_graph() function. An example of one of these graphs is shown in Figure 11
- Prompt: Zero-shot prompting with incidence encoding was applied, providing the prompt question “G and H are isomorphic, provide the isomorphism” (Figure 12).
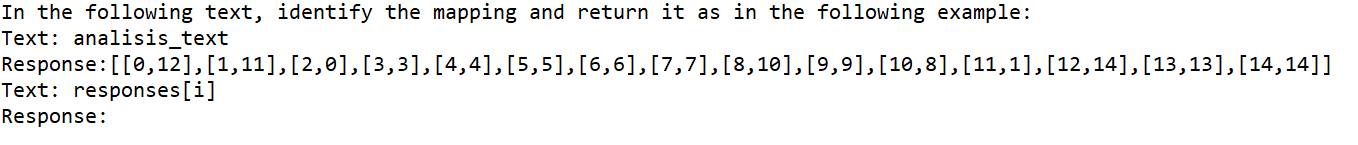
- Evaluation: A new prompt (Figure 13) was used, which asks the model to extract the inferred function (Figure 14) from its previously given answer (previously saved). Then, it was evaluated whether the extracted function is in fact a bijection, and whether it constitutes an isomorphism.

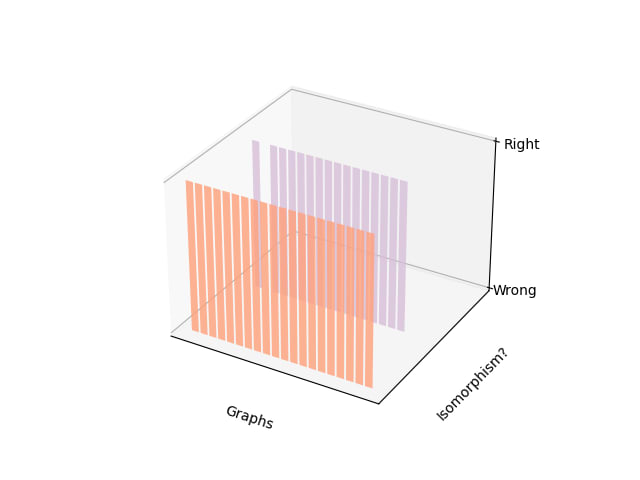
- Results: Of the 20 relations generated, (100%) run over the appropriate number of vertices, 80% were bijections, and 0% of them were isomorphisms (Figure 15) The same evaluations but compared among the number of nodes can be observed in Figure 16.
- Observations
- The isomorphic graphs were generated using the np.random.permutation() function over the nodes, followed by the nx.relabel_nodes() function over the graph.
- The extraction of the coloration from the model’s response may reduce confidence in the accuracy of the outcome, but this approach allows for easier management when working with a large number of graphs. Future experiments could explore requesting the answer in a specific format.
- The model demonstrated an appropriate approach to solving the problem, but execution errors were observed.
Limitations
During the development of this research, several limitations were faced. The rapid and continuous evolution of benchmarks made it difficult to develop a stable and updated long-term analysis, in addition to complicating the information search process. In addition, the difficulty of analyzing unfamiliar literature and learning to use some programming tools caused delays in the development of the project. This prevented us from evaluating more models, performing larger experiments and exploring other interesting directions.
Conclusions
- The models still find it difficult to provide accurate results for the problems presented, particularly given that the tasks of this project are more complex than those presented in the Talk like a graph literature.
- It is hoped that this project will serve as a valuable reference for related future research and contribute to discussions related to AI governance development.
- Task design requires active interaction with models in order to better understand their capabilities and limitations
- Data selection, prompt design and methods evaluation have a significant impact on the outcomes.
Future directions
A natural continuation of this project would involve evaluating agents, as well as multimodal and reinforcement learning models. Additionally, theorem-proving tasks are particularly relevant, as many mathematical problems in this domain require advanced capabilities, such as forming abstractions, engaging in complex hierarchical planning, setting subgoals, backtracking, and exploring alternative approaches. These abilities present significant challenges for AI, but they are essential for solving more complex tasks effectively.
Unsolved questions to think about
- Which kind of problems are the most relevant? Are single-graph problems interesting enough for this evaluations? What about exploring active research topics or unsolved problems while asking for the model’s confidence in its response?
- How should problems be selected? Since small modifications in task structure can significantly modify the model’s response. For example, having two graphs, asking whether they are isomorphic is quite different from asking for the isomorphism itself.
- At prompt level, separating node and edge encoding can make the prompts feel artificial, so How can we make them sound more natural? Could prompts be designed to emulate real-world situations? What if the model were asked to provide the algorithm it follows? Can we ask for the model's confidence in its own responses? What happens when a conversation is sustained or feedback is given?
- What behavior emerge when different variations are made to the graphs, such as changes in the number of vertices or connected components?
- How does giving partial credit can change the results? Could baselines be developed to identify where the model is getting confused or which parts of the process involve guessing?
References
Fatemi, B., Halcrow, J.J., & Perozzi, B. (2023). Talk like a Graph: Encoding Graphs for Large Language Models. ArXiv, abs/2310.04560.
Heng Wang, Shangbin Feng, Tianxing He, Zhaoxuan Tan, Xiaochuang Han, and Yulia Tsvetkov. (2023) Can language models solve graph problems in natural language? arXiv preprint arXiv:2305.10037.
Srivastava, Aarohi et al. (2022) Beyond the Imitation Game: Quantifying and extrapolating the capabilities of language models. ArXiv abs/2206.04615.
Aric A. Hagberg, Daniel A. Schult and Pieter J. Swart, “Exploring network structure, dynamics, and function using NetworkX”, in Proceedings of the 7th Python in Science Conference (SciPy2008), Gäel Varoquaux, Travis Vaught, and Jarrod Millman (Eds), (Pasadena, CA USA), pp. 11–15, Aug 2008
J. D. Hunter, "Matplotlib: A 2D Graphics Environment", Computing in Science & Engineering, vol. 9, no. 3, pp. 90-95, 2007.
Executive summary: This project evaluates language models' problem-solving capabilities in graph theory, revealing limitations in their ability to accurately perform complex tasks like n-coloration and graph isomorphism identification.
Key points:
This comment was auto-generated by the EA Forum Team. Feel free to point out issues with this summary by replying to the comment, and contact us if you have feedback.