This is a brushed up memo from a CEA retreat, aimed at orienting staff to the current state of the EA Newsletter, in preparation for a marketing push.
If you want to subscribe to the EA Newsletter, you can do so here.
Purpose and goal
The EA Newsletter is a frankenstein project - built by many people, not all of whom I've met. It’s five months off a decade old. I've been its writer and custodian for a year and change (before me it was Lizka, and before her, Aaron Gertler).
When it began in 2015, it was focused on updating its audience on developments in the effective altruism community. Over the years, the focus of the newsletter shifted in a few directions. Now it:
- Tries not to assume interest in EA as such, but rather in things EAs find interesting and important. More ‘X says AGI might come soon and this is important because Y’ and less ‘EA should encourage earning to give more’.
- Shares jobs and opportunities which apply to people of all career levels and various interests.
- Follows a set template with three ~250 word featured article summaries, an ‘in other news’ link list, a resources section identical in every issue, job postings, announcements (events, fellowships, funding), a link to the organisational updates post, and a timeless classic.
The EA Newsletter serves:
- The person who has just heard about EA, and might be excited to donate, take an introductory level fellowship, or apply to a relevant role if they see the right link.
- The person who was once very involved in EA, and wants to stay involved in the community.
- The person who reads it for fun
This year, I want to hone in on our theory of change, and either segment the newsletter (if we get more capacity), or change its focus to suit our ideal audience. I want to have the mindset that the stakeholders are the ideal audience, not the current audience.
Two goals which guide our growth in the meantime will be:
- Increasing subscribers.
- While retaining our impact-weighted-clicks/$[1] score of $6/click.
Engagement metrics and performance
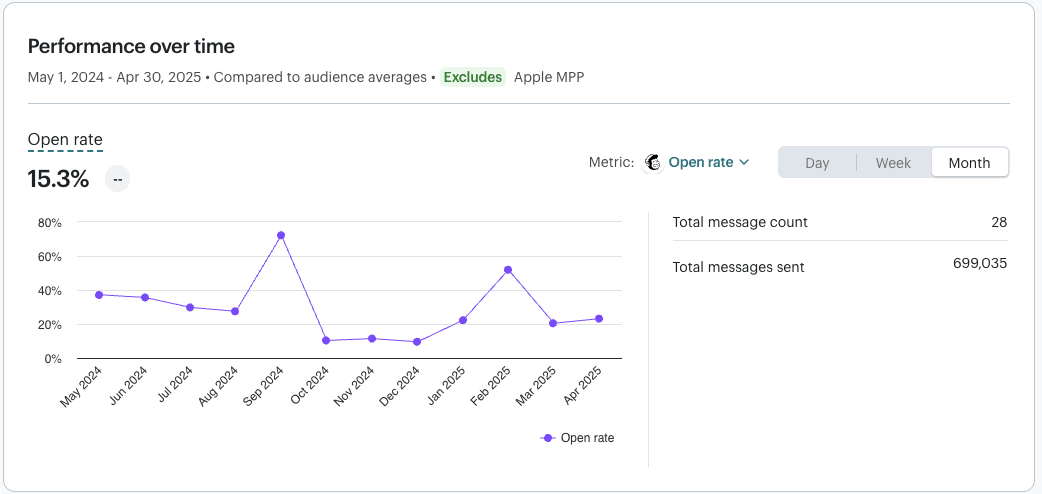
Open rate
% of the audience who open the email.
I take the month-month numbers relatively seriously, but the absolute numbers not so much. The apple MPP exclusion (necessary because of a change in how apple handles emails which began in June last year and means that emails going to iphones might register as opened automatically) makes the data look a lot weirder, but the ranking of emails from most-least opened is roughly the same with or without the exclusion.
To get a more accurate average, we can add on 50% to the open rates (to account for roughly half of global emails going to apple mail). This gets us an average open rate of around 21% for the last year.
What’s the average open rate for emails from non-profits?
NeonOne claims it is 28.59%.
Mailchimp claims it is 40.04%
But neither of them provide detailed data on how this drops with the size of the email list, and the majority of Mailchimp's customers have far smaller lists than ours (so their average open rate would be much higher).
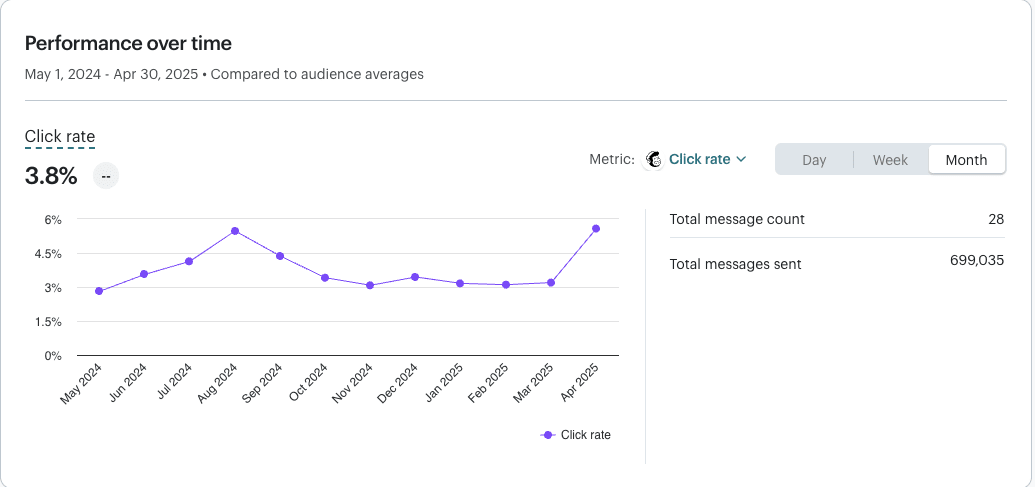
Click rate
% of the audience who click on anything.
What’s the average click rate for emails from non-profits?
NeonOne claims it is 3.29%.
Mailchimp claims it is 3.27%
I trust click rates more, I think they are much easier to measure.
As such I can more confidently say that we are doing great!
New subscriptions and conversion
As of 21 May, we have 58,715 subscribers.
Up until the beginning of April this year, we got most of our subscribers from virtual programs, via a tickbox in their form, and a manual upload every couple of months (the upticks in this graph are all VP):
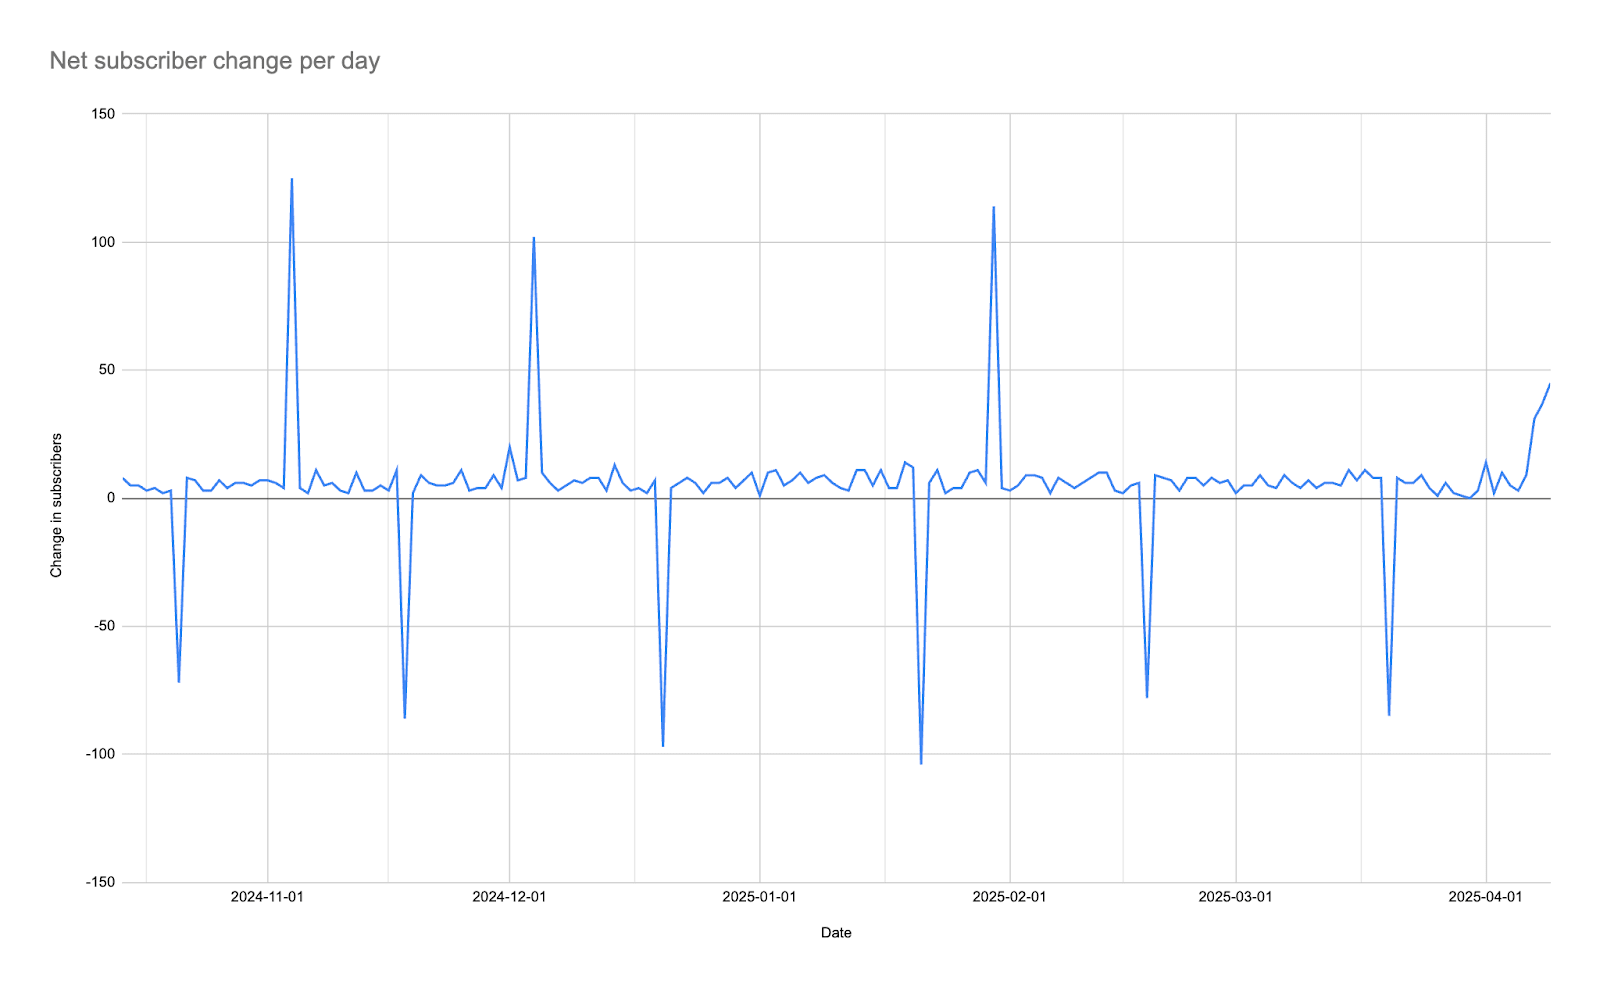
Subscribers also came from the embedded form on EA.org, but the number was negligible, far below the amount needed to replace the monthly loss of around 200-300 subscribers per newsletter.
On April 1, we changed the embed forms on EA.org and CEA.org to allow for single-opt-in (i.e., no need to verify subscription by clicking on an email). This has been transformative:
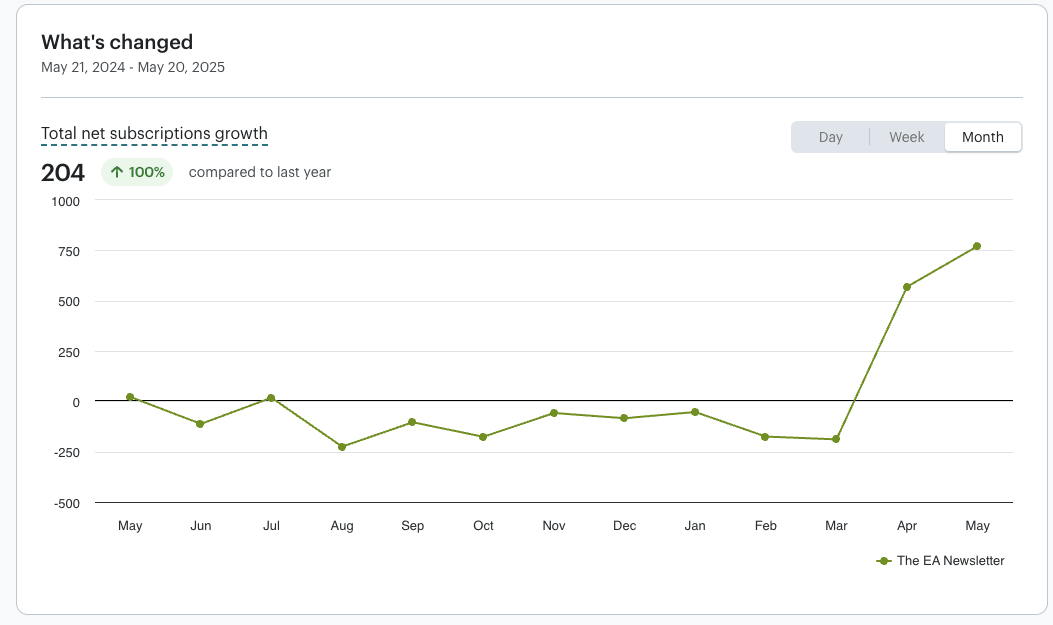
But we are still short of where we could be if we fully made use of CEA’s existing infrastructure. For example:
- The conversion rates (page visit -> subscribe) on EA.org (0.7%) and CEA.org (0.38%) could be optimised and A/B tested to be higher. I don’t have evidence for this — we just haven’t tried.
- We could replicate the success of the VP opt-in on other CEA projects, for example:
- The EA Forum sign-up flow (we started doing this on April 28)
- EAG and EAGx application forms
- Groups — groups have touchpoints with a bunch of people who don’t become members, but might take impactful actions if they are subject to a slow drip of info and opportunities from the newsletter. Signing people up to the EA newsletter when they sign up to an event at a university or city group could be killer.
Also, it's worth noting that it's too soon to tell whether this is a real slam dunk. The new audience seems to open our intro campaign at about half the previous rate (30% open rate rather than 60%), and we'd need to change the sign-up process back if it leads to higher abuse rates (people signing up so easily they think the newsletter is spam), or bot attacks (we already had one, which was resolved, and now we have added captchas which has so far 🤞 worked).
Understanding our audience
We have two ways to understand our audience — mailchimp “data” and surveys. I write data in scare quotes because mailchimp demographics data is a guess, and I’ve anecdotally seen it get things wrong.
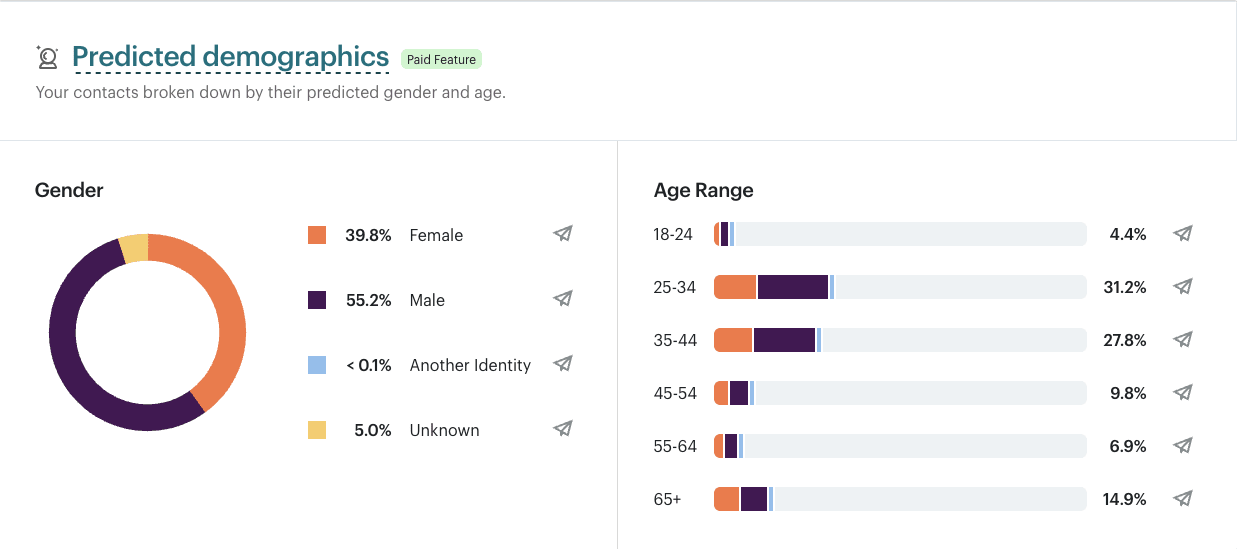
Mailchimp demographics
Caveat caveat according to mailchimp, but:
- The largest age demographic is 25-34.
- More men read the newsletter than women.
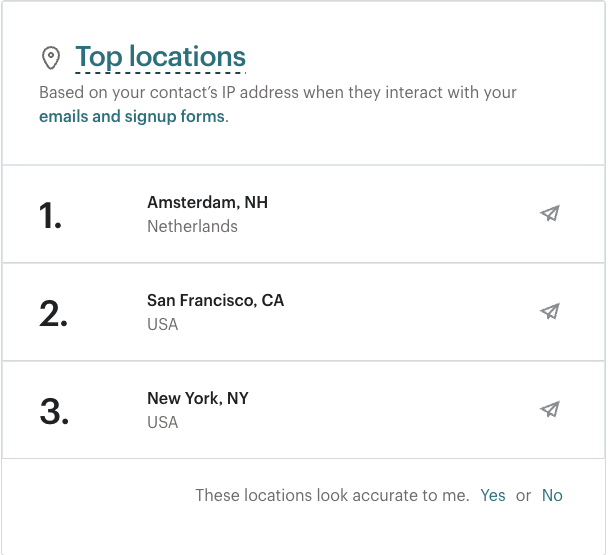
Mailchimp location data is not worth mentioning — it seems very off.
Impact survey
The Impact survey is the newsletter’s longest-running feedback survey, active since 2018. As such, it gives a better impression of some demographics than anything else we have.
Note that the CTA in the newsletter for much of this time has been “If you’ve taken action because of the Newsletter and haven’t taken our impact survey, please do — it helps us improve future editions.”, so it is selected for people who have found the newsletter useful.
In some other important ways, the data from this survey won’t be representative. Obviously, we can’t scale up the distribution of actions taken to cover the whole audience, but we should also be somewhat sceptical of the industry breakdowns — we might reasonably expect more students because students have easier actions to take than professionals.
What actions have you taken directly because of clicking a link in the newsletter?
The below table shows the total number of responses containing each action type (note that many responses contained more than one action).
| Action Type | Total Count |
| Applied to a new job, internship, or research position | 80 |
| Applied to EA Global, EAGx, or another event organized by an EA nonprofit | 60 |
| Attended an event or meeting organized by an EA community group | 50 |
| Donated to an EA-aligned charity (unrelated to Giving What We Can) | 109 |
| Taken the Giving What We Can pledge or signed up for Try Giving | 51 |
| Other (explain below) | 128 |
| Overall Total | 333 |
This doesn't accurately show the total actions taken by the newsletter audience (it massively low-balls it) because most of the responses to this form occurred in just three months over the past 7 years, when the survey was highlighted in the newsletter. To get a better impression of actions taken, I plan to 1) estimate actions taken based on an extrapolation of this table 2) estimate actions based on clicks in the newsletter, and 3) compare the two to triangulate[2] a better estimate.
How important is the Newsletter vs other ways you get information?
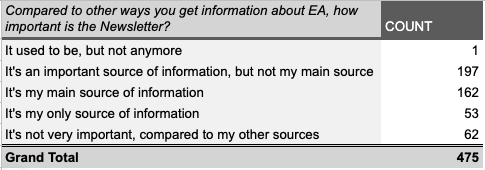
I’m surprised by the proportion for whom the newsletter is the main form of information about effective altruism, but perhaps I should expect this survey to show a higher proportion in that camp because it is selected for people who count the newsletter as the cause of their having taken action. If you see a job in the newsletter, then later on twitter or the forum, you won’t be as likely to say the newsletter was responsible.
The industry respondents work in
Industry breakdown from impact survey (Summarised by Claude):
| Industry | Count | Percentage |
| Academia/Research | 91 | 19.2% |
| Student | 79 | 16.6% |
| Tech/Software | 65 | 13.7% |
| Finance/Business | 41 | 8.6% |
| Nonprofit/NGO | 24 | 5.1% |
| Retired | 20 | 4.2% |
| Healthcare | 18 | 3.8% |
| Government/Policy | 17 | 3.6% |
| Education | 10 | 2.1% |
| Arts/Media | 6 | 1.3% |
| Other | 104 | 21.9% |
Again, this is likely biased by the fact that the user has taken action. However, it is still interesting that the audience is predominantly academic in some way — the student part of the demographic is undoubtedly large (and some of those listed as academics may be grad students).
Where respondents live
From the impact survey, according to Claude.
| Europe | 49.5% |
| North America | 39.2% |
| Oceania | 4.7% |
| Asia | 3.8% |
| South America | 2.8% |
This seems more accurate than Mailchimp’s estimations (which claim Amsterdam is our top city for readers).
Where next?
Based on analysis of where we are at, my goals over the next 6 weeks are to:
- Work with other teams at CEA to integrate newsletter sign-ups into their projects (and, if it isn’t already, make the newsletter more integrated with their goals).
- Be more decisive about who our target audience should be.
- Work with someone (keeping this vague because I'm speaking to people currently) to run ads for the newsletter, reaching that target audience.
Feel free to ask more questions or suggest directions for further research into the Newsletter. This memo isn't perfectly comprehensive.
Specifically, I'm working this week on figuring out a rational Willingness To Pay per Subscriber metric (so that I can assess the price of marketing campaigns), so any suggestions there would be much appreciated.
- ^
Impact weighted clicks are a metric I'm still experimenting with, which assigns points based on a simple model where a click on a job ad = 1 point, fellowship = 0.5, Courses = 0.25 etc... It'd be ideal to have an absolute metric (i.e. a metric which could tell me how valuable the newsletter is overall), but in the mean-time, a metric which lets me compare month-to-month is valuable.
- ^
Apologies but I don't know the two-vertices word which I should be using here.
Thanks!