Around 1 month ago, I wrote a similar Forum post on the Easterlin Paradox. I decided to take it down because: 1) after useful comments, the method looked a little half-baked; 2) I got in touch with two academics – Profs. Caspar Kaiser and Andrew Oswald – and we are now working on a paper together using a related method.
That blog post actually came to the opposite conclusion, but, as mentioned, I don't think the method was fully thought through.
I'm a little more confident about this work. It essentially summarises my Undergraduate dissertation. You can read a full version here. I'm hoping to publish this somewhere, over the Summer. So all feedback is welcome.
TLDR
- Life satisfaction (LS) appears flat over time, despite massive economic growth — the “Easterlin Paradox.”
- Some argue that happiness is rising, but we’re reporting it more conservatively — a phenomenon called rescaling.
- I test this hypothesis using a large (panel) dataset by asking a simple question: has the emotional impact of life events — e.g., unemployment, new relationships — weakened over time? If happiness scales have stretched, life events should “move the needle” less now than in the past.
- That’s exactly what I find: on average, the effect of the average life event on reported happiness has fallen by around 40%.
- This result is surprisingly robust to various model specifications. It suggests rescaling is a real phenomenon, and that (under 2 strong assumptions), underlying happiness may be 60% higher than reported happiness.
- There are some interesting EA-relevant implications for the merits of material abundance, and the limits to subjective wellbeing data.
1. Background: A Happiness Paradox
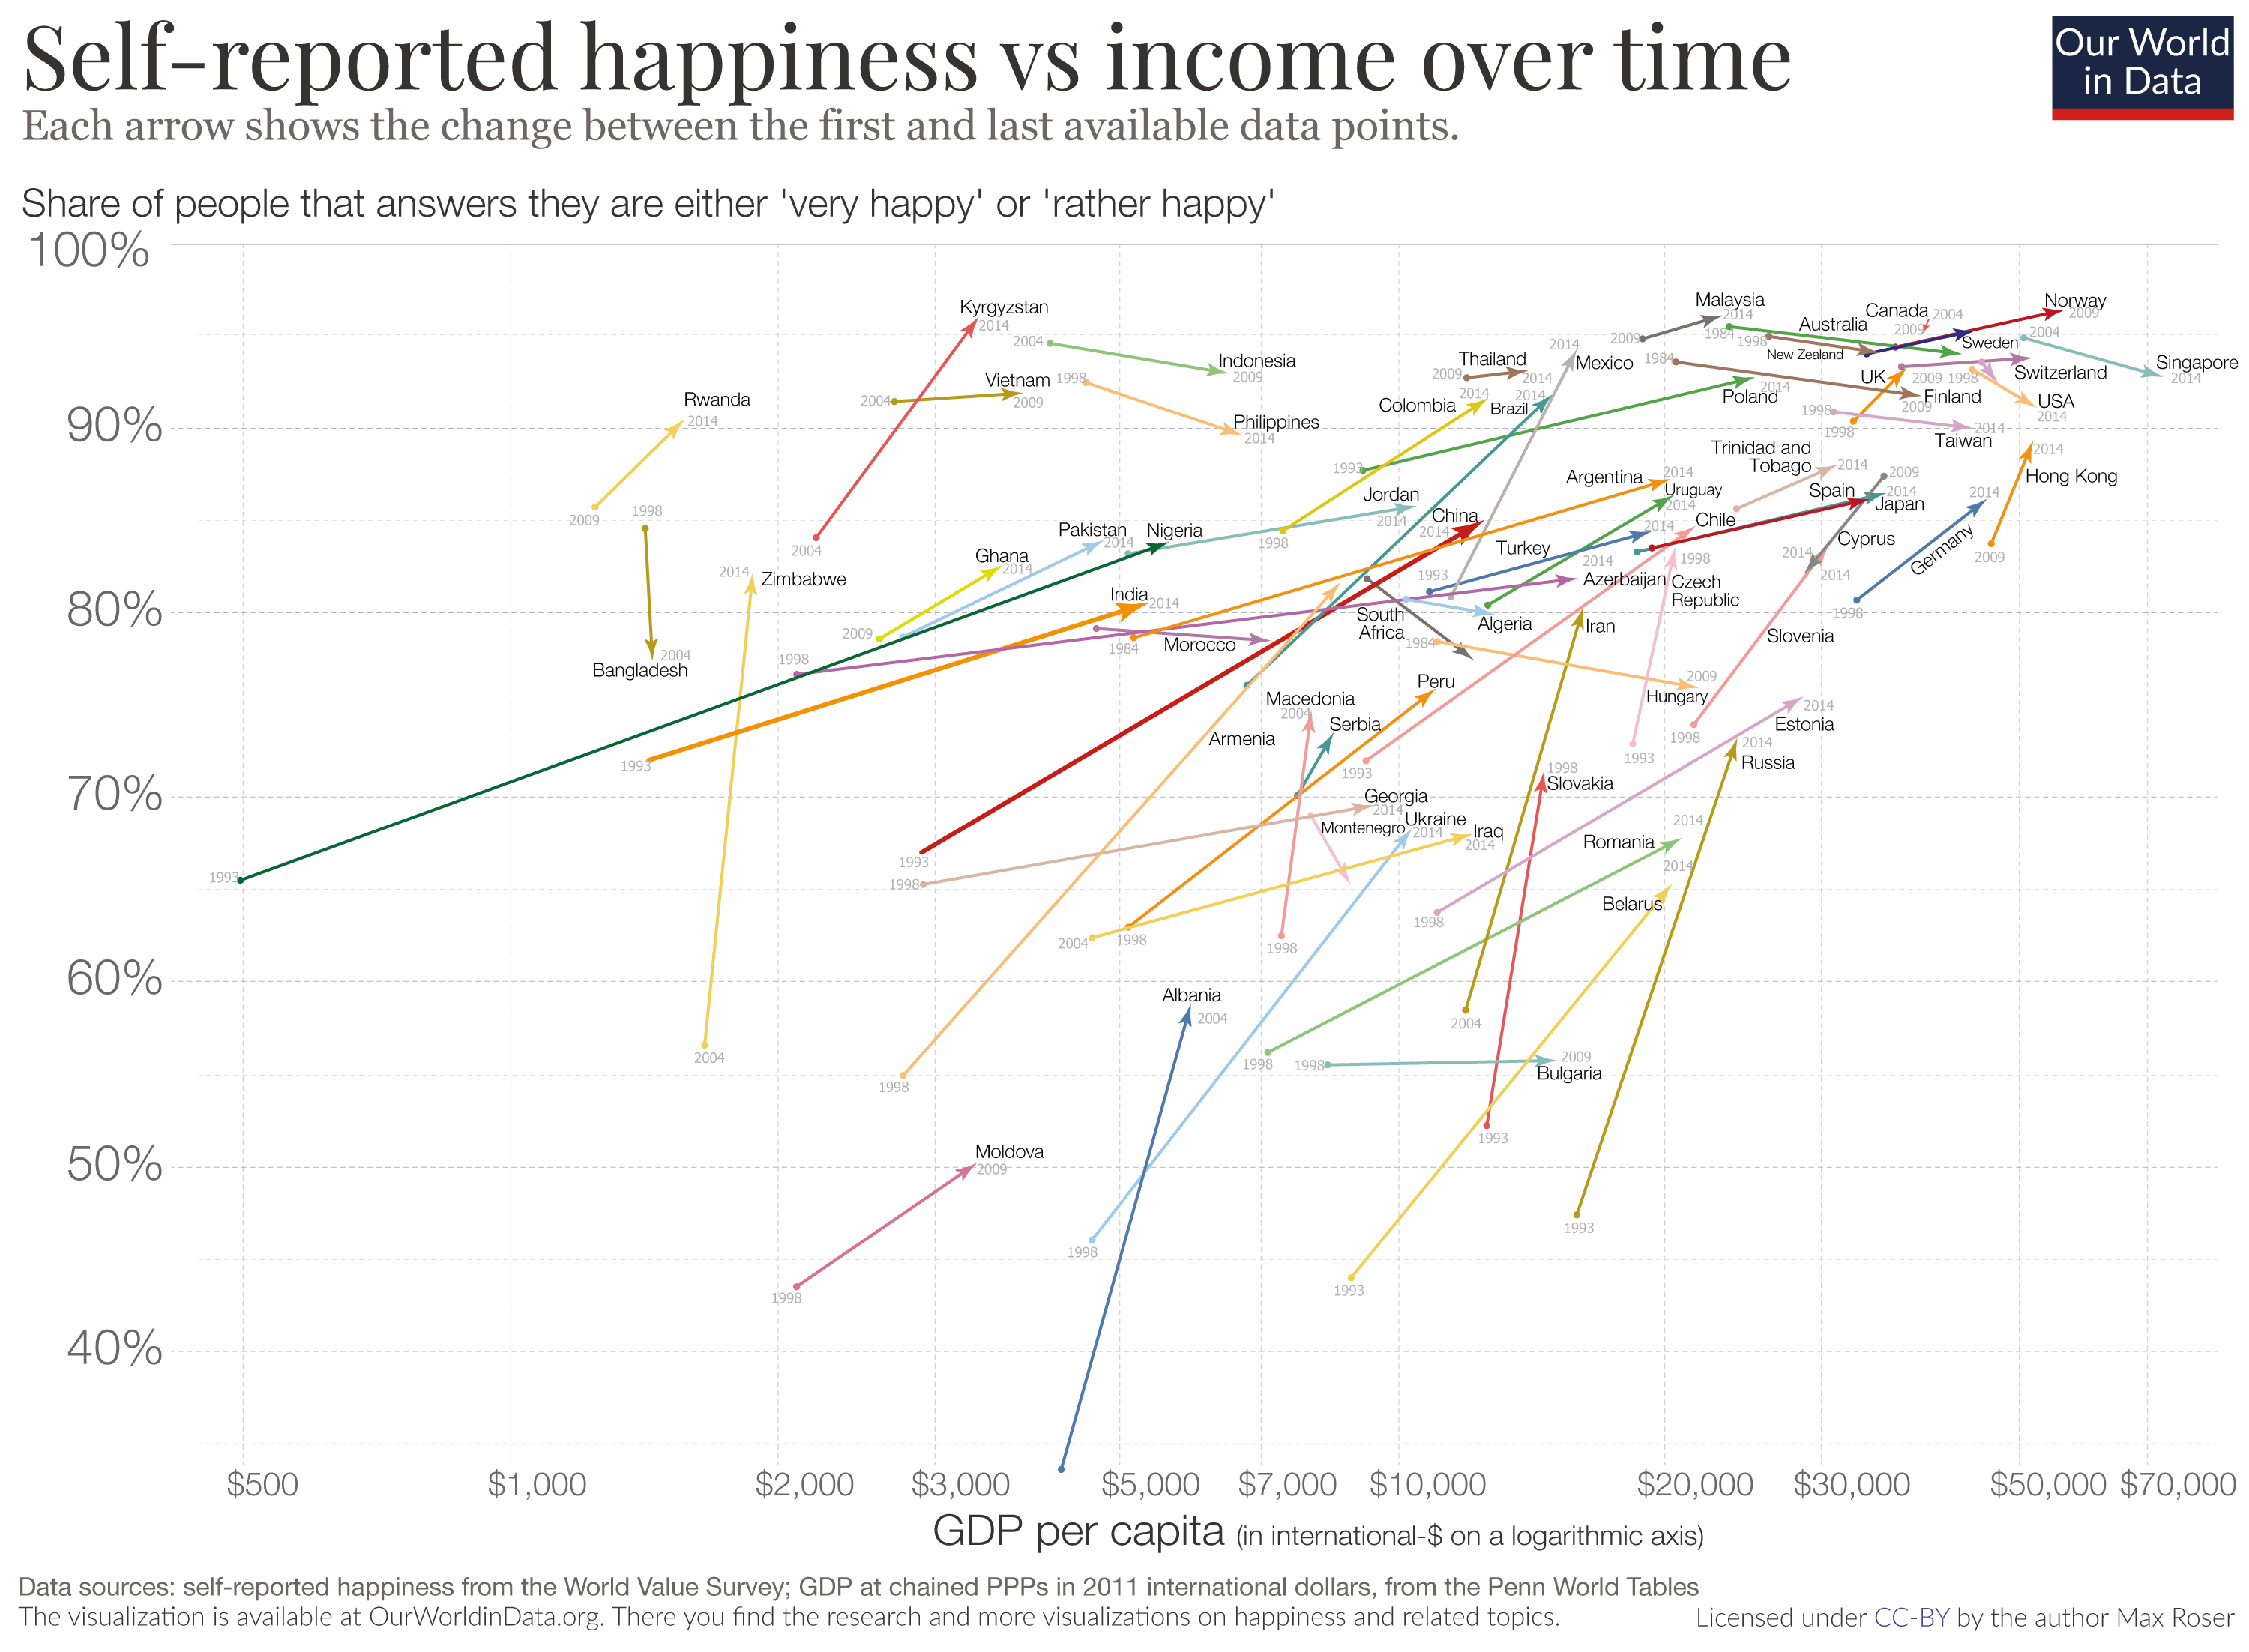
Here is a claim that I suspect most EAs would agree with: humans today live longer, richer, and healthier lives than any point in history. Yet we seem no happier for it. Self-reported life satisfaction (LS), usually measured on a 0–10 scale, has remained remarkably flat over the last few decades, even in countries like Germany, the UK, China, and India that have experienced huge GDP growth. As Michael Plant has written, the empirical evidence for this is fairly strong.
(I note this empirical literature is contested. Often it boils down to small differences – has happiness increased from a 7 to a 7.2? My results suggest these differences may be negligible, given potential rescaling effects.)
Stagnant average happiness is known as the Easterlin Paradox. It is a paradox, because at a point in time, income is strongly linked to happiness, as I've written on the forum before. This should feel uncomfortable for anyone who believes that economic progress should make lives better — including (me) and others in the EA/Progress Studies worlds.
Assuming we agree that self-reported happiness is (close to) flat, there are a few potential explanations:
- Hedonic adaptation: as life gets better, our expectations rise just as fast — so we don’t feel happier.
- Social comparison: we care about relative, not absolute, gains.
- Rescaling: maybe happiness is increasing, but the 0–10 reporting scale has shifted or stretched.
It’s that third one — rescaling — that I try to empirically test here.
2. What is “Rescaling”?
(AKA: 'scale norming', 'scale shifts')
The rescaling hypothesis suggests that the reporting function — how we map our true wellbeing onto a 0–10 scale — changes over time. You can think of the reporting function like a ruler, converting underlying happiness to reported Life Satisfaction. Suppose two people, one from 1990 and another from 2020, both report their Life Satisfaction (LS) = 8/10. The second person could be happier, if their reporting function (i.e., their ruler) has either shifted or stretched upwards.
The method proposed below only identifies stretches in the happiness ruler: when the quality of the average "10/10" life improves, but a "0/10" life stays roughly the same in underlying happiness terms.
Here's a visual illustration of how this could bias national happiness data:
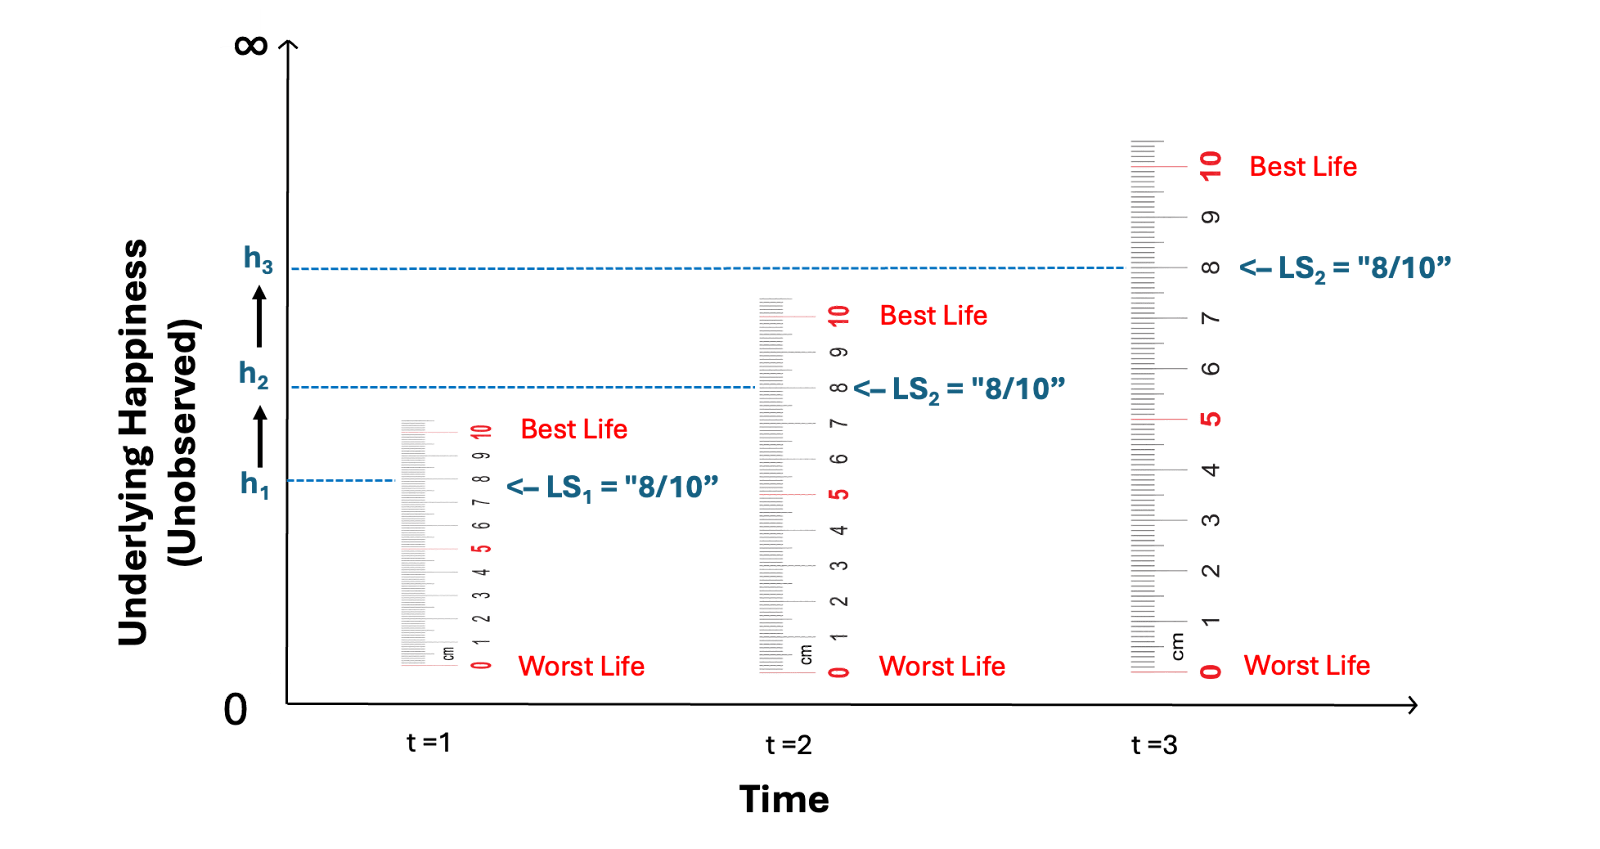
If the LS scale is stretching upwards, we could see constant self-reported LS, alongside improving underlying happiness.
There’s very little work testing this directly: probably less than 10 papers, and only 1 relating to the Easterlin Paradox (Prati & Senik, 2025). They use a memory-based approach: ask people how happy they used to be and compare to what they said at the time. If I said “7/10” in 2010, but remember it as “6/10” in 2015, that suggests my internal scale has changed. Using this method, Prati & Senik estimate that happiness in the U.S. might be underreported by 80–140% (!).
This method – using recalled happiness to adjust for rescaling – was discussed on the EAF recently. It runs into two issue: 1) what if we misremember our happiness in the past? 2) what if we correctly remember our previous happiness, but underreport this due to motivated reasoning/social desirability (not rescaling)?
Using memories to demonstrate rescaling is interesting, but I think we need more literature to be confident that rescaling is a real problem.
3. My Approach: Life Events would look smaller on stretched out rulers
I propose a new way to test for rescaling: track how people respond to major life events over time. The logic is simple. If happiness scales are stretching, the same event (say, unemployment) should appear to have a smaller emotional impact in later years. A way of conceptualising this is:
- If a ruler has been stretched out, if we were to measure a given object, it would look artificially smaller.
The picture below illustrates this:
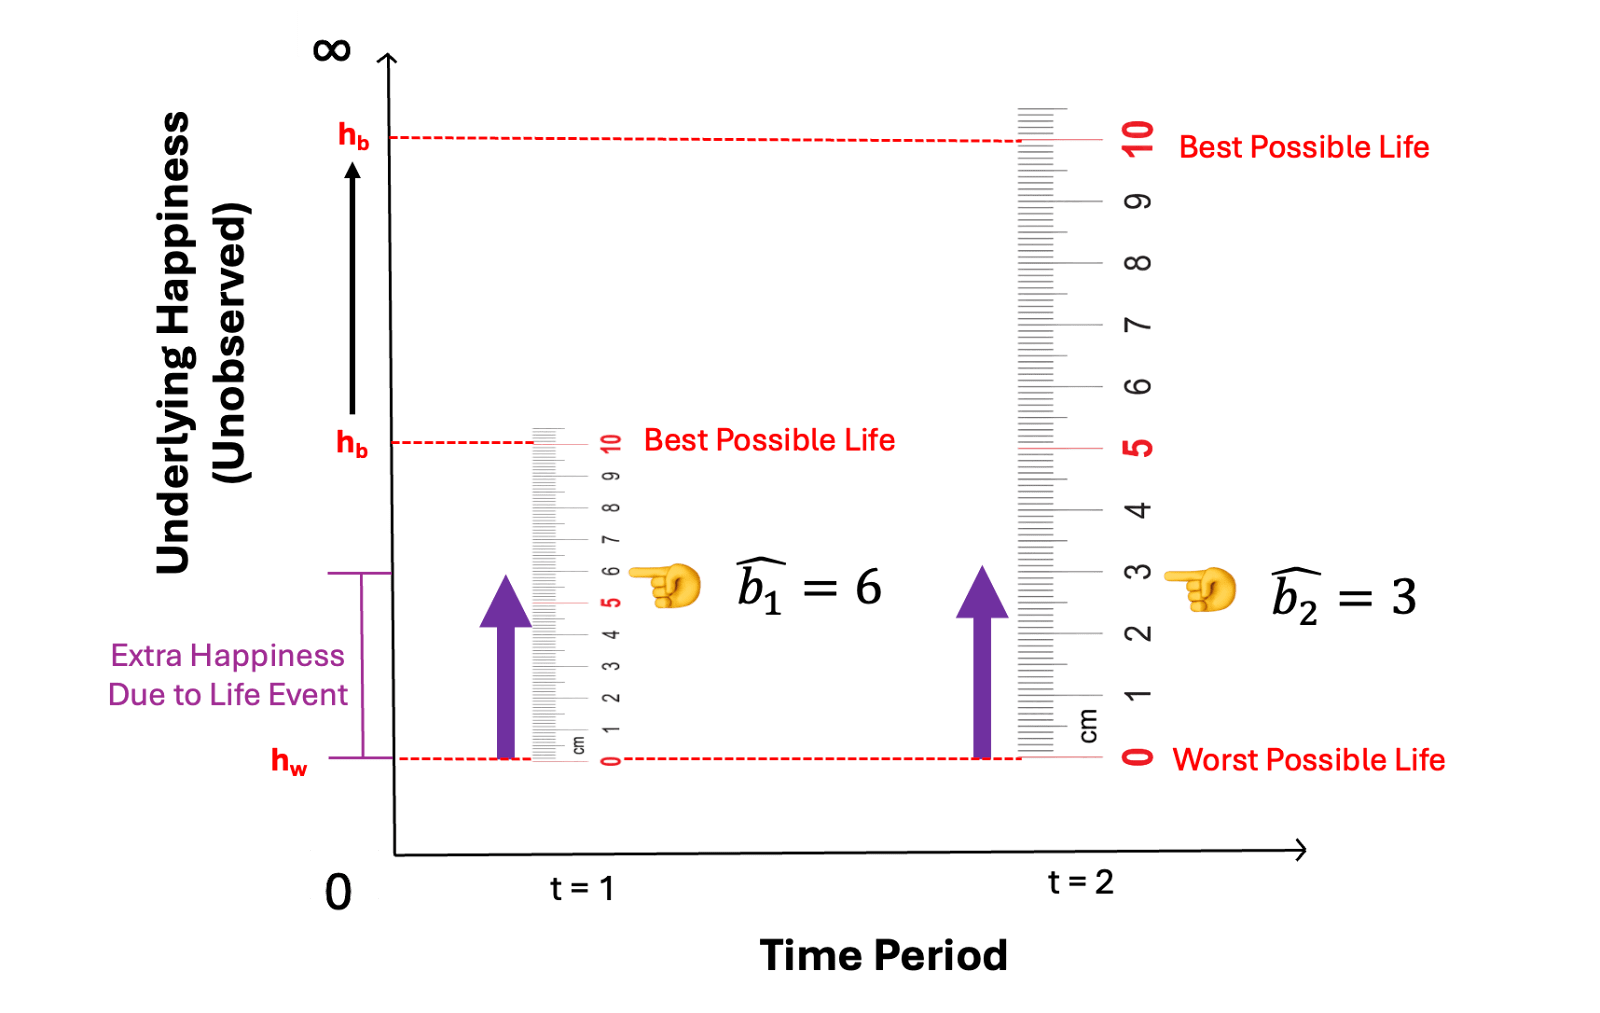
This has the assumption that life events should correspond to a similar amount of underlying happiness over time. (Later, I attempt to control for structural reasons why this might change.)
Using the German SOEP panel (1991–2022, ~650k observations), I focus on six major life events: four negative (partner’s death, death of a parent, unemployment, separation) and two positive (new relationship, cohabitation). I selected these from a candidate list of 13 events, based on data availability and whether the reported effects were unambiguous in every period.
Then, I looked at the relationship between whether a life event occured in the previous year, and the change in an individual's reported LS (taking the difference accounts for unobserved things about each person).
4. Results: Effects Are Shrinking
The absolute effects of 3 life events (unemployment, cohabitation, death of parent) were converging to zero, but for the remaining 3 events (death of partner, separation, new partner) the effects were relatively stable. This constitutes some non-definitive evidence for rescaling – which would predict, all else equal, attenuation for all events.
However, first, some events had much smaller standard errors than others; and second, detecting attenuation is pretty hard for such small effect sizes (typically 0.2-0.5 on an 11 point scale!). To smooth out noise, I conducted a meta-average: setting all effect sizes to 1 in the first period, and giving more weight to events with smaller standard errors (i.e., estimates were are more certain about: this is because, for example, unemployment is more common than bereavement).
The meta-analysis indicated that the average effect of a life event had fallen by ~40% over three decades (1991-2022). The average effect of a life event is monotonically converging towards zero. Interesting.
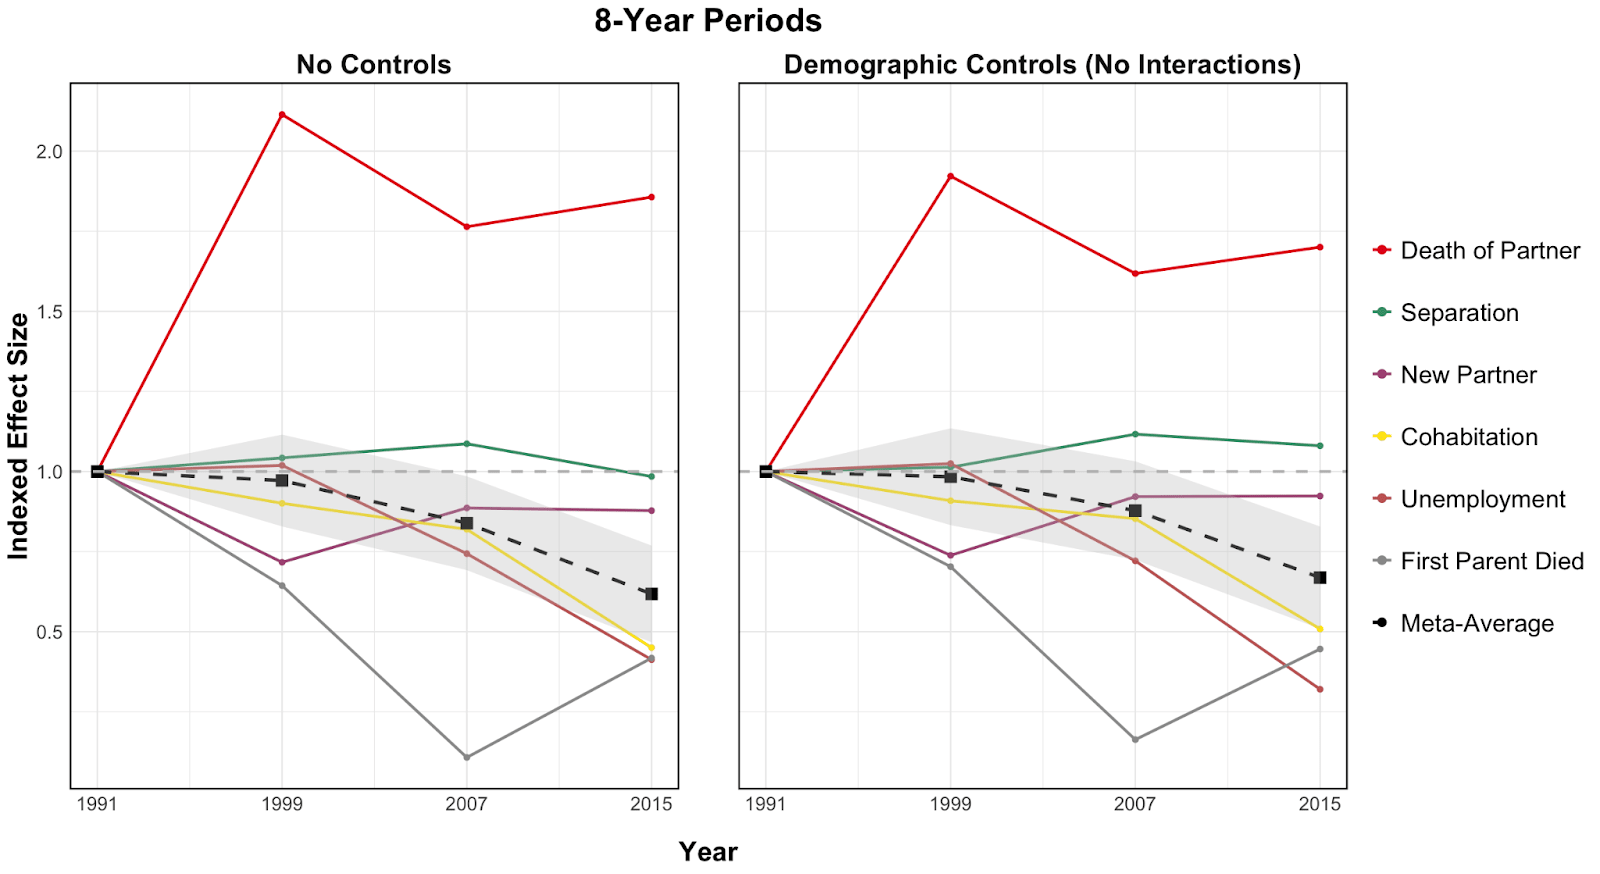
In the paper I attempt to show this result is robust to a bunch of different specifications. If you look at the Google Doc linked above, you'll see a lot of graphs like the one shown above – with the average effect of a life event trending towards zero. This occurs regardless of:
- Whether we control for demographic factors (e.g., changes in education, age, gender make-up in the population) which affect happiness
- Whether we allow the effect of life events to vary by age or the prevailing frequency of life events in the population
- Whether we look at all occurrences of life events, or just the first instance (e.g., your first time being unemployed, or any time)
- Whether we look at change over the course of four 8-year periods (or 2 x 15-years, 6 x 5-years, or 10 x 3-years).
If we assume the real psychological impact of these events has been roughly constant, then the reporting scale must have stretched. In other words, there is decent evidence that rescaling is occurring.
5. How much might we be underestimating life satisfaction?
Here, I make 2 assumptions:
- The underlying effect of life events is exactly the same
- The happiness of the average "0/10" life has remained exactly the same
Both are strong, difficult to verify assumptions. Briefly – on 1), I can't think of a good psychological theory why the true effects should be falling, after accounting for the variables mentioned above. If you can think of one, I'd love to know. On 2), I note, happiness researchers tacitly make this assumption anyway! Violations of either assumption could mean that my BOTEC adjustment is a over- or under-correction for rescaling.
(I also assume that the reporting function is linear/evenly spaced. There is decent evidence for this in the literature).
By assumption 1): if the effect of life events has fallen by 40%, we know that the happiness scale might have stretched by a factor of 1/0.6 ≈ 60%
By assumption 2): we can adjust for rescaling by multiplying average reported happiness by 1.6.
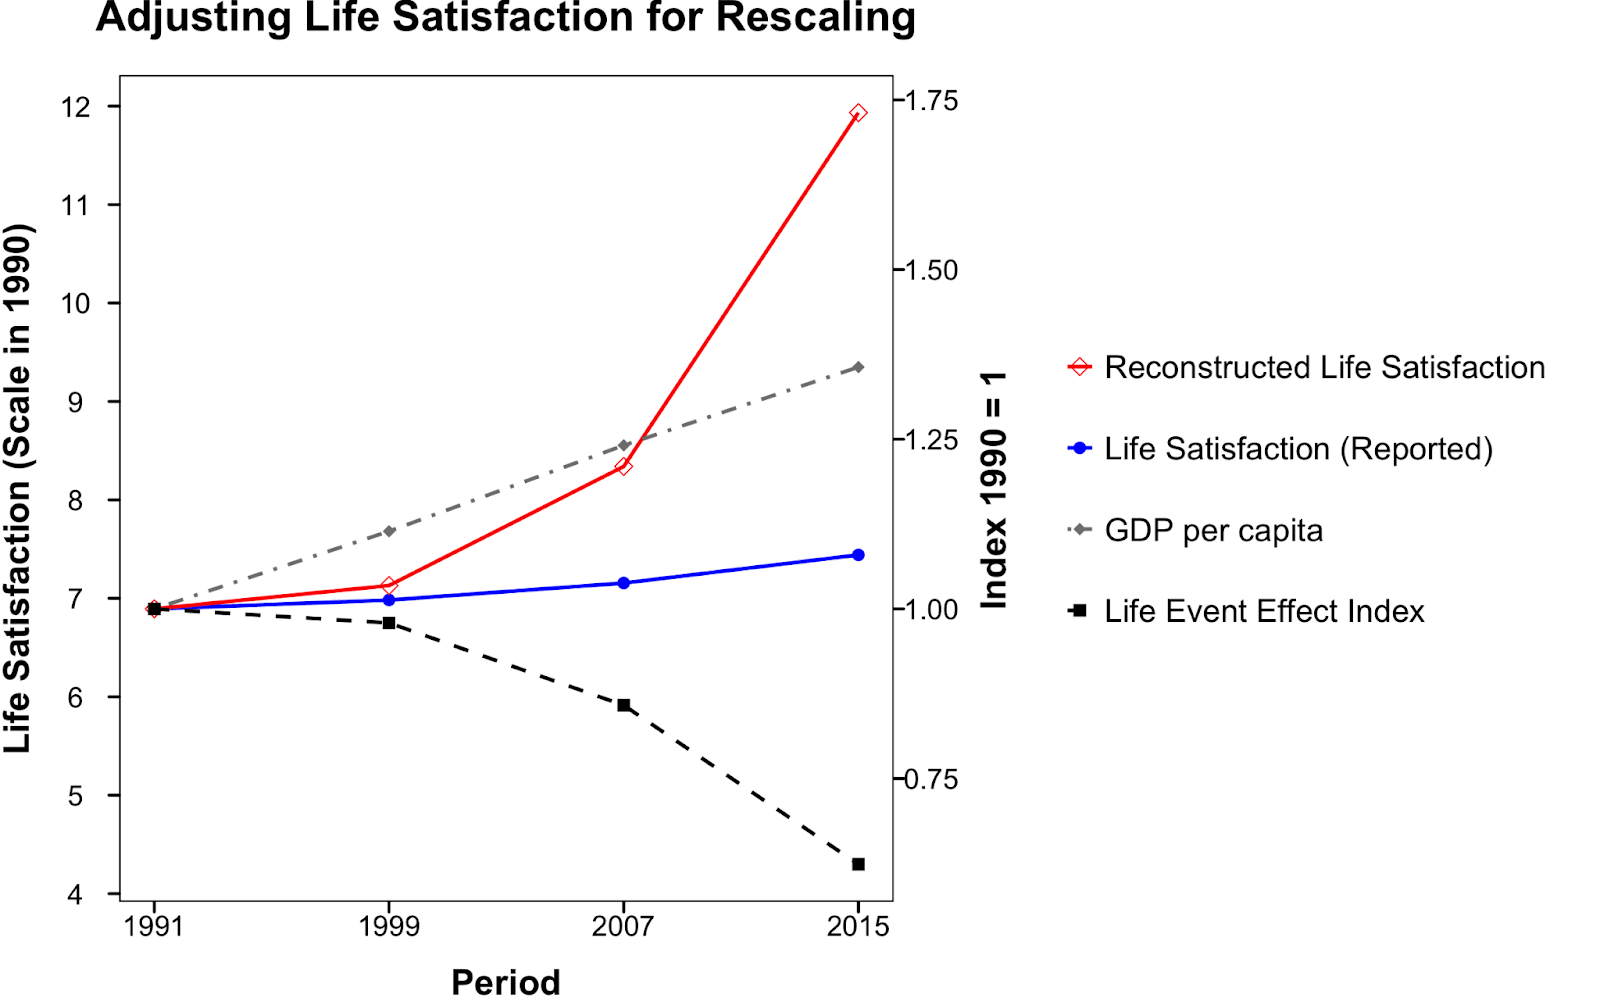
I do this process for every period, and plot adjusted LS alongside reported LS and GDP (and the meta-average index). Interesting, I arrive at a fairly ball-park number, of how much happiness might be underestimated (60%) to Prati & Senik (80-140%).
This offers a possible explanation for the Easterlin Paradox: maybe people are getting happier — actually quite a lot happier – but, our reporting standards have changed.
6. Implications
I feel like there are two main implications of this. But before I discuss them, I'd like to say: the upshot here is still tentative.
I think the evidence that rescaling is happening is decent. However, we're working with pretty uncertain priors here, given there is so little literature on rescaling. The evidence that people are much happier than in the past – even more tentative. Though, to suggest that average national happiness has remained the same, we'd need to suggest that a lot of downward shifting has occurred (the quality of a "0/10" life has worsened a lot). This is possible, but strikes me as unlikely at the moment, given the literature on rescaling assumes that shifts occur upwards (the quality of a "10/10" life has, if anything, improved).
Two implications of this work:
1) GDP might be much better for human happiness than we previously thought
I note, GDP growth could still be, on net, bad (or very bad), given its effects on animals (and/or x-risk).
2) There might be a large amount of bias in nominal LS data.
I don't know yet, how rescaling might bias happiness-based cost-effectiveness work. I'd presume it could matter quite a lot. My method is much too coarse to calibrate nominal happiness for a given person or even for a given country within a particular year, so would not help. Alternative methods for adjusting for rescaling – e.g., memory – have their own problems (see Section 2).
More work here might be interesting. Please message me if you'd like to chat about this stuff more, or if you'd like my code.
Charlie
Hello there,
There's lots of points here. While they are possible, I would suggest they are not particularly common/well-suported in the psychological literature as it is today.
In addition, I don't know why these explanations would lead to desensitisation towards positive and negative events.