Thanks for sharing - I think that the idea of making GiveWell's CEAs more interactive and approachable is fantastic. Right now, I think many of us implicitly trust GiveWell's transparent process and the mighty individuals who are willing to engage in depth and red-team critical CEAs. However, I do believe that in order for cost-effectiveness to become a norm in the philanthropic sector, approachability is critical.
Would you be open to piloting an extension of this approach with other organisations and interventions that may not be on GiveWell's top recommended list but for whom they have prepared rigorous CEAs. I lead an organisation called Fortify Health that falls into this category and would love to see if there is a way we may be able to collaborate on an extension of this methodology and tool?
Thanks Tony! I built this as a side project with a fairly narrow scope — replicating the current GiveWell CEA specifically — so I'm not planning to extend it to other organizations myself. That said, the repo is open source and the model structure is modular, so if you or someone on your team wanted to add Fortify Health as a new charity module, I'd welcome a PR. Each charity is a self-contained TypeScript function, so adding one shouldn't require changes to the rest of the codebase.
Want to flag that we are doing exactly as you suggested, and I hope to provide a new PR shortly. We believe that communicating our cost effectiveness using a tool like this will make the currently quite cumbersome spreadsheet come to life.
Having worked in northern Nigeria, one thing that stood out to me is how dynamic those counterfactuals can be in practice. For example, in Sokoto and Zamfara, DHS coverage numbers capture the endpoint, but underneath that you have shifting factors like outreach consistency, staffing, supply reliability and community trust. I have seen system performance change meaningfully over relatively short periods in ways that would materially affect those parameters.
It also made me think about places like Kenya and Mozambique that are highlighted as “best” countries in your table. Even within the same country, conditions can vary enormously across regions and over time depending on implementation strength and system capacity. Those differences do not always show up immediately in the underlying data, but they can have real implications for how stable those cost effectiveness estimates are.
Curious how you think about parameter stability over time in settings where the system itself is evolving. The model makes the tradeoffs legible, but the inputs themselves can be moving targets.
Thanks Benita, really appreciate the field perspective. You're right that the parameters are a snapshot — the tool takes GiveWell's November 2025 spreadsheet values as given and doesn't attempt to model how they change over time. GiveWell updates their spreadsheets periodically as they get new data, and the tool would need to be re-extracted to reflect that.
On within-country variation, this is a real limitation. The model treats each country as a single unit with one set of parameters, but as you note, conditions in Sokoto vs. other parts of Nigeria can be very different. The sensitivity analysis helps show how much the result depends on any single parameter (like counterfactual coverage), but it doesn't capture the kind of correlated shifts you're describing where multiple parameters move together as systems evolve.
I built this as a side project to make GiveWell's existing estimates more explorable, not to improve on their parameter estimation — that's solidly their domain expertise. But the tool does make it easy to test "what if coverage in Zamfara drops by 10%" type questions, which I think is part of what you're getting at.
That makes sense, and I think the tool does a great job of making those tradeoffs legible.
One thing I’ve found is that spending time in these settings can change how you think about some of the parameters, especially around counterfactuals and how multiple constraints interact in practice. Certain assumptions that look independent in a model often move together on the ground.
It would be interesting to see how that kind of correlated variation could be explored more systematically over time.
Model covariance in cost-effectiveness analyses is a good call-out, and I don't know of anything that's been shared on the EA forum, although apparently in health economics this is a solved problem so there's an angle of attack there for anyone reading this who's keen to give it a try. Quoting froolow:
... you'll be pleased to know that this is basically a solved problem in Health Economics which I just skimmed over in the interests of time. The 'textbook' method of solving the problem is to use a 'Cholesky Decomposition' on the covariance matrix and sample from that. In recent years I've also started experimenting with microsimulating the underlying process which generates the correlated results, with some mixed success (but it is cool when it works!).
Practitioner input, e.g. from folks like you who've noticed this and have a sense of how much assumptions move together, would be needed to quantify the model covariance so it jives with what's being seen.
That’s really interesting, Mo. Appreciate you sharing! The Cholesky approach definitely makes sense conceptually.
From a practitioner perspective, the correlations tend to come from fairly intuitive system dynamics rather than anything formal. So in Northern Nigeria, when outreach improved, you would often see several things move together. Coverage would go up, dropout rates would fall and supply chains would stabilise as demand became more predictable. The opposite would happen when systems were under strain. Staffing gaps, stockouts and lower uptake would start reinforcing each other quite quickly.
The tricky part is that those shifts are often uneven and very context specific. Translating them into a stable covariance structure is not straightforward. But I agree there’s probably a useful bridge here between how these dynamics play out operationally and how they could be reflected in models.
noticed one bug: when you click "reset to defaults" it resets the country choice, not just parameter values (unexpected to me) but more importantly it keeps the UI pointed to the country you chose. Below, Nigeria is highlighted but the parameter values were reset to Chad's defaults.
Thanks, good catch! This is now fixed — "Reset to defaults" clears the country selection and collapses the expanded panel, so the UI no longer shows a stale highlight. Should be live now.
Thanks Vasco! Yes, I shared an earlier version with Brendan Phillips and Calum Best at GiveWell before posting. Brendan's feedback helped me catch some parameter mismatches, which I fixed by updating to the November 2025 spreadsheets. I've added an acknowledgment to the post.
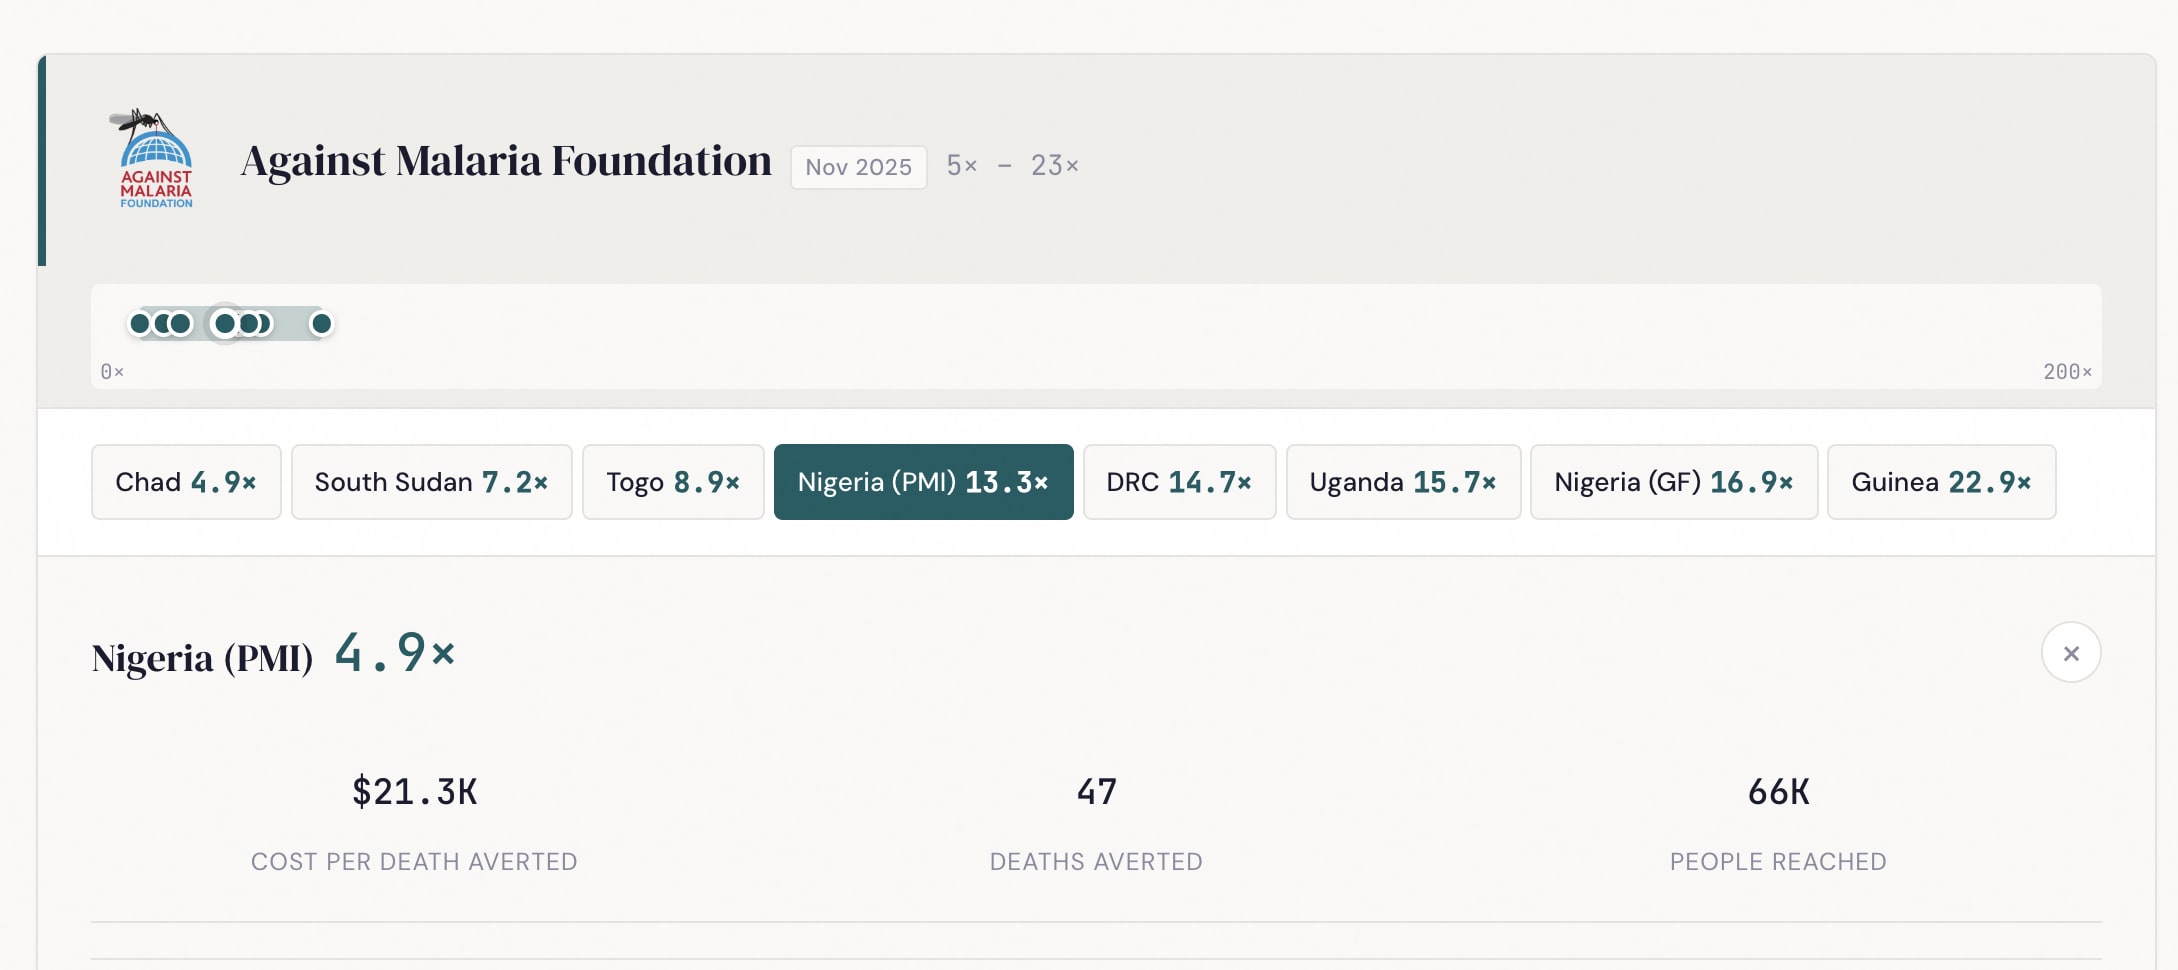
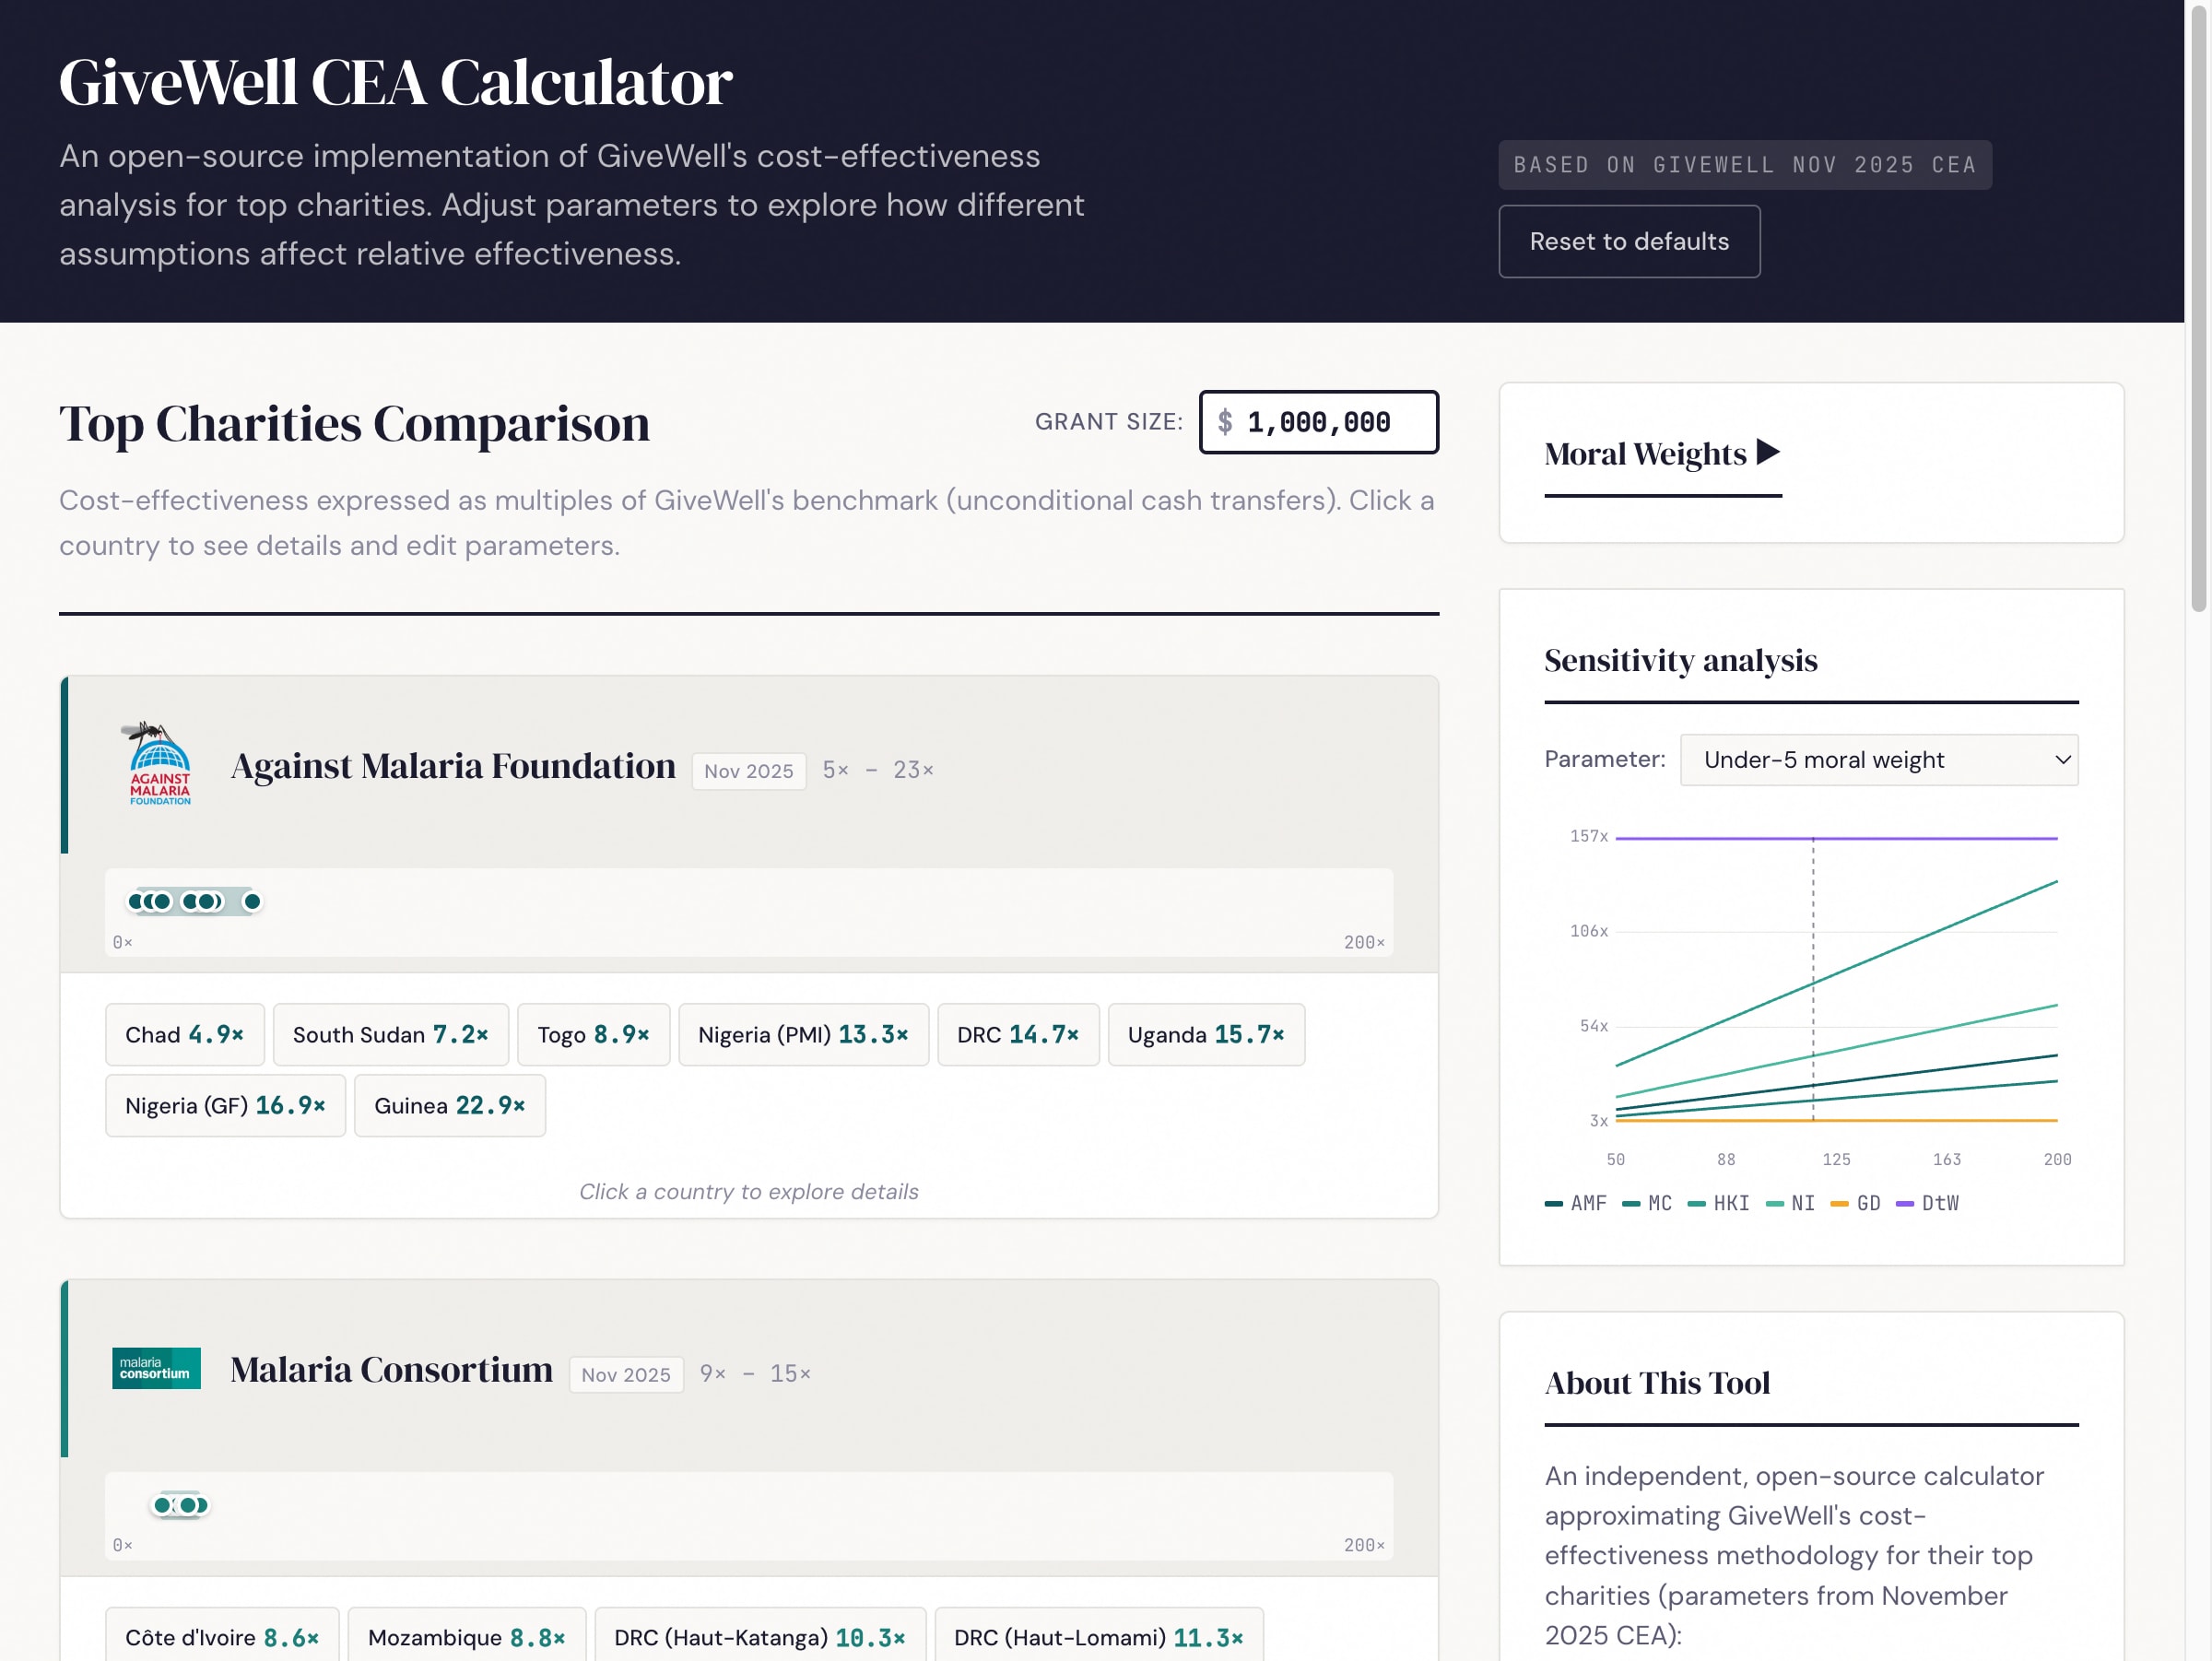
I re-implemented GiveWell's cost-effectiveness models for all six top charities as an open-source web tool: maxghenis.com/givewell-cea
The tool lets you edit any parameter and immediately see the effect on charity rankings.
Motivation
Others have done excellent work examining specific parts of GiveWell's CEA — Froolow's critical review of model architecture, Nolan, Rokebrand, and Rao's uncertainty quantification, and several pieces on deworming and AMF uncertainty. But I couldn't find a tool that implements all six charities together and makes it easy to compare them while adjusting assumptions.
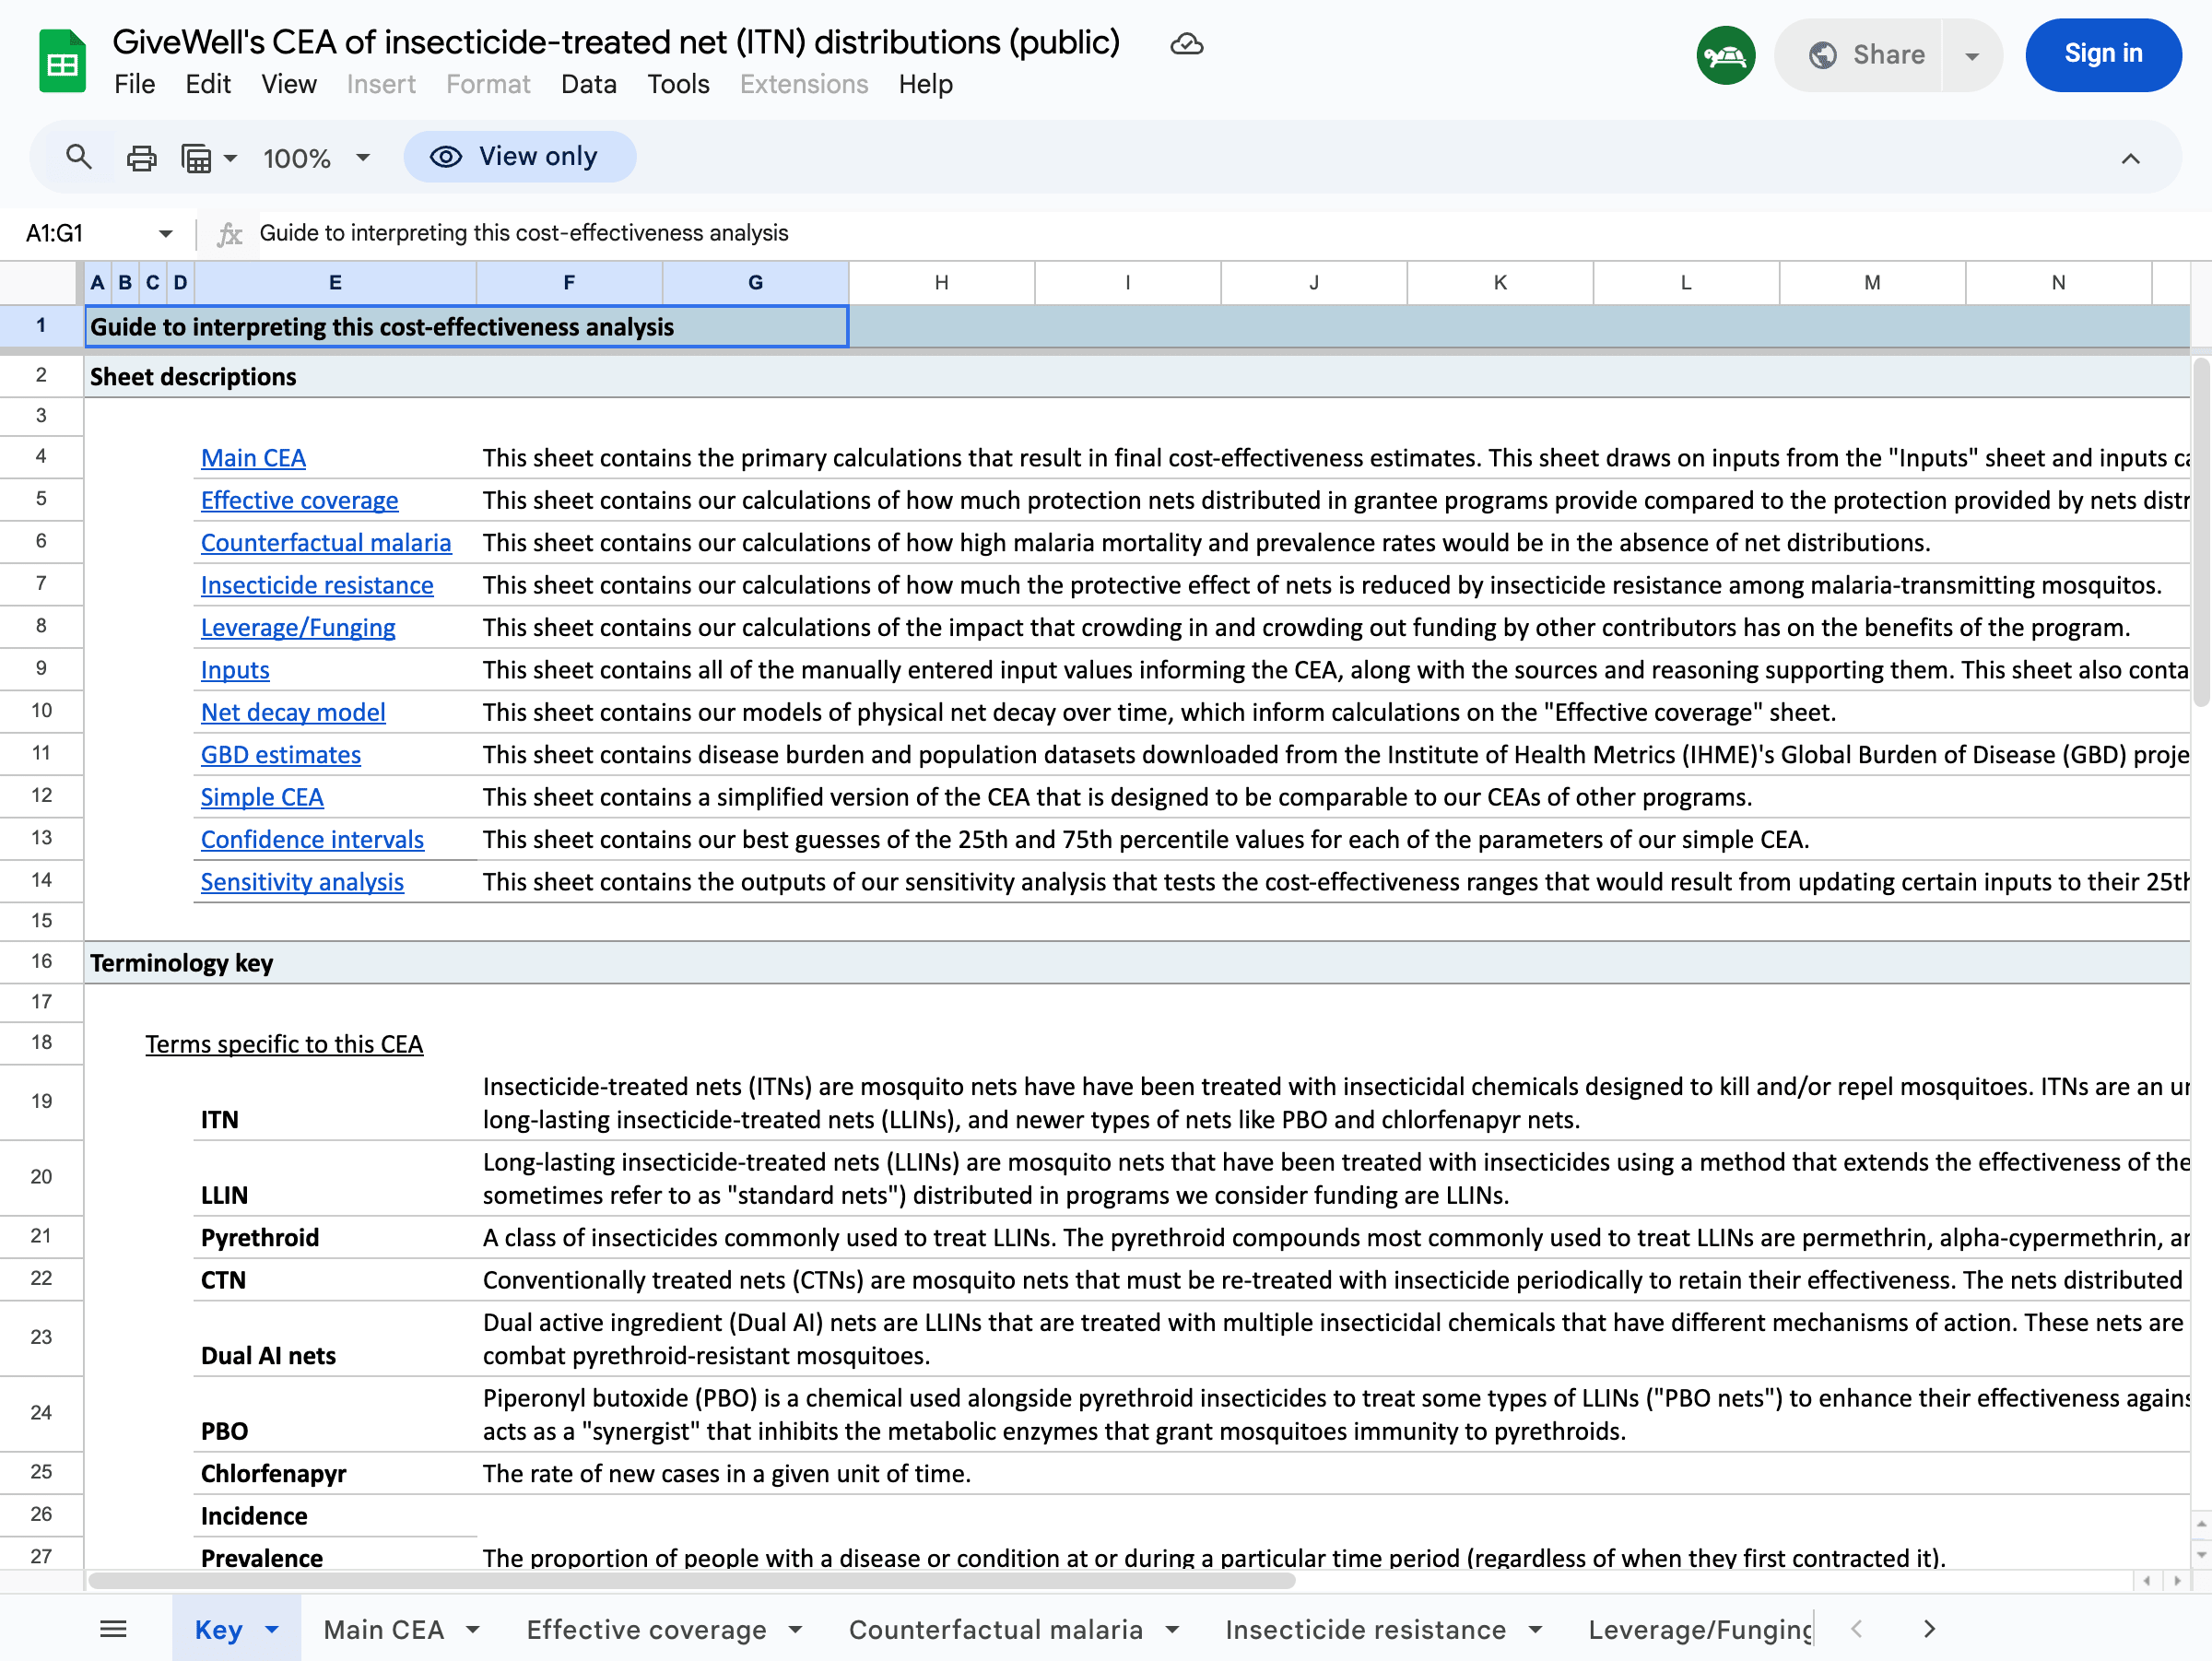
GiveWell's spreadsheets are powerful but hard to explore casually. Each charity has its own multi-tab workbook with dozens of sheets, specialized terminology, and cross-references between cells:
Changing a moral weight means editing cells across multiple sheets and comparing results manually. I wanted something where you could adjust one slider and immediately see how all six charities re-rank.
What the model covers
For each charity I implemented the core pipeline from GiveWell's spreadsheets:
People reached: Grant size / cost per person reached
AMF and Malaria Consortium: Under-5 mortality reduction, with separate pathways for older age mortality and developmental effects
Helen Keller International: VAS effect on under-5 mortality
New Incentives: Cash incentives increase vaccination rates; the model converts incremental vaccinations to deaths averted using vaccine-specific effect sizes
GiveDirectly: The model values consumption increases directly (no mortality pathway)
Deworm the World: The model values long-run earnings effects of deworming via ln(consumption)
All 51 charity/country combinations operate independently — each country has its own cost per person, mortality rate, adjustment factors, etc.
Observations from the replication
The benchmarks aren't on the same scale. GiveWell expresses each charity's cost-effectiveness as a multiple of GiveDirectly cash transfers. The denominator — how many "units of value" (GiveWell's composite of moral-weight-adjusted lives saved) one dollar of cash generates — differs across spreadsheets: AMF uses 0.00333, MC and HKI use 0.00335, and GiveDirectly uses 0.003. GiveWell built different spreadsheets at different times and baked in different moral weight calibrations. They don't mechanically compare multiples across spreadsheets, but a tool that displays them side by side inherits this inconsistency.
Mortality rate definitions vary. AMF's spreadsheet has both a raw malaria mortality rate and a derived "mortality rate in the absence of nets" rate. The latter accounts for existing net coverage and is the correct input. My first extraction accidentally used the raw rates, which underestimated AMF's cost-effectiveness by roughly 2x for some countries (e.g., DRC: 0.00306 raw vs. 0.00798 in-absence-of-nets).
Counterfactual coverage drives most of the within-charity variation. Both Helen Keller and New Incentives have a proportionReachedCounterfactual parameter — what fraction of people would receive the intervention anyway, without the charity's involvement. The remaining fraction is the charity's incremental impact:
Helen Keller (VAS):
Country
Would receive VAS anyway
x benchmark
Niger
15%
79×
DRC
20%
30×
Mali
21%
17×
Madagascar
33%
12×
Guinea
18%
11×
Cameroon
23%
8×
Burkina Faso
29%
7×
Côte d'Ivoire
40%
6×
New Incentives (vaccinations, Nigerian states):
State
Would get vaccinated anyway
x benchmark
Sokoto
68.5%
39×
Zamfara
79.4%
31×
Kebbi
71.9%
29×
Bauchi
81.5%
20×
Jigawa
85.8%
18×
Katsina
81.0%
17×
Kano
83.2%
13×
Gombe
88.0%
10×
Kaduna
84.2%
9×
Counterfactual coverage correlates with cost-effectiveness but doesn't determine it alone. Niger's 85% incremental coverage is similar to Guinea's 82%, yet Niger scores 7x higher: higher mortality rate (1.4% vs 1.1%), double the VAS effect (11.1% vs 5.5%), and 70% lower cost per child.
Helen Keller's leverage/funging adjustments need careful reading. In my first pass, the funging adjustment for Burkina Faso extracted as 531.99 instead of -0.431. These values come from separate rows in the spreadsheet that are easy to confuse — a "percentage change" row vs. an "adjusted value" row.
Verification
I extracted parameters from GiveWell's November 2025 CEA spreadsheets (AMF, MC, HKI, NI). I verified 46 of the 51 charity/country final cost-effectiveness multiples against the spreadsheets (GiveDirectly excluded — see Limitations):
Charity
Countries
Max difference
Against Malaria Foundation
8
<0.001%
Malaria Consortium
8
<0.001%
Helen Keller International
8
<0.001%
New Incentives
9
0.000% (exact)
Deworm the World
13
0.000% (exact)
298 automated tests pass. The remaining <0.001% differences for AMF/MC/HKI are floating-point precision, not model discrepancies.
Interactive features
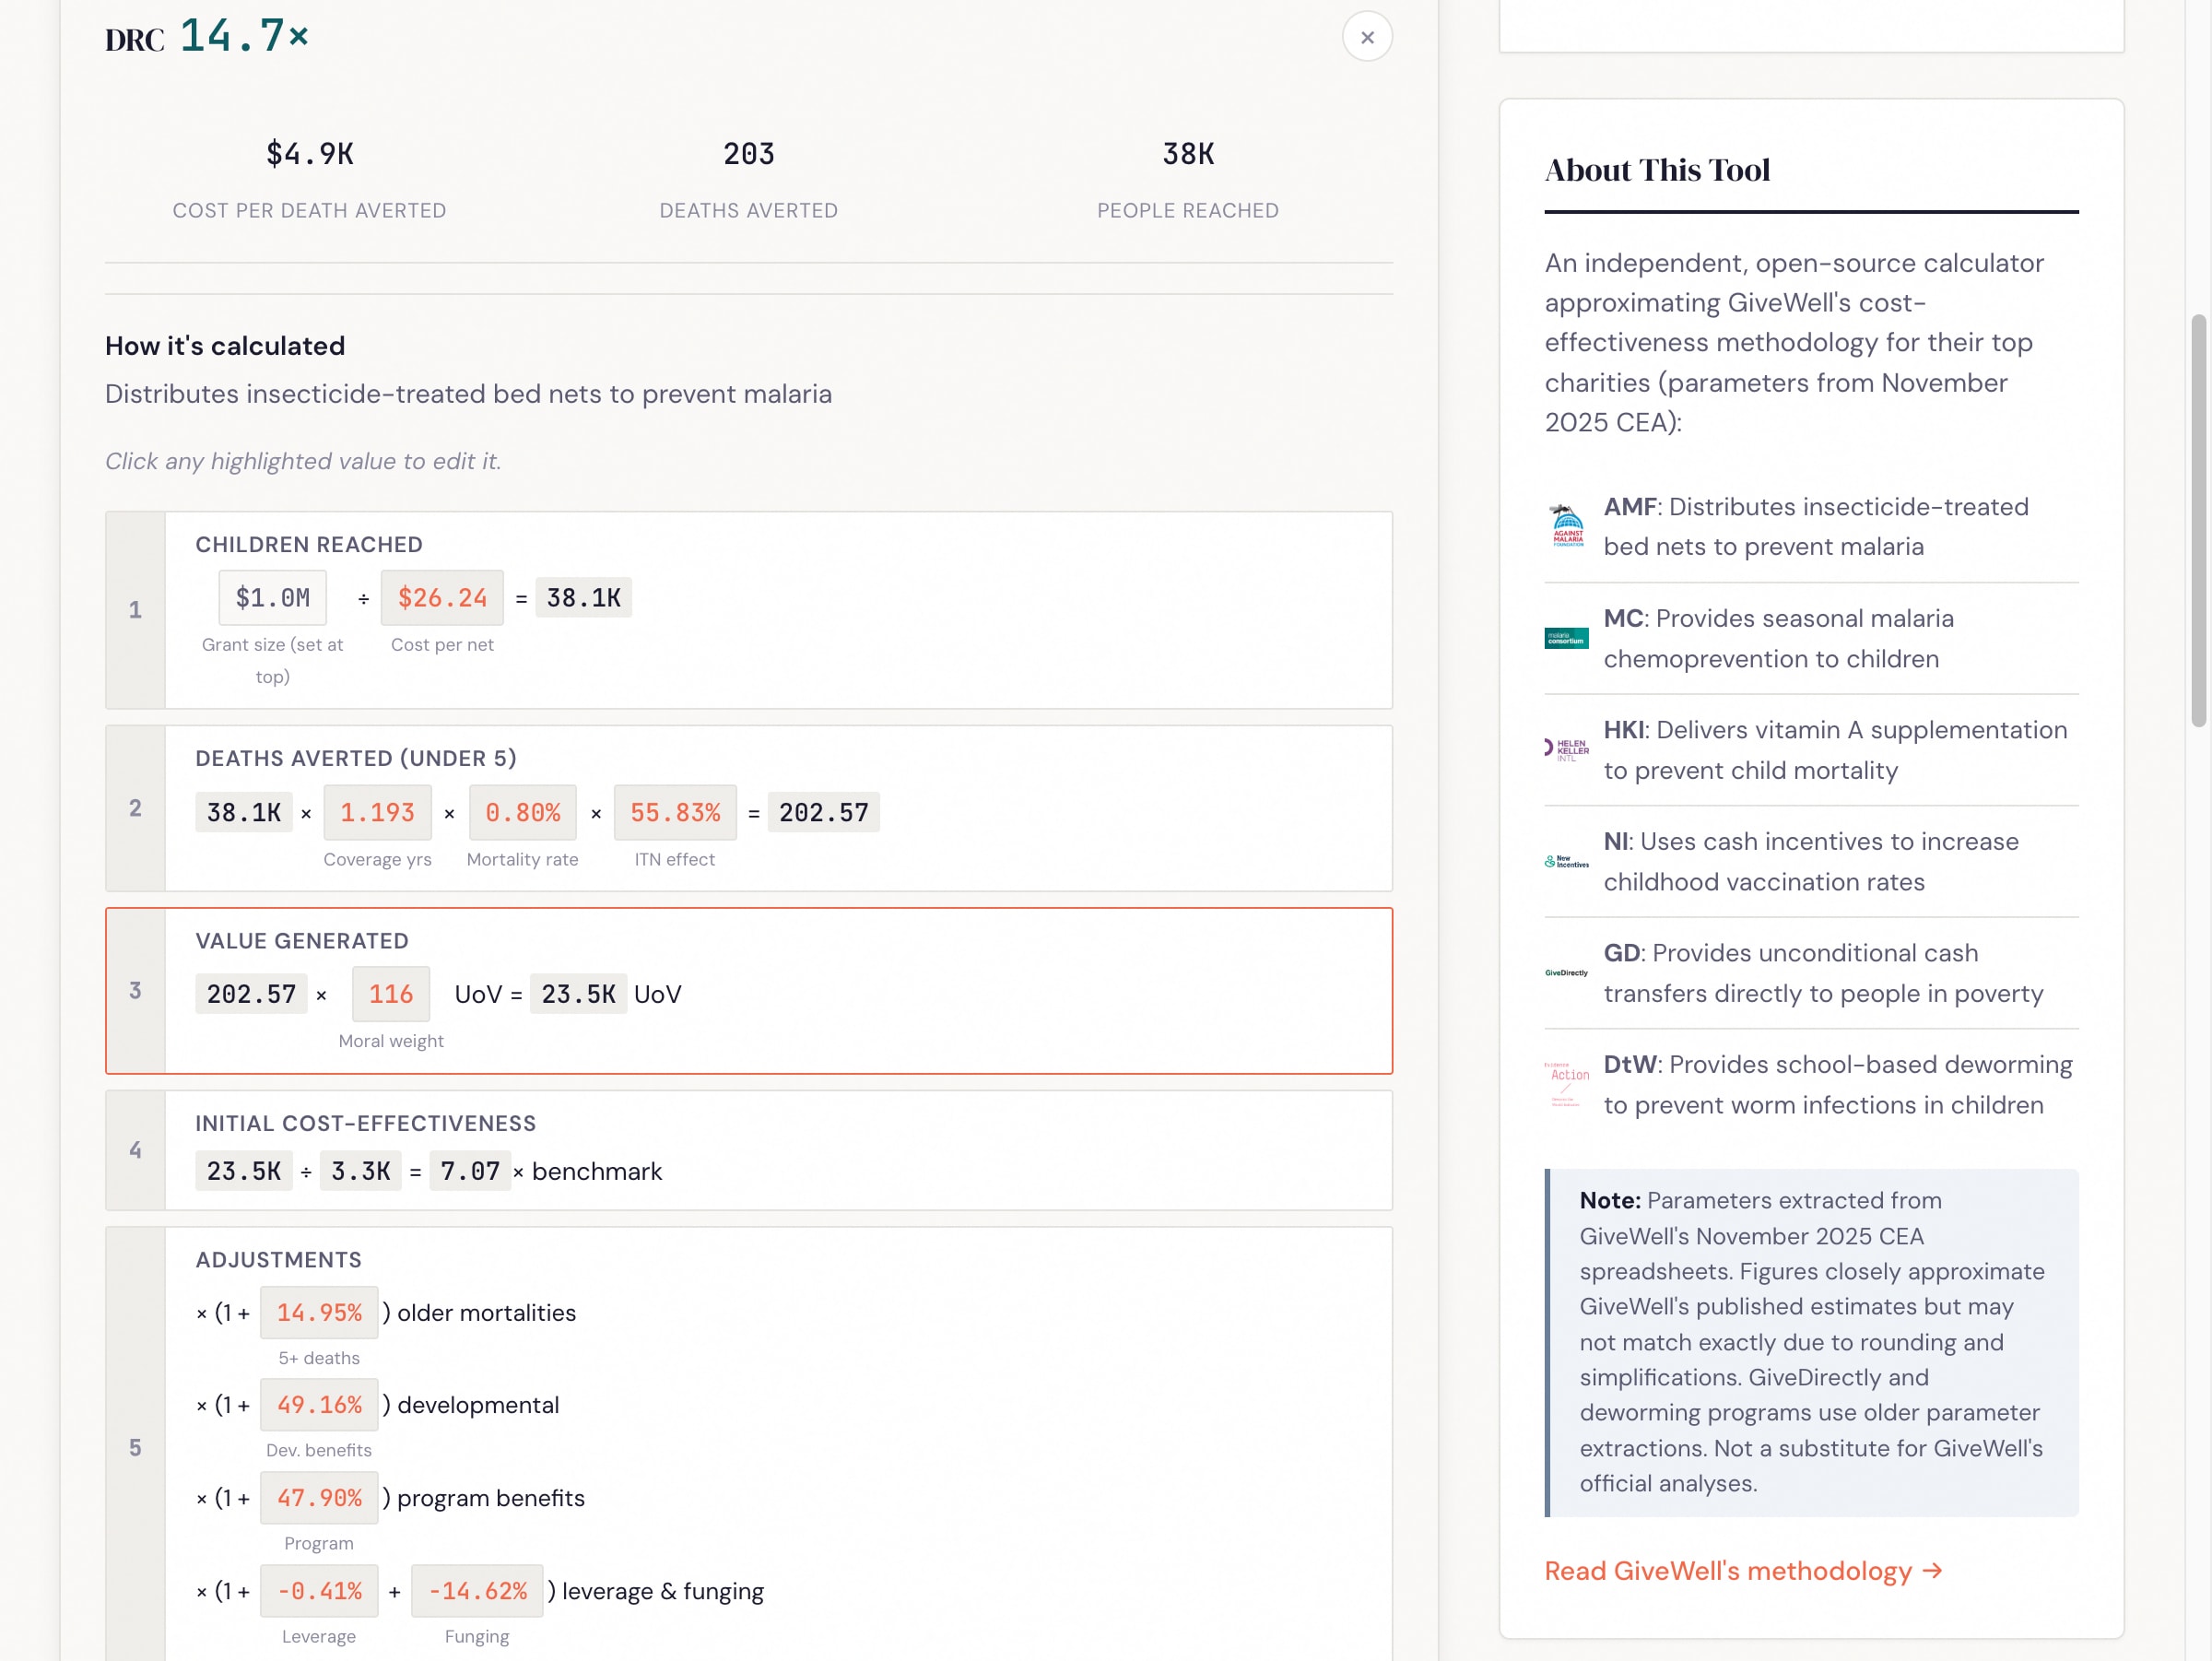
Calculation breakdown: Click any country to see the step-by-step calculation with every intermediate value. Click any highlighted number to edit it.
Moral weights: GiveWell's default weights peak at ages 5-9 (134) and weight under-5 at 116. You can adjust these with a single multiplier or set each age bracket independently. Charities with different age profiles (AMF and MC focus on under-5; NI and HKI have broader age effects) shift rankings when you change these.
Sensitivity analysis: Sweep any moral weight parameter across its range and see how all six charities' cost-effectiveness changes. This makes crossover points visible — for instance, the under-5 weight where NI overtakes MC, or the discount rate at which deworming drops below cash transfers.
How assumptions affect rankings
A few examples of what you see when you adjust parameters:
Default rankings (best country per charity, GiveWell Nov 2025 defaults):
Rank
Charity
Best country
x benchmark
1
Helen Keller
Niger
79×
2
New Incentives
Sokoto
39×
3
Deworm the World
Kenya
35×
4
AMF
Guinea
23×
5
Malaria Consortium
Chad
15×
6
GiveDirectly*
Mozambique
4×
*GiveDirectly uses a simplified model with older parameters — see Limitations.
Double the under-5 moral weight. All four mortality-focused charities see exactly +100% gains — their value comes entirely from deaths averted, so doubling the weight doubles the result. GiveDirectly gains only +3.4% because most of its value comes from consumption benefits. (A 2025 study found $1,000 transfers cut infant mortality by 48%, and GiveWell now includes mortality effects in GiveDirectly's CEA — but with steep discounts, so consumption still dominates.) Rankings don't change.
Equal moral weights across ages (all set to 100). Child-focused charities drop 14-16% (the default under-5 weight of ~116 falls to 100). Helen Keller drops from 79× to 67×. Rankings stay the same.
Double AMF's cost per child in DRC. The relationship is perfectly linear: doubling cost halves the x benchmark from 14.6× to 7.3×. This is a more powerful lever for changing relative rankings within mortality-focused charities than moral weight changes, which scale all of them equally.
When most top charities prevent child deaths, changing the weight on child deaths scales them all in the same direction. What does break the rankings is operational cost differences between countries. The tool lets you find the specific crossover points where, say, doubling a cost parameter in one country moves it below another charity entirely.
Programmatic access
The models are pure TypeScript functions — no UI dependency. Clone the repo and run analyses directly:
git clone https://github.com/MaxGhenis/givewell-cea && cd givewell-cea
bun install
Sweep a parameter:
// save as sweep.ts, run with: bunx tsx sweep.ts
import { calculateHelenKeller } from "./src/lib/models/helen-keller";
import { HK_COUNTRY_PARAMS } from "./src/lib/models/countries";

const niger = HK_COUNTRY_PARAMS.niger;
for (let effect = 0.05; effect <= 0.2; effect += 0.05) {
  const r = calculateHelenKeller({
    grantSize: 1_000_000,
    ...niger,
    vasEffect: effect,
  });
  console.log(`VAS effect ${(effect * 100).toFixed(0)}% → ${r.finalXBenchmark.toFixed(1)}×`);
}
// VAS effect 5%  → 35.6×
// VAS effect 10% → 71.3×
// VAS effect 15% → 106.9×
// VAS effect 20% → 142.5×
Rank all charity/country combinations:
// save as rank.ts, run with: bunx tsx rank.ts
import { calculateHelenKeller } from "./src/lib/models/helen-keller";
import { calculateAMF } from "./src/lib/models/amf";
import { calculateNewIncentives } from "./src/lib/models/new-incentives";
import {
  HK_COUNTRY_PARAMS, HK_COUNTRY_NAMES,
  AMF_COUNTRY_PARAMS, AMF_COUNTRY_NAMES,
  NI_COUNTRY_PARAMS, NI_COUNTRY_NAMES,
} from "./src/lib/models/countries";

const G = 1_000_000;
const all = [
  ...Object.entries(AMF_COUNTRY_PARAMS).map(([k, v]) => ({
    charity: "AMF", country: AMF_COUNTRY_NAMES[k],
    xb: calculateAMF({ grantSize: G, ...v }).finalXBenchmark,
  })),
  ...Object.entries(HK_COUNTRY_PARAMS).map(([k, v]) => ({
    charity: "HKI", country: HK_COUNTRY_NAMES[k],
    xb: calculateHelenKeller({ grantSize: G, ...v }).finalXBenchmark,
  })),
  ...Object.entries(NI_COUNTRY_PARAMS).map(([k, v]) => ({
    charity: "NI", country: NI_COUNTRY_NAMES[k],
    xb: calculateNewIncentives({ grantSize: G, ...v }).finalXBenchmark,
  })),
];
all.sort((a, b) => b.xb - a.xb);
for (const r of all.slice(0, 10)) {
  console.log(`${r.charity.padEnd(4)} ${r.country.padEnd(16)} ${r.xb.toFixed(1)}×`);
}
// HKI  Niger            79.1×
// NI   Sokoto           38.6×
// NI   Zamfara          31.3×
// HKI  DRC              29.9×
// NI   Kebbi            29.0×
// AMF  Guinea           22.8×
// ...
Each model function (calculateAMF, calculateHelenKeller, calculateNewIncentives, etc.) takes a flat parameter object and returns all intermediate values, so you can inspect any step of the pipeline.
Limitations
I replicated the structure of GiveWell's models but not their full analytical process:
I implement the calculation pipeline but not the reasoning behind parameter choices. GiveWell's adjustments (charity quality, external validity, leverage, funging) encode substantial judgment that this tool takes as given. The parameters themselves — particularly the adjustment factors — represent years of investigation, site visits, literature reviews, and internal debate. This tool lets you see the arithmetic, but the arithmetic was never the hard part.
No uncertainty analysis. The tool supports sensitivity analysis — sweeping one parameter at a time to see how results change — but does not place joint distributions over parameters or propagate uncertainty through the model. Severalexcellentposts have explored what happens when you put distributions around these estimates.
I built the GiveDirectly model as a simplified approximation from an older spreadsheet and blog post, not a direct replication of GiveWell's current model. It uses identical parameters (spillover effects, mortality effects, consumption persistence) across all five countries, unlike GiveWell's country-differentiated approach.
The tool currently covers GiveWell's top 6 charities but not newer additions.
Thanks to Brendan Phillips at GiveWell for feedback on an earlier version that helped me identify parameter mismatches and update to the November 2025 spreadsheets. This is not an official GiveWell product.
Feedback welcome on accuracy, missing features, or observations from playing with the parameters.
This post is co-authored with Ben Garfinkel. It is cross-posted from the CEA blog. A PDF version can be found here.
Summary: Some strategic decisions available to the effective altruism m...
TL;DR: I'm releasing a website that ranks philanthropists according to EA principles and research, and allows users to re-rank the list using their own assumptions. I'd like feedback and help making it better. I'd especially like ideas for how to make the results more trustworthy. Funding may be available.
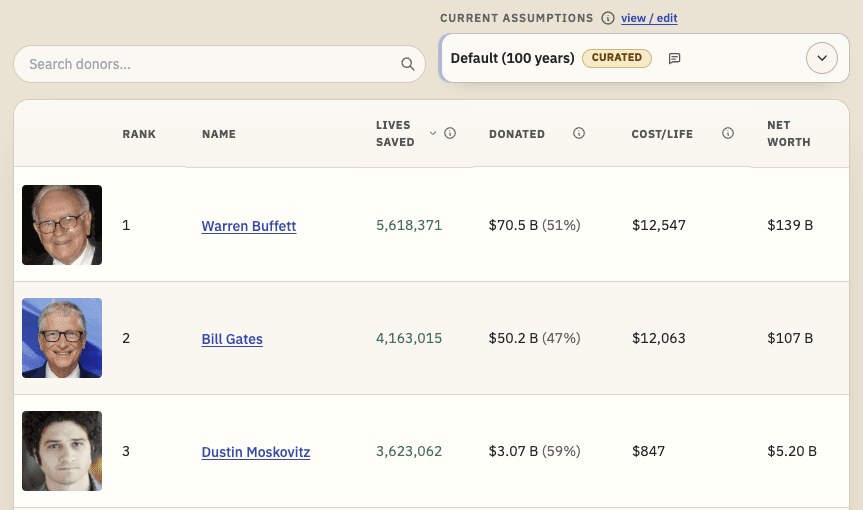
I recently built Impact List (impactlist.xyz), a site which ranks people by their positive impact via donations.
The goal is t...
Disclaimer: Although I work on the Groups Team at CEA, I’m writing this in a personal capacity, and this post does not constitute an endorsement by CEA.
Agency - the realisation that you really can just do things.
TL;DR
Biosecurity needs people (of any background) who are agentic and have a high execution velocity and track record....


Thanks for sharing - I think that the idea of making GiveWell's CEAs more interactive and approachable is fantastic. Right now, I think many of us implicitly trust GiveWell's transparent process and the mighty individuals who are willing to engage in depth and red-team critical CEAs. However, I do believe that in order for cost-effectiveness to become a norm in the philanthropic sector, approachability is critical.
Would you be open to piloting an extension of this approach with other organisations and interventions that may not be on GiveWell's top recommended list but for whom they have prepared rigorous CEAs. I lead an organisation called Fortify Health that falls into this category and would love to see if there is a way we may be able to collaborate on an extension of this methodology and tool?
Thanks Tony! I built this as a side project with a fairly narrow scope — replicating the current GiveWell CEA specifically — so I'm not planning to extend it to other organizations myself. That said, the repo is open source and the model structure is modular, so if you or someone on your team wanted to add Fortify Health as a new charity module, I'd welcome a PR. Each charity is a self-contained TypeScript function, so adding one shouldn't require changes to the rest of the codebase.
Hi Max,
Want to flag that we are doing exactly as you suggested, and I hope to provide a new PR shortly. We believe that communicating our cost effectiveness using a tool like this will make the currently quite cumbersome spreadsheet come to life.
Thanks again. We will keep you posted.