Future pandemics could arise from an accident (a pathogen being used in research accidentally infecting a human). The risk from accidental pandemics is likely increasing in line with the amount of research being conducted. In order to prioritise pandemic preparedness, forecasts of the rate of accidental pandemics are needed. Here, I describe a simple model, based on historical data, showing that the rate of accidental pandemics over the next decade is almost certainly lower than that of zoonotic pandemics (pandemics originating in animals).

Before continuing, I should clarify what I mean by an accidental pandemic. By 'accidental pandemic,' I refer to a pandemic arising from human activities, but not from malicious actors. This includes a wide variety of activities, including lab-based research and clinical trials or more unusual activities such as hunting for viruses in nature.

The first consideration in the forecast is the historic number of accidental pandemics. One historical pandemic (1977 Russian flu) is widely accepted to be due to research gone wrong, with the leading hypothesis being a clinical trial. The estimated death toll from this pandemic is 700,000. The origin of the COVID-19 pandemic is disputed, and I won’t go further into that argument here. Therefore, historically, there have been one or two accidental pandemics.

Next, we need to consider the amount of research that could cause such a pandemics, or the number of “risky research units” that have been conducted. No good data exists on risky research units directly. However, we only need a measure that is proportional to the number of experiments.[1] I consider three indicators: publicly reported lab accidents, as collated by Manheim and Lewis (2022); the rate at which BSL-4 labs (labs handling the most dangerous pathogens) are being built, gathered by Global BioLabs; and the number of virology papers being published, categorised by the Web of Science database. I find a good fit with a shared rate of growth at 2.5% per year.

Number of events per year in each of the three datasets (dots). Lines show the line of best fit from a Poisson regression, with 95% prediction interval.

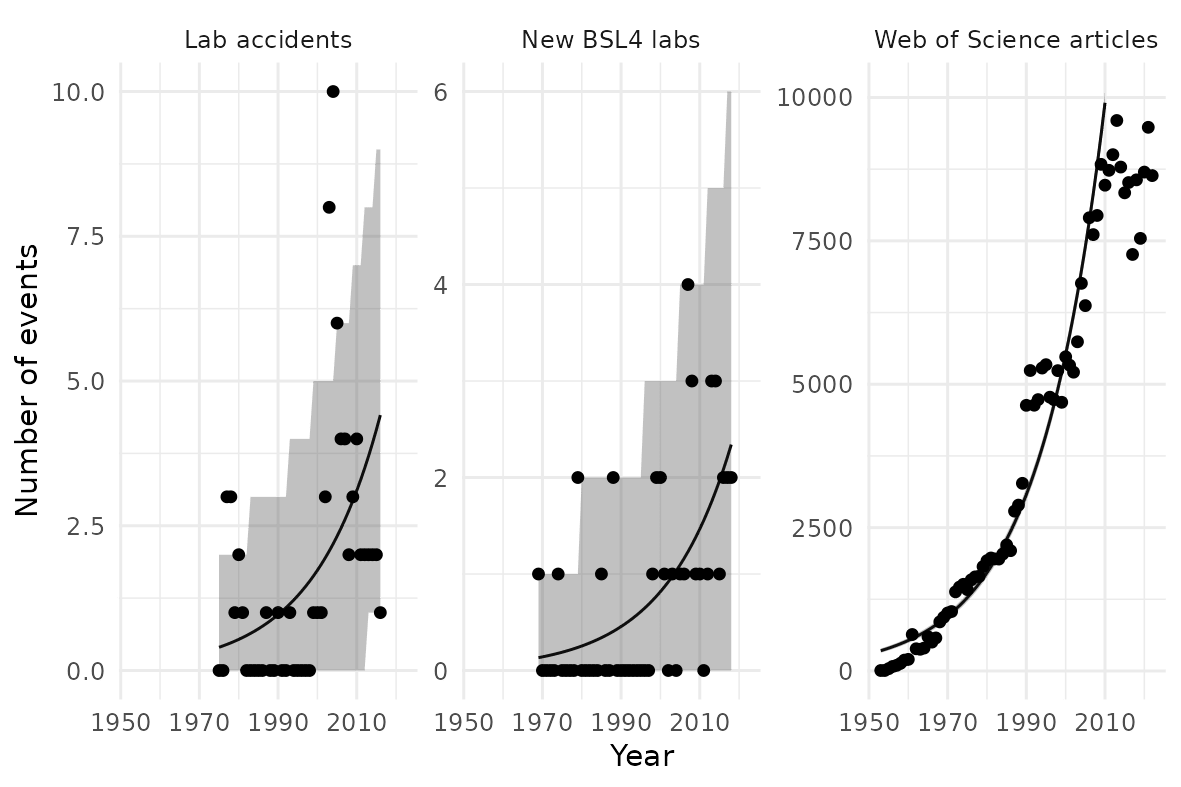
A plateau in the number of virology papers in the Web of Science database is plausibly visible. It is too early to tell if this trend will feed through to the number of labs or datasets, but this is a weakness of this analysis. However, a similar apparent plateau is visible in the 1990s, yet growth then appeared to restart along the previous trendline.

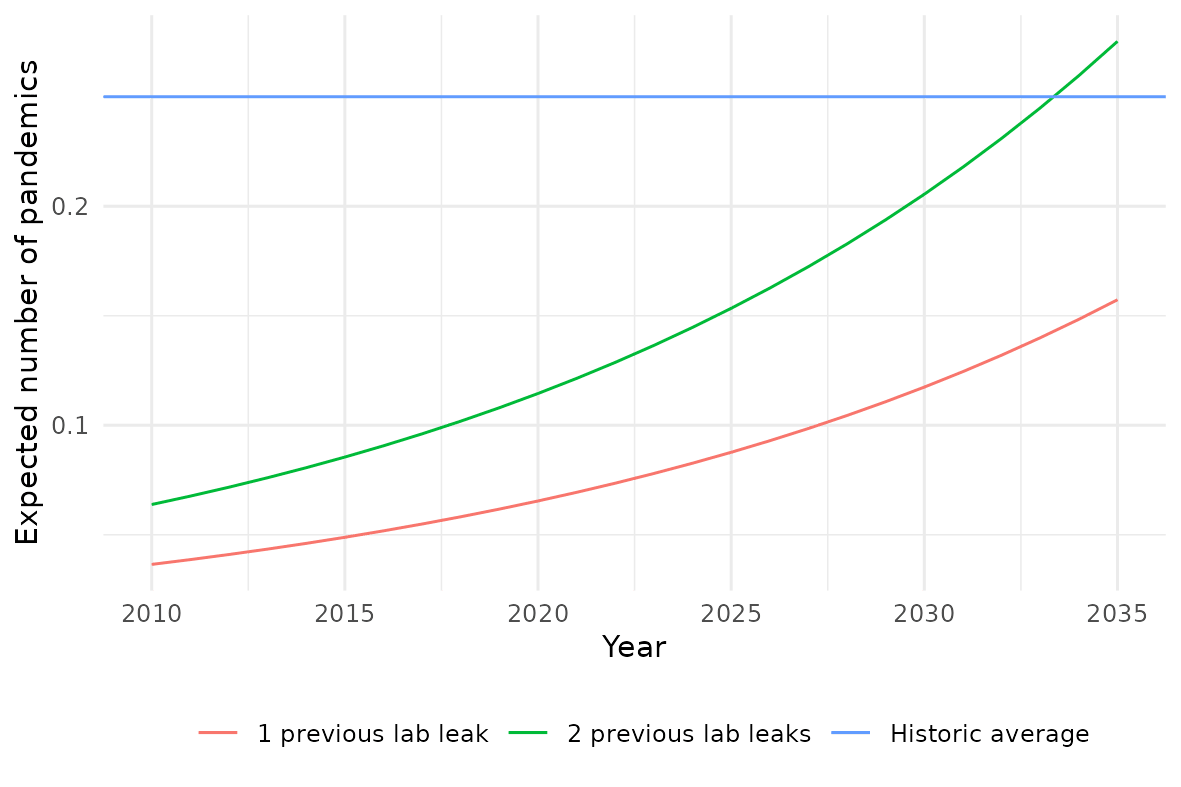
The final step is to extrapolate this growth in risky research units and see what it implies for how many accidental pandemics we should expect to see. Below I plot this: the average (expected) number of pandemics per year. Two scenarios are considered: where the basis is one historical accidental pandemic (1977 Russian flu) and where the basis is two historical accidental pandemics (adding COVID-19). For comparison, I include the historic long-run average number of pandemics per year, 0.25.[2]

Predictions for the mean number of accidental pandemics each year, in comparison to the long-run historical average.

Predictions for the ten years starting with 2024 are in the table below. This gives, for each scenario: the number of accidental pandemics that are expected, a range which the number of pandemics should fall in with at least 80% probability, and the probability of at least one accidental pandemic occurring.

ScenarioExpected number80% predictionProbability at least 1
1 previous1.20-256%
2 previous2.10-376%

Overall, the conclusion from the model is that, for the next decade, the threat of zoonotic pandemics is likely still greater. However, if lab activity continues to increase at this rate, accidental pandemics may dominate.

The model here is extremely simple, and a more complex one would very likely decrease the number forecast. In particular, this model relies on the following major assumptions.

First, the actual number of risky research units is proportional to the three indicators chosen. That all three indicators are growing at similar rates lends credence to this view. However, this assumption is, in practice, almost impossible to verify. Each of the datasets used here have issues,[3] and further work here would certainly be useful.

Second, the number of risky research units is growing exponentially, and this will continue over the extrapolation period. The plateau in the number of virology papers being published is the most concerning feature of the data here. This implies that the number of risky research units might be slowing down in growth. On the other hand, increasing access to biological research could cause an increase in risky research, but I think a step-change over the next decade is unlikely.

Third, the probability of an accidental pandemic per risky research is constant. This seems unlikely. Biosafety (actions to reduce the risk of lab accidents) is becoming more prominent and, like most of society, safety measures are increasing. This is especially true in comparison to the 1970s, when the Russian flu pandemic occurred. In fact, rerunning the above projection but only considering that there was 1 accidental pandemic by 1977 implies a more than 90% probability of two or more accidental pandemics by the present day. However, as risky research is done more broadly (e.g.: in less developed countries) biosafety may decrease. Hence, the current risk of an accidental pandemic per risky research unit is overstated by this analysis, but this is uncertain.

Fourth, and finally, the occurrence of accidental pandemics is independent. We might expect that, if a future pandemic was confirmed to be leaked from a lab, actions would be taken to reduce the probability of a future one. While this would not affect the view of the probability of at least one accidental pandemic, it should reduce the probability of two or more, and hence the expected number too.

These factors imply that the model here is overestimating the likely rate of future accidental pandemics. Therefore, it is almost certain that accidental pandemics are currently not the majority of pandemics we’d expect to see, even based on this model which likely overestimates their frequency. This may change towards the end of the projection period, hence, considerations over improved biosafety are still important.

In order to fully assess the relative impact of accidental pandemics, compared with other sources, it is also important to consider their severity. In general, I would expect the types of pathogens that research is being conducted on to be similar to those we expect to see pandemics. However, there may be a bias towards more severe pandemics since these are the ones which we would most want to prevent or mitigate.

Thank you for reading to the end. I am currently looking for a job! If you think your organisation could benefit from this type of thinking, please get in touch.

Many thanks to Sandy Hickson and Hena McGhee for commenting on drafts of this post, and the Cambridge Biosecurity Hub for many discussions informing my thinking. I am also grateful to the researchers who released the data I used: David Manheim, Gregory Lewis, the Global Biolabs project, and Web of Science.

  1. ^

     Assuming exponential growth, which appears to be a good fit, growth at the same rate implies a constant multiplier between the different indicators. The gamma-Poisson model employed for the prediction makes the same predictions if the amount of risk being incurred is scaled by a constant multiplier. Mathematical details are available in this R Markdown notebook.

  2. ^

     Using the dataset of Marani et al. (2021).

  3. ^

     BSL-4 labs are a small subset of all research, and have small numbers. The lab accidents dataset (from Manheim and Lewis) is likely incomplete, and possibly biased. Virology papers do not necessarily track risky research.

Comments4


Sorted by Click to highlight new comments since:

Nice! This is helpful, and I love the reasoning transparency. How did you get to the 80% CI?(sorry if I missed this somewhere)

Thank you Ben! The 80% CI[1] is an output from the model.

Rough outline is.

  1. Start with an uniformative prior on the rate of accidental pandemics.
  2. Update this prior based on the number of accidental pandemics and amount of "risky research units" we've seen; this is roughly to Laplace's rule of succession in continuous time.
  3. Project forward the number of risky research units by extrapolating the exponential growth.
  4. If you include the uncertainty in the rate of accidental pandemics per risky research unit, and random variation, then it turns out the number of events is a negative binomial distribution.
  5. Include the most likely number of pandemics to occur until the probability is over 80%. Due to it being a discrete distribution, this is a conservative interval (i.e. covers more than 80% probability).

For more details, here is the maths and code for the blogpost and here is a blogpost outlining the general procedure.


    1. Technically a credible interval (CrI), not confidence interval because it's Bayesian. ↩︎

Awesome, thanks!

Executive summary: A simple model based on historical data suggests the rate of accidental pandemics originating from research activities over the next decade is likely lower than that of zoonotic pandemics, but could become more prominent if risky research continues growing exponentially.

Key points:

  1. One or two historical pandemics are considered to have accidentally emerged from research activities.
  2. Three indicators related to risky research activities all show exponential growth around 2.5% per year.
  3. Extrapolating growth suggests 1-3 accidental pandemics in the next decade, with 56-76% probability of at least one.
  4. This is likely an overestimate due to assumptions like constant probability per research unit and independence.
  5. Accidental pandemics remain less likely than zoonotic ones based on historical frequencies, but could rival them in the long term if research growth continues.
  6. Improved biosafety practices could reduce risks, but need to expand to less developed countries conducting more research.


This comment was auto-generated by the EA Forum Team. Feel free to point out issues with this summary by replying to the comment, and contact us if you have feedback.

Curated and popular this week
Paul Present
 ·  · 28m read
 · 
Note: I am not a malaria expert. This is my best-faith attempt at answering a question that was bothering me, but this field is a large and complex field, and I’ve almost certainly misunderstood something somewhere along the way. Summary While the world made incredible progress in reducing malaria cases from 2000 to 2015, the past 10 years have seen malaria cases stop declining and start rising. I investigated potential reasons behind this increase through reading the existing literature and looking at publicly available data, and I identified three key factors explaining the rise: 1. Population Growth: Africa's population has increased by approximately 75% since 2000. This alone explains most of the increase in absolute case numbers, while cases per capita have remained relatively flat since 2015. 2. Stagnant Funding: After rapid growth starting in 2000, funding for malaria prevention plateaued around 2010. 3. Insecticide Resistance: Mosquitoes have become increasingly resistant to the insecticides used in bednets over the past 20 years. This has made older models of bednets less effective, although they still have some effect. Newer models of bednets developed in response to insecticide resistance are more effective but still not widely deployed.  I very crudely estimate that without any of these factors, there would be 55% fewer malaria cases in the world than what we see today. I think all three of these factors are roughly equally important in explaining the difference.  Alternative explanations like removal of PFAS, climate change, or invasive mosquito species don't appear to be major contributors.  Overall this investigation made me more convinced that bednets are an effective global health intervention.  Introduction In 2015, malaria rates were down, and EAs were celebrating. Giving What We Can posted this incredible gif showing the decrease in malaria cases across Africa since 2000: Giving What We Can said that > The reduction in malaria has be
Rory Fenton
 ·  · 6m read
 · 
Cross-posted from my blog. Contrary to my carefully crafted brand as a weak nerd, I go to a local CrossFit gym a few times a week. Every year, the gym raises funds for a scholarship for teens from lower-income families to attend their summer camp program. I don’t know how many Crossfit-interested low-income teens there are in my small town, but I’ll guess there are perhaps 2 of them who would benefit from the scholarship. After all, CrossFit is pretty niche, and the town is small. Helping youngsters get swole in the Pacific Northwest is not exactly as cost-effective as preventing malaria in Malawi. But I notice I feel drawn to supporting the scholarship anyway. Every time it pops in my head I think, “My money could fully solve this problem”. The camp only costs a few hundred dollars per kid and if there are just 2 kids who need support, I could give $500 and there would no longer be teenagers in my town who want to go to a CrossFit summer camp but can’t. Thanks to me, the hero, this problem would be entirely solved. 100%. That is not how most nonprofit work feels to me. You are only ever making small dents in important problems I want to work on big problems. Global poverty. Malaria. Everyone not suddenly dying. But if I’m honest, what I really want is to solve those problems. Me, personally, solve them. This is a continued source of frustration and sadness because I absolutely cannot solve those problems. Consider what else my $500 CrossFit scholarship might do: * I want to save lives, and USAID suddenly stops giving $7 billion a year to PEPFAR. So I give $500 to the Rapid Response Fund. My donation solves 0.000001% of the problem and I feel like I have failed. * I want to solve climate change, and getting to net zero will require stopping or removing emissions of 1,500 billion tons of carbon dioxide. I give $500 to a policy nonprofit that reduces emissions, in expectation, by 50 tons. My donation solves 0.000000003% of the problem and I feel like I have f
LewisBollard
 ·  · 8m read
 · 
> How the dismal science can help us end the dismal treatment of farm animals By Martin Gould ---------------------------------------- Note: This post was crossposted from the Open Philanthropy Farm Animal Welfare Research Newsletter by the Forum team, with the author's permission. The author may not see or respond to comments on this post. ---------------------------------------- This year we’ll be sharing a few notes from my colleagues on their areas of expertise. The first is from Martin. I’ll be back next month. - Lewis In 2024, Denmark announced plans to introduce the world’s first carbon tax on cow, sheep, and pig farming. Climate advocates celebrated, but animal advocates should be much more cautious. When Denmark’s Aarhus municipality tested a similar tax in 2022, beef purchases dropped by 40% while demand for chicken and pork increased. Beef is the most emissions-intensive meat, so carbon taxes hit it hardest — and Denmark’s policies don’t even cover chicken or fish. When the price of beef rises, consumers mostly shift to other meats like chicken. And replacing beef with chicken means more animals suffer in worse conditions — about 190 chickens are needed to match the meat from one cow, and chickens are raised in much worse conditions. It may be possible to design carbon taxes which avoid this outcome; a recent paper argues that a broad carbon tax would reduce all meat production (although it omits impacts on egg or dairy production). But with cows ten times more emissions-intensive than chicken per kilogram of meat, other governments may follow Denmark’s lead — focusing taxes on the highest emitters while ignoring the welfare implications. Beef is easily the most emissions-intensive meat, but also requires the fewest animals for a given amount. The graph shows climate emissions per tonne of meat on the right-hand side, and the number of animals needed to produce a kilogram of meat on the left. The fish “lives lost” number varies significantly by