I recommend funding GWWC and the Centre for Exploratory Altruism Research’s (CEARCH’s) High Impact Philanthropy Fund (HIPF) due their effects on soil animals, which I think are practically proportional to the increase in agricultural-land-years per $. I estimate HIPF increases agricultural land 9.42 times as cost-effectively as GiveWell’s top charities, which is similar to my estimates for the giving multiplier of GWWC in 2023 and 2024.
A few quick comments:
GWWC donors don't only give to GiveWell (or other life-saving) charities, so you'd want to discount by the proportion going to them.
There might be other charities that GWWC supporters donate to that will increase soil animal populations in expectation, e.g. some diet change and alternative protein work. You'd probably want to check the net effect combining them.
That crossed my mind, but I should have discussed it. I was guessing it would not matter. Based on numbers from GWWC's impact evaluation of 2020 to 2022, the donations to improving human wellbeing were 78.3 % (= 0.65/(0.65 + 0.07 + 0.11)) of those to improving human wellbeing, improving animal wellbeing, and creating a better future (the other category was "Multiple/Unknown"). I had something like that fraction in mind. However, I see now that GWWC estimated that only 45 % of the pledge donations from 2023 to 2024 went to global health and wellbeing, of which 94 % were high-impact donations. So 42.3 % (= 0.45*0.94) of the pledge donations from 2023 to 2024 went to high-impact global health and wellbeing interventions. I believe these are the overwhelming driver of GWWC's benefits, and increase agricultural land roughly as cost-effectively as GiveWell's top charities. So, for my preferred model 2, I estimate GWWC in 2023 and 2024 increased agricultural land 3.53 (= 8.34*0.423) times as cost-effectively as GiveWell's top charities, and 37.5 % (= 3.53/9.42) as cost-effectively as funding HIPF.
I replaced the paragraph before the acknowledgements with the following.
GWWC estimated 45 % of the pledge donations from 2023 to 2024 went to global health and wellbeing, of which 94 % were high-impact donations. So 42.3 % (= 0.45*0.94) of the pledge donations from 2023 to 2024 went to high-impact global health and wellbeing interventions. I believe these are the overwhelming driver of GWWC's cost-effectiveness accounting for effects on soil animals, which I think is practically proportional to the increase in agricultural-land-years per $. In addition, I guess high-impact global health and wellbeing increase agricultural-land-years as cost-effectively as GiveWell’s top charities. As a result, for my preferred model 2, I estimate GWWC in 2023 and 2024 increased agricultural land 3.53 (= 8.34*0.423) times as cost-effectively as GiveWell's top charities.
I still recommend funding HIPF. I estimate this increases agricultural land 9.42 (= 1.29*10^3/137) times as cost-effectively as GiveWell’s top charities, 2.67 (= 9.42/3.53) times as cost-effectively as GWWC in 2023 and 2024.
@Michael St Jules 🔸, I had initially said I removed the last bullet of the summary, but I have now replaced it with the following.
AI Use Note: Main body text entirely human written. Claude (Opus 4.8) helped develop models of animal life histories in the appendix.
Cross-posted from Good Structures.
Executive Summary
* Animal advocates sometimes make claims like “there are X of this animal...
Summary
Back in November 2023 I posted here to launch Spiro and raise our first $198k. Two and a half years later this is an update and a fundraiser for the next step.
The short version: we've now reached over-5,900 people with TB preventive medicine, including over 3,000 children under five years old. Our early results have held up well an...
Adapted from my Substack, Funding Anthropalypse.
Short version: if you want a share of the coming Anthropic and OpenAI windfall - the $37bn+ that could be in play next year - the way in is to become 'legibly excellent', so the evaluators and donors that frontier lab staff already trust point them to yo...
I tried to improve on Giving What We Can’s (GWWC’s) estimates for the future recorded donations of 10 % pledgers by stipulating the logarithm of the donations per pledger-year for pledges started in the same year evolves linearly (exponential growth; model 1), or quadratically (model 2) with the year of the pledge. I also combine the estimates from models 1 and 2 with a geometric mean weighted by their coefficients of determination (model 3).
My models lead to a value of a 10 % Pledge and cost-effectiveness of GWWC in 2023 and 2024 very similar to those from their Lifetime Giving Method. I got:
A value of a 10 % Pledge of 24.0 k, 21.4 k, and 21.7 k$ of additional donations to highly effective charities, 1.56, 1.39, and 1.41 times GWWC’s estimate from the Lifetime Giving Method.
A giving multiplier of 9.22, 8.34, and 8.42, 1.47, 1.33, and 1.34 times GWWC’s estimate from the Lifetime Giving Method.
As in our 2020–2022 impact evaluation, we used two complementary methods to estimate the counterfactual impact GWWC generated through pledges in 2023–2024:
Lifetime Giving Method: Estimate the expected lifetime counterfactual value of donations attributable to each new pledge (by pledge type), then multiply by the number of new pledges acquired during 2023–2024.
Realised Giving Method: Estimate the counterfactual value of donations made by pledgers in 2023–2024.
[...]
It is important to note that when measured over a long period of time for a single group of pledgers, these two estimates should theoretically be approximately the same. The choice of how to weight the two methods simply reflects when we attribute GWWC credit for the pledge donations that we cause:
The Realised Giving Method gives GWWC credit at the time the donations occur
The Lifetime Giving Method gives GWWC credit at the time the pledgers makes the commitment to making the donations (at the time of pledging)
In the Lifetime Giving Method, GWWC calculates the future recorded donations of 10 % pledgers per pledger-year by year of the pledge from the product between:
The fraction of pledgers recording at least one donation, which decreases exponentially from 59.4 % in the 1st year of the pledge to 27.8 % in the 40th year.
8.49 k$ of recorded donations per pledger-year, which is their estimate for pledges started from 2020 to 2023, and pledgers recording at least one donation during this period.
A discount factor equal to (1 - “annual discount rate”)^(“year of the pledge” - 1)*“pledge is on”, where:
“pledge is on” is 1 for “year of the pledge” no larger than 35.1, GWWC’s estimate for the lifespan of a 10 % pledge in years, and 0 otherwise.
GWWC also applied adjustments to account for non-recorded donations, and counterfactuals.
My estimates of future recorded donations
I tried to improve on GWWC’s Lifetime Giving Method as follows:
For each year s pledges started from 2009 to 2022, I run regressions of the logarithm of the recorded donations D of 10 % pledgers per pledger-year on:
The year of the pledge y (model 1). This respects the equation ln(D(s, y)) = a(s) + b(s)*y <=> D(s, y) = e^a(s)*e^(b(s)*y), which stipulates donations per pledger-year evolve exponentially with the year of the pledge.
The year of the pledge, and this year squared (model 2). This respects the equation ln(D(s, y)) = A(s) + B(s)*y + C(s)*y^2 <=> D(s, y) = e^A(s)*e^(B(s)*y + C(s)*y^2), which stipulates donations per pledger-year evolve superexponentially with the year of the pledge.
I obtained the future non-discounted recorded donations per pledger-year from the mean regression parameters weighted by the product between recorded donations and years of data.
I calculated the future recorded donations per pledger-year multiplying the future non-discounted recorded donations per pledger-year by the discount factor.
I present below the relative annual variation of the recorded donations per pledger-year for model 1, which I determined from D(s, y + 1)/D(s, y) - 1 = e^b(s) - 1. For the mean slope weighted by the importance of the year the pledge started, I got a relative annual variation of the recorded donations per pledger-year of -3.87 %.
Year the pledge started
Relative annual variation of the recorded donations per pledger-year for model 1
2009
6.46 %
2010
-7.53 %
2011
3.08 %
2012
12.7 %
2013
-5.61 %
2014
-12.8 %
2015
-2.87 %
2016
-5.02 %
2017
4.33 %
2018
-4.42 %
2019
-19.0 %
2020
-17.7 %
2021
-29.0 %
2022
-11.0 %
The table below has the mean regression parameters, and coefficient of determination (R^2) weighted by the product between recorded donations and years of data. I also combine the estimates from models 1 and 2 with a geometric mean weighted by their coefficients of determination (model 3).
Model 1
Model 2
a
b
R^2
Weight in model 3
A
B
C
R^2
Weight in model 3
8.78
-0.0395
27.6 %
38.5 %
8.63
0.0576
-0.00662
44.1 %
61.5 %
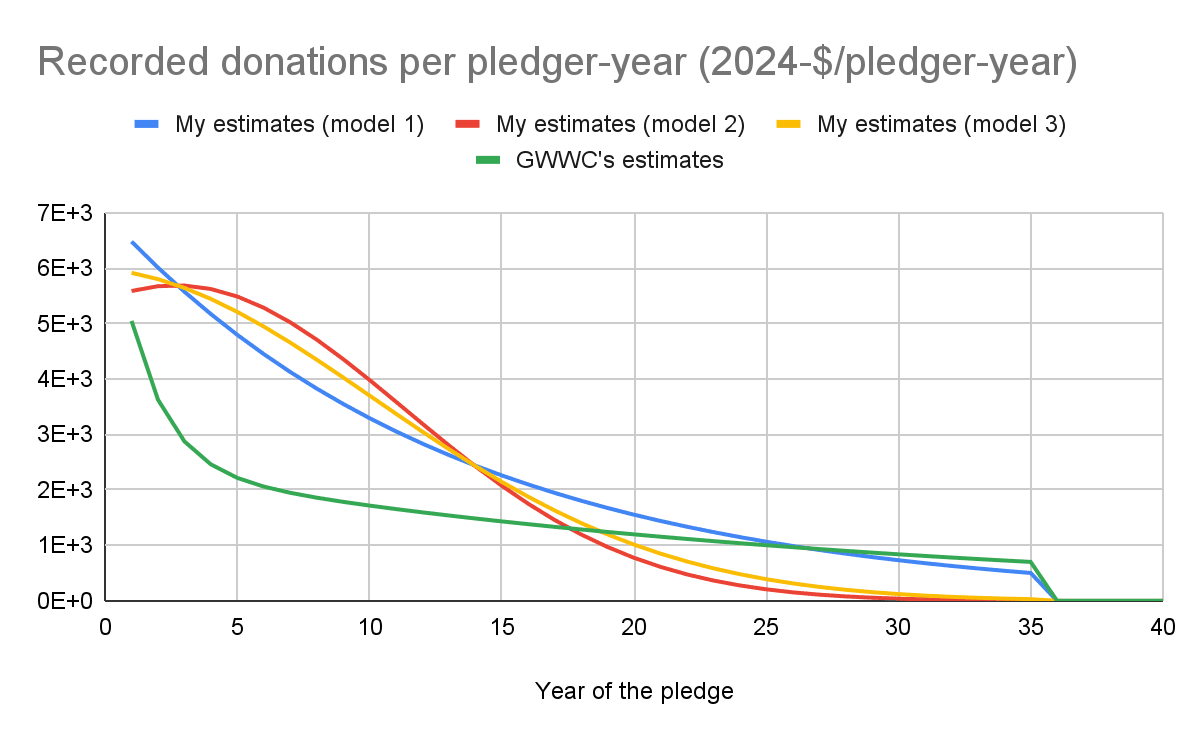
I show below a graph with my and GWWC’s estimates for the future recorded donations per pledger-year.
Cost-effectiveness of GWWC
I made3copies of the sheet with the calculations of GWWC’s last impact evaluation, replaced their future non-discounted recorded donations per pledger-year with my estimates for models 1, 2, and 3, and set the weight of the Lifetime Giving Method to 1. I also made a copy of GWWC’s sheet where I simply set the weight of the Lifetime Giving Method to 1.
My models lead to a value of a 10 % Pledge and cost-effectiveness of GWWC in 2023 and 2024 very similar to those from their Lifetime Giving Method. I got:
A value of a 10 % Pledge of 24.0 k, 21.4 k, and 21.7 k$ of additional donations to highly effective charities, 1.56 (= 24.0*10^3/(15.4*10^3)), 1.39 (= 21.4*10^3/(15.4*10^3)), and 1.41 (= 21.7*10^3/(15.4*10^3)) times GWWC’s estimate from the Lifetime Giving Method.
A giving multiplier of 9.22, 8.34, and 8.42, 1.47 (= 9.22/6.29), 1.33 (= 8.34/6.29), and 1.34 (= 8.42/6.29) times GWWC’s estimate from the Lifetime Giving Method.
GWWC estimated 45 % of the pledge donations from 2023 to 2024 went to global health and wellbeing, of which 94 % were high-impact donations. So 42.3 % (= 0.45*0.94) of the pledge donations from 2023 to 2024 went to high-impact global health and wellbeing interventions. I believe these are the overwhelming driver of GWWC's cost-effectiveness accounting for effects on soil animals, which I think is practically proportional to the increase in agricultural-land-years per $. In addition, I guess high-impact global health and wellbeing increase agricultural-land-years as cost-effectively as GiveWell’s top charities. As a result, for my preferred model 3, I estimate GWWC in 2023 and 2024 increased agricultural land 3.56 (= 8.42*0.423) times as cost-effectively as GiveWell's top charities.
I still recommend funding HIPF. I estimate this increases agricultural land 9.42 (= 1.29*10^3/137) times as cost-effectively as GiveWell’s top charities, 2.65 (= 9.42/3.56) times as cost-effectively as GWWC in 2023 and 2024 based on my preferred model 3.
Acknowledgements
Thanks to Aidan Whitfield for feedback on the draft. The views expressed in the post are my own.


A few quick comments:
Thanks, Michael.
That crossed my mind, but I should have discussed it. I was guessing it would not matter. Based on numbers from GWWC's impact evaluation of 2020 to 2022, the donations to improving human wellbeing were 78.3 % (= 0.65/(0.65 + 0.07 + 0.11)) of those to improving human wellbeing, improving animal wellbeing, and creating a better future (the other category was "Multiple/Unknown"). I had something like that fraction in mind. However, I see now that GWWC estimated that only 45 % of the pledge donations from 2023 to 2024 went to global health and wellbeing, of which 94 % were high-impact donations. So 42.3 % (= 0.45*0.94) of the pledge donations from 2023 to 2024 went to high-impact global health and wellbeing interventions. I believe these are the overwhelming driver of GWWC's benefits, and increase agricultural land roughly as cost-effectively as GiveWell's top charities. So, for my preferred model 2, I estimate GWWC in 2023 and 2024 increased agricultural land 3.53 (= 8.34*0.423) times as cost-effectively as GiveWell's top charities, and 37.5 % (= 3.53/9.42) as cost-effectively as funding HIPF.
I replaced the paragraph before the acknowledgements with the following.
@Michael St Jules 🔸, I had initially said I removed the last bullet of the summary, but I have now replaced it with the following.