TL;DR: Working as Lead Outreach Manager at a mental health nonprofit in Japan, I realized we couldn't answer a basic question funders kept asking: "What's your actual impact?" We had activity metrics (workshops delivered, calls answered) but no outcome metrics. So I built a cost-effectiveness framework using national police data and our publicly available financial records to create a model-based estimate of potential impact. Under plausible assumptions (25% intervention effectiveness), the program costs ~¥720,000 ($4,830) per DALY averted - 7× better than Japan WHO's threshold for highly cost-effective interventions. This analysis helped transform how we communicate impact to grant organizations, though significant uncertainties remain.

Background: The Question That Started Everything
I've been working at a Tokyo-based mental health organization for almost a year now, managing outreach programs and grant coordination. The learning curve has been steep - delivering mental health workshops to schools and businesses across four Japanese regions simultaneously, managing distributed teams, engaging donors remotely. There were ups and downs, failed pilot programs, and moments of genuine impact I couldn't quite quantify.
Then came the rejection email.
We'd applied for a major grant to expand our youth suicide prevention programs. The proposal highlighted impressive activity metrics: workshops delivered, hotline calls answered, schools reached. We didn't get the funding. The feedback, diplomatically phrased, essentially asked: "But what's the actual impact?"
That question hit differently after I'd spent 2024 engaging with Effective Altruism Japan and reading my first EA handbook on reasoning transparency and cost-effectiveness. I realized: we were measuring outputs, not outcomes. We knew how many people attended our workshops. We had no idea if we were preventing suicides.
As the main person at the nonprofit working with data across the organization - managing project finances, issuing tax receipts, allocating grants - I was in the best position to figure this out. So I did.
The Problem: Activity Metrics ≠ Impact Metrics
Our nonprofit provides crisis intervention services (suicide hotline, counseling) and prevention programs (school workshops, awareness campaigns). Like many organizations, our reporting focused on what funders traditionally requested:
- Number of workshops delivered: 9 in 2024
- Hotline calls answered: ~9,000 annually
- Schools engaged: 145 schools received awareness materials with phone numbers to call the hotline in times of crisis per post
These numbers look impressive. But they tell you nothing about whether we're actually preventing deaths.
Many grant evaluators now want outcome-oriented metrics. Questions like:
- How many lives are you saving?
- What's your cost per disability-adjusted life year (DALY) averted?
- How does this compare to other interventions?
We had no answers. Not because we didn't care about impact (we deeply did) but because measuring preventive interventions is genuinely hard. How do you count deaths that didn't happen?
Collecting the Data: What I Had and What I Needed
What I started with:
- Nonprofit's public annual report - clearly stated ¥11,113,476 allocated to youth outreach and prevention programs in 2024
- Japan National Police Agency open data - detailed suicide statistics by age, gender, cause, prefecture
- A data science background - enough Python, SQL, and statistics to tie it all together
What I needed to find:
1. National baseline: How big is the problem?
- Youth population (ages 10-19): ~11,000,000 (Japan Statistics Bureau, 2024)
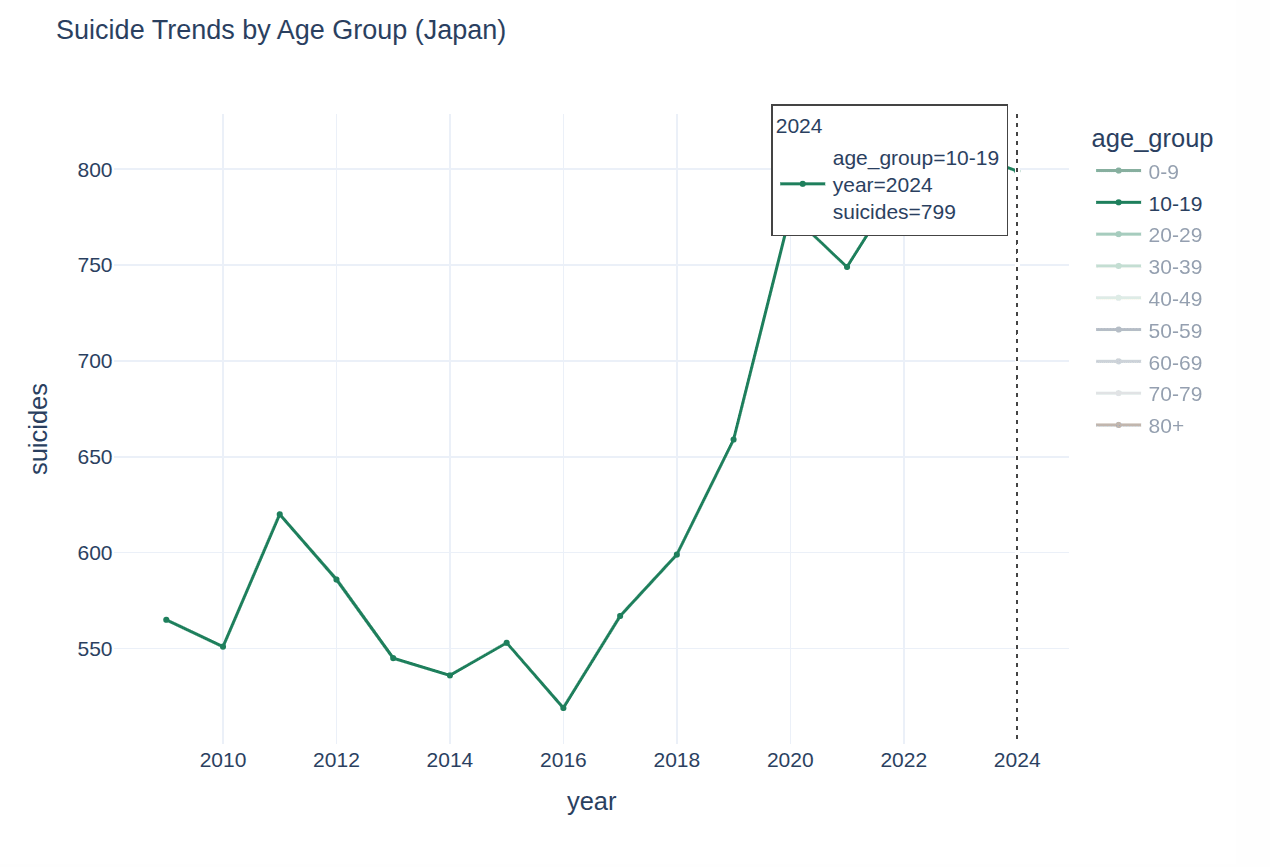
- Youth suicides in 2024: 799 deaths (National Police Agency)
- Youth suicide rate: 7.26 per 100,000
This was far from straightforward. Japan maintains excellent public health data... in PDFs... in Japanese. I did what any searcher with a tech background would do here - I attempted to scrape the website data with a Python script. After this attempt failed due to Japan's aggressive amazing security system, I reverted to downloading all 24 files into my repository by hand. Now that this was out of the way, the data extraction, analysis, labeling and translation followed. If you want to see the Python code - check my project page here: Project Page
2. Program reach: Who did we actually engage?
This was harder. Our outreach team is dispersed across four regions - Tokyo, Osaka, Okinawa and Fukuoka - with different documentation practices. I needed consistent, defensible numbers.
I categorized our reach into three channels:
A. School Awareness Packages (Indirect reach)
- Sent mental health resource packets to 145 schools
- Assumed 300 students per school (conservative estimate for Japanese high schools)
- Assumed 25% engagement rate (materials opened, read, or discussed)
- Total: 10,875 youths
Uncertainty: High. We don't track which students actually engaged with materials. 25% is based on email open rates from our digital campaigns on Mailchimp (~22-28%) and assumes physical materials have similar engagement. This could be wildly optimistic or pessimistic.
B. Suicide Prevention Workshops (Direct reach)
- 9 workshops delivered with verified attendance
- Total: 500 youths
Uncertainty: Low. We have attendance sheets.
C. Crisis Hotline Youth Callers (Direct reach)
- 9,000 total calls in 2024
- ~20% from youth callers (based on voice/disclosure, not rigorous)
- ~70% unique callers (estimated from caller ID patterns, excluding repeat callers)
- Total: 1,260 unique youth callers
Uncertainty: Medium. Age estimation is imperfect. Some callers don't disclose. Some use blocked numbers. 20% could be 15-25%.
Total youths reached: 12,635
Major assumption: These groups don't significantly overlap. In reality, some workshop attendees may also call the hotline or receive school materials. We're likely double-counting, but we have no way to de-duplicate across channels.
3. Expected deaths without intervention
Using the national baseline suicide rate:
- Expected deaths = 12,635 × (7.26 / 100,000) = 0.917 deaths
In other words, without any intervention, we'd statistically expect slightly less than one youth in our reached population to die by suicide in 2024.
4. Intervention effectiveness: The biggest uncertainty
This is where things get speculative.
Meta-analyses of suicide prevention programs show effectiveness rates ranging from 10% to 40%, with significant heterogeneity based on:
- Intervention type (universal vs. indicated)
- Population (general vs. high-risk)
- Implementation quality
- Follow-up duration
I used 25% effectiveness as a central estimate. This assumes that among youths who would otherwise die by suicide, our intervention prevents death in 1 out of 4 cases.
Why 25%?
- Gatekeeper training programs (similar to our workshops): 10-30% reduction in suicidal ideation
- Crisis hotlines: 10-20% reduction in immediate suicide risk (short-term)
- Combined interventions: Potentially higher, but limited long-term data
Critical uncertainties:
- We don't know if our workshop attendees are representative or self-selected (higher baseline risk?)
- We don't know long-term outcomes (did the crisis call prevent death, or just delay it?)
- We don't track individuals longitudinally (no way to verify actual outcomes)
- Japanese youth may respond differently to interventions validated in Western contexts
Lives saved = 0.917 × 0.25 = 0.229 lives per year
Or roughly 1 life saved every 4 years.
This number feels uncomfortably precise for something this uncertain. It's not a measurement - it's a model-based estimate with wide confidence intervals.
Calculating Cost-Effectiveness of The Program
DALYs averted
Using standard DALY methodology:
- Average age at prevention: 17 years
- Life expectancy in Japan: 84 years
- Years of life lost per death: 67 years
- Total DALYs averted = 0.229 × 67 = 15.34 DALYs
Cost per DALY
- Program cost (2024): ¥11,113,476
- Cost per DALY averted = ¥11,113,476 / 15.34 = ¥724,510 ($4,830 USD)
WHO threshold comparison
WHO considers interventions "highly cost-effective" if cost per DALY is below 1× GDP per capita:
- Japan GDP per capita: ~$34,000
- Our cost per DALY: $4,830
- The non-profit is 7× more effective than the threshold
What This Analysis Actually Shows (And Doesn't Show)
What it shows:
- Our program is plausibly cost-effective compared to global health benchmarks
- Youth suicide prevention can compete with other cause areas for funding on pure cost-effectiveness grounds
- There's a clear case for scaling if effectiveness holds (doubling reach could save ~0.5 lives/year)
- Theory of change clarity - Forced conversations about how we think our programs work
- Grant applications can be improved - We can now answer "what's the impact?" with quantified estimates and transparent assumptions
What it absolutely does NOT show:
- Causal impact - We have no control group, no randomization, no way to know counterfactuals
- Attribution - If a workshop attendee doesn't die by suicide, was it our workshop? Family support? Something else?
- Long-term effects - Does crisis intervention prevent suicide, or just delay it?
- Generalizability - Does 25% effectiveness hold across all our channels equally?
Lessons Learned: What I'd Do Differently
If I could restart, I'd:
- Survey workshop participants at 3, 6, 12 months - there is value in doing longitudinal feedback to check the effect of intervention
- Partner with researchers for rigorous evaluation
- Be more uncertain, more publicly. It's genuinely hard - Preventive interventions have murky counterfactuals, getting helpful advice is crucial
My Takeaways
This analysis is flawed. It relies on heroic assumptions, imperfect data, and speculative effectiveness estimates. But it's better than nothing. Perfect is the enemy of good. We don't need perfect impact measurement to make better decisions. We need transparent, improvable estimates that guide resource allocation.
If you're working at a nonprofit without cost-effectiveness analysis, start somewhere. Use whatever data you have. Make assumptions explicit. Update as you learn. The alternative - flying blind - is worse.
I'm sharing my full methodology, data sources, and Python notebooks here: [GitHub link]. If you spot errors or have suggestions, please reach out: [email].
Strong upvote for multiple reasons: thoroughness and transparency of reasoning and execution, stating upfront that the cost-effectiveness was well below WHO's threshold, prioritising reproducibility, and the "what this analysis doesn't show" and "lessons learned" sections.
I wonder if "de-averaging the portfolio" by ballparking cost per impact by channel (school awareness packages vs workshops vs crisis hotline) might help guide resource allocation across channels (send more packets vs get more hotline volunteers etc). My naive guess is that suicide risk isn't the same across channels, which the model as it stands implicitly assumes (which makes school awareness get ~10x as much impact credit as the crisis hotline); I'd assume that this risk for the school students is similar to that of the general population but that hotline callers are self-selected for being at much higher risk of suicide, so I'd explore the hypothesis that most of the bottomline suicide prevention impact comes from the crisis hotline even though most of the topline reach comes from the school awareness packages. This is also a channel attribution question, which as you've said the current model doesn't show and is a hard one to answer.
Thank you so much!
The hotline is indeed considered the strongest channel at the moment at my nonprofit for suicide prevention impact, since people who call it do so of their own will and usually in a state of emergency. I would argue that the school workshops are very close to being effective since they also give an opportunity for a 1-on-1 conversation with a lifeline volunteer, albeit face-to-face. But I don't know how to attribute the percentages here. The GiveWell cost-effectiveness article mentions moral weights, but they are more like philosophical moral judgments of questions about the person affected.
https://www.givewell.org/how-we-work/our-criteria/cost-effectiveness/moral-weights
In data science for example the transformers are analyzing a sentence token by predicting the next token in line based on the weights, so if I follow the logical I need to assign cost effectiveness weights to decide how much each channel contributed to effectiveness. I wish there were more studies on this online.
I love this post. It demonstrates that you can actually do meaningful cost effectiveness analysis for most health interventions, with a bit of thought and effort.
Thank you! I had to proceed with so much caution as everything evolving around mental health data collection is a huge taboo in my nonprofit. But it gives me hope that I can produce a better report on cost effectiveness of the 2025 program already in 2026.
Small note: I don't know if it's my own English at fault, but I interpreted "7x below the WHO threshold" as meaning "7 times worse than the threshold" and only understood the actual meaning as I looked at the actual numbers later. Might be worth wording it differently.
Sorry for this, I will change it, but based on everyone's comments, I think I can make many more changes in the article or write part 2 later, make it about this year's 2025 results.
( We haven't published them openly yet and Japan police hasn't updated their data either, so I could only analyze the 2024 intervention.)
I had the same initial reaction! I'd guess others would have the same misreading too, so it's worth rewriting. fyi @Yulia Chekhovska
Thank you! I will correct it.
Thanks for the analysis, I really like the approach and transparency. This is better that what the vast majority of the charities in France ever attempted.
For reference, regarding the cost effectiveness, can you share what that means compared to Givewell charities ? These are the ones I'm familiar with.
I'm also surprised by the cost-effectiveness threshold of the WHO for high efficiency (one DALY per GDP per capita spent). Does that mean that spending the nations's entire GDP to increase life expectancy by one year (and only for this year) would be considered cost effective by the WHO ?
yeah it's an old WHO bar that a lot of orgs use especially in published papers outside the EA world. I think it's not a ridiculous bar, if high income countries actually used it there's a lot of ineffective spending that wouldn't happen (like new cancer meds). Also part of the purpose of it is to encourage more healthcare spending in low income countries.
interestingly it also then kind of implies a life is worth 20x more in a rich country than a poor one. which to be fair is basically how the world does work.
But in low income countries it's a bar 50x lower ish than GiveWell for sure. IMO not the most useful bar for global health interventions.
Thank you! I agree with @NickLaing , for a wealthy country with GDP per capita of $50,000, this would mean being willing to spend the entire national income to extend everyone's healthy life by one year, which does seem generous. In practice GiveWell's bar is much higher like around $100-200 per DALY (roughly 170-340× stricter than WHO's threshold for wealthy countries).
I got the insights about Givewell cost effectiveness in suicide prevention here but I'm pretty sure it is not comparable to my intervention calculations, pesticides ban being a much clearer intervention to follow than workshops and suicide prevention hotline.
https://www.givewell.org/research/incubation-grants/CPSP-general-support-jan-2021
Thanks for the analysis, Julia! I strongly upvoted it.
Have you considered estimating the cost-effectiveness of each of the 3 channels? This could help you decide which ones to scale up or down.
Do you think the risk of the students reached via all channels was decreased by 25 %? What you write above seems to have in mind the direct channels (Suicide Prevention Workshops, and Crisis Hotline Youth Callers), but I suspect the effectiveness will be significantly lower for the indirect one (School Awareness Packages). This accounts for 86.1 % (= 10,875/12,635) of the people you estimate to have reached, so I guess you are overestimating the cost-effectiveness. However, not as much as suggested by that fraction. I believe you are overestimating the students you reached via the indirect channel.
You are assuming the materials were delivered to all students, but you only contacted at most a few representatives of each school? If so, did they all share the materials with all students? You can add a factor representing the number of students who received the materials as a fraction of all students of the schools you contacted.
Thank you for your feedback. I agree with you that separating each channel and evaluating its cost effectiveness is better if my nonprofit decides to evaluate the program and decide on what to scale up or down. About overestimating the indirect outreach - very very true. But I needed to start with at least a number that is closer to reality and based on logical assumptions and the human indifference factor wasn't helping the case (school simply not replying to our emails despite having received the packages or just sending a simple reply with no follow up).
As I also wrote above, there is a risk of duplicates, we might distribute materials and also be invited to a school to deliver a suicide prevention workshop (a training of sorts). In that case, the numbers would look much lower if we counted both channels separately, because the same people are being reached.
@Cat🔸 below wrote about analyzing youth suicide distribution across the regions and countering it with the school outreach in regions, which seems like also a more topical approach for the future analysis.
You mention not tracking people longitudinally as a limitation, but I imagine this is mostly a limitation for workshops and crisis callers, since I assume a suicide at an outreached school would be news and you would be made aware. Maybe you can compare the regional average to the school's suicide rates as a weak check against reality?
That’s a good idea, as it will give us even more insight into which regions we should target more in order to increase impact. The regional data also exists on the Japan Police Agency website, so this should be feasible. Thanks!
As for the schools news about a suicide - it's hard to coordinate to receive this news for mostly human-related reasons (most point of contacts usually only contact my nonprofit if they need a workshop, they never give us any feedback).
Hi Cat and Yulia.
I am pessimistic about using data about suicides at the outreached schools to estimate the effect of the school awareness packages. For Yulia's estimate that this program reached 10,875 students (which I believe is too high), and suicide rate of 7.26*10^-5 suicides per student-year, one should expect 0.790 suicides per year (= 10.875*10^3*7.26*10^-5) in the outreached schools. For Yulia's guess that the program decreases suicides by 25 %, one should expect 0.592 suicides per year (= 0.790*(1 - 0.25)). I think it is going to be quite hard to distinguish between uncertain distributions whose means are 0.790 and 0.592 suicides per year. I suspect one may easily have to wait 10 years to know about whether there is an effect of 25 %.
To get more data quicker, I would track not only the number of suicides, but also outcomes that are known to predict suicides. For example, there may be many suicide attempts per suicide, and I guess the number of suicides is roughly proportional to the number of suicide attempts. One could also try to track attitudes towards suicide, some of which may be a good predictor of suicides, for instance, planning a suicide. At the most distant level from tracking the number of suicides, one could simply ask the students in the outreached schools to which extent they have engaged with the awareness packages.