Hi! I'm an author of this paper and am happy to answer questions. Thanks to Jsevillamol for the summary!
A quick note regarding the context in which the extremization factor we suggest is "optimal": rather than taking a Bayesian view of forecast aggregation, we take a robust/"worst case" view. In brief, we consider the following setup:
(1) you choose an aggregation method.
(2) an adversary chooses an information structure (i.e. joint probability distribution over the true answer and what partial information each expert knows) to make your aggregation method do as poorly as possible in expectation (subject to the information structure satisfying the projective substitutes condition).
In this setup, the 1.73 extremization constant is optimal, i.e. maximizes worst-case performance.
That said, I think it's probably possible to do even better by using a non-linear extremization technique. Concretely, I strongly suspect that the less variance there is in experts' forecasts, the less it makes sense to extremize (because the experts have more overlap in the information they know). I would be curious to see how low a loss it's possible to get by taking into account not just the average log odds, but also the variance in the experts' log odds. Hopefully we will have formal results to this effect (together with a concrete suggestion for taking variance into account) sometime soon :)
I am more hesitant to recommend the more complex extremization method where we use the historical baseline resolution log-odds
It's the other way around for me. Historical baseline may be somewhat arbitrary and unreliable, but so is 1:1 odds. If the motivation for extremizing is that different forecasters have access to independent sources of information to move them away from a common prior, but that common prior is far from 1:1 odds, then extremizing away from 1:1 odds shouldn't work very well, and historical baseline seems closer to a common prior than 1:1 odds does.
I'm interested in how to get better-justified odds ratios to use as a baseline. One idea is to use past estimates of the same question. For example, suppose metaculus asks "Does X happen in 2030", and the question closes at the end of 2021, and then it asks the exact same question again at the beginning of 2022. Then the aggregated odds that the first question closed at can be used as a baseline for the second question. Perhaps you could do something more sophisticated, like, instead of closing the question and opening an identical one, keep the question open, but use the odds that experts gave it at some point in the past as a baseline with which to interpret more recent odds estimates provided by experts. Of course, none of this works if there hasn't been an identical question asked previously, and the question has been open for a short amount of time.
Another possibility is to use two pools of forecasters, both of which have done calibration training, but one of which consists of subject-matter experts, and the other of which consists of people with little specialized knowledge on the subject matter, and ask the latter group not to do much research before answering. Then the aggregated odds of the non-experts can be used as a baseline when aggregating odds given by the experts, on the theory that the non-experts can give you a well-calibrated prior because of their calibration training, but won't be taking into account the independent sources of knowledge that the experts have.
It's the other way around for me. Historical baseline may be somewhat arbitrary and unreliable, but so is 1:1 odds.
Agreed! To give some nuance to my recommendation, the reason I am hesitant is mainly because of lack of academic precedent (as far as I know).
If the motivation for extremizing is that different forecasters have access to independent sources of information to move them away from a common prior, but that common prior is far from 1:1 odds, then extremizing away from 1:1 odds shouldn't work very well.
Note that the data backs this up! Using "pseudo-historical" odds is quite better than using 1:1 odds. See the appendix for more details.
[...] use past estimates of the same question.
[...] use the odds that experts gave it at some point in the past as a baseline with which to interpret more recent odds estimates provided by experts.
I'd be interested in seeing the results of such experiments using Metaculus data!
Another possibility is to use two pools of forecasters [...]
In short: In light of a recent result by Eric Neyman, I tentatively recommend extremizing aggregated forecasts by a factor d=n(√3n2−3n+1−2)n2−n−1, which is approximately d≈√3≈1.73 for n>50 :
log^O=d1n∑logOi
When historical resolution rates are available and reasonably constant through time, I more hesitantly recommend using the aggregate:
log^O=logObaseline+d[1n∑logOi−logObaseline]
where logObaseline are the historical logarithmic odds of a positive resolution.
Neyman's result is theoretical and it is not clearly applicable in this context, but I show it has good performance on Metaculus data.
Extremizing is the practice of adjusting aggregated forecasts towards a extreme - either 0% or 100% probability.
If the experts predictions are odds o1,…,on, then an extremized aggregation of the odds is:
^o=(∏1≤i≤no1ni)d
for a given extremization factor d.
Extremizing is a common practice in academic contexts. It is usually justified on the grounds that different experts have access to different information (Baron et al, 2014).
And indeed it has been shown to have a good performance in practice. (Satopää et al, 2014) showed that forecasts in a collection of geopolitical questions are optimally aggregated when using an extremizing factor d∈[1.161,3.921].
However there are reasons to be skeptical of extremizing. It introduces a degree of freedom in the choice of the extremizing parameter. Results like Satopää's where an optimal extremizing factor is derived in hindsight risk overfitting this parameter.
Before making a blank recommendation of extremizing, we would prefer to have a grounded way of choosing an extremizing factor.
They suggest and analyse an unconventional extremizing method, where they move the aggregate estimate away from its baseline value. Concretely, their estimate as applied to logodd aggregation would be:
log^O=1n∑logOi+(d−1)[1n∑logOi−logObaseline]
which can be rearranged as
log^O=d1n∑logOi+(1−d)logObaseline
or as
log^O=logObaseline+d[1n∑logOi−logObaseline]
This is the same as classical extremizing when we assume logObaseline=0, though as we will see later it might be better to use a historical estimate.
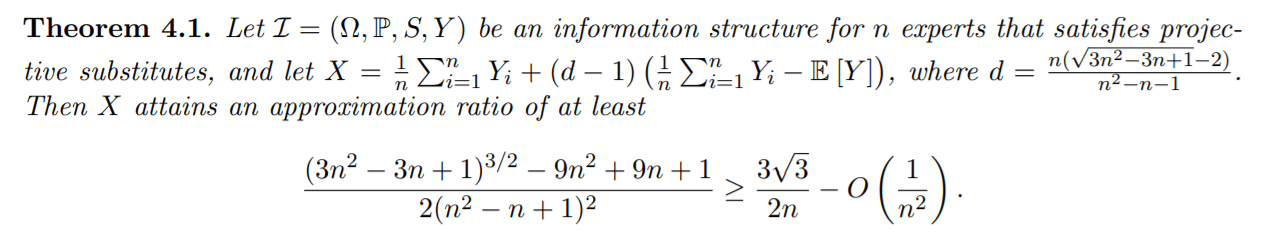
Neyman and Roughgarden show that when using an extremizing factor d=n(√3n2−3n+1−2)n2−n−1 this estimate outperforms (in a certain sense) the logodds average.
Extremizing factor
n=1
d=1
n=10
d≈1.62
n=2
d≈1.29
n=50
d≈1.71
n=3
d≈1.41
n=100
d≈1.72
n=5
d≈1.53
n=1000
d≈1.73
As n grows, the recommended extremizing factor approaches d→√3≈1.73. In practice, for n>50 the approximation d≈√3≈1.73 is already pretty good [2].
In which sense does the extremized prediction perform better? The authors analysis is done in terms of what they call the approximation ratio. This measures how close the aggregated estimate approaches gets to the square loss of the idealized prediction of an expert with access to everyone's information [3].
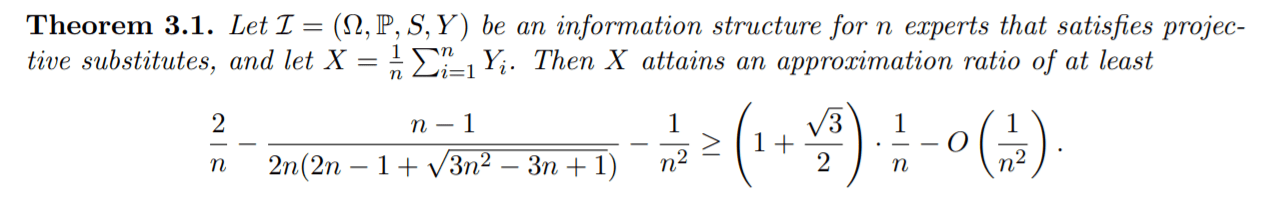
The authors find that under the projective substitutes condition their aggregation scheme performs better than a simple average, in terms of the approximation ratio [4].
What is this projective substitutes condition? Essentially, it states that there are diminishing marginal returns to more forecasts [5]. I think that this is a plausible assumption in the context of forecast aggregation, though it is not a guarantee [6].
Does the recommended aggregation strategy perform well in practice? Yes it does. I looked at 899 resolved binary questions in Metaculus, and compared several aggregation methods. The results of this analysis are included in the appendix.
In short, when assuming logObaseline=0, Neyman's extremizing factor outperforms in this dataset most other methods I tried, and it is on par with a optimized and constant extremizing rate and with the current Metaculus prediction method.
But that is not all. When I used logObaseline equal to the resolution rate of the currently resolved binary questions in Metaculus the results significantly outperform all other methods I tried, including the current Metaculus prediction [7].
In conclusion
I harbored some doubts about extremizing. It was common practice and there was some empirical evidence in its favour. But I lacked a convincing argument to rule out overfitting as the reason for the increased performance.
This has now changed. In Neyman and Roughgarden (2021) I find both a sound argument in favour and a recipe to automatically choose an extremizing rate.
In response, I now tentatively recommend extremizing average log odds as a default method for aggregating, using Neyman's method to choose an extremizing factor [8].
I am more hesistant to recommend the more complex extremization method where we use the historical baseline resolution log-odds and aggregate forecasts as:
log^O=logObaseline+d[1n∑logOi−logObaseline]
I think I would recommend this in cases where there is convincing evidence of a relatively constant resolution rate through time. For example, I believe this is the case for Metaculus binary questions.
Note that a big part of my recommendation relies on my idiosincratic reading of Neyman and Roughgarden's results, the assumption that logodd forecast aggregation satisfies the projective substitutes condition and the empirical performance on Metaculus data.
While my beliefs have changed enough to change my best-guess recommendation, I do not see the question as settled. Further theoretical and empirical evidence could easily change this conclusion, either showing how this result does not apply or coming up with a better result.
Acknowledgements
Many thanks to Eric Neyman for writing his paper and hepfully answering my questions about it.
I thank Simon M for the script and discussion of previous work, and Lawrence Phillips for reproducing the results and finding a mistake.
My work is financially supported by the Open Philanthropy Project.
Appendix: Testing Neyman's method on Metaculus data
I used 899 resolved binary questions in Metaculus to study the empirical performance of Neyman's suggested method for choosing an extremizing factor.
Method
Weighted
Brier
-log
Questions
Neyman aggregate (p=0.36)
Yes
0.106
0.340
899
Extremized mean of logodds (d=1.55)
Yes
0.111
0.350
899
Neyman aggregate (p=0.5)
Yes
0.111
0.351
899
Extremized mean of probabilities (d=1.60)
Yes
0.112
0.355
899
Metaculus prediction
Yes
0.111
0.361
774
Mean of logodds
Yes
0.116
0.370
899
Neyman aggregate (p=0.36)
No
0.120
0.377
899
Median
Yes
0.121
0.381
899
Extremized mean of logodds (d=1.50)
No
0.126
0.391
899
Mean of probabilities
Yes
0.122
0.392
899
Neyman aggregate (o=1.00)
No
0.126
0.393
899
Extremized mean of probabilities (d=1.60)
No
0.127
0.399
899
Mean of logodds
No
0.130
0.410
899
Median
No
0.134
0.418
899
Mean of probabilities
No
0.138
0.439
899
Baseline (p = 0.36)
N/A
0.230
0.652
899
In the table above I show the performance of several aggregation methods: the mean of logodds, the mean of probabilities, the median, the extremized average of logodds and Neyman's proposed aggregation method.
I include unweighted and weighted versions of each - for the weighted version we weight each experts prediction by its recency, following the same procedure as Metaculus.
To compute the Neyman aggregation, we use the formula:
log^O=logObaseline+d[1n∑logOi−logObaseline]
where d=n(√3n2−3n+1−2)n2−n−1, where n is the number of respondents.
I used both an uninformative prior p=0.5 and the actual resolution rate among the questions (p=0.3571) to derive the baseline logodds logObaseline.
For the extremized average of logodds shown I chose the extremization factors d that approximately minimize the log score.
I also include the score of the default metaculus aggregation and the baseline score we would have gotten with a constant prediction equal to the mean resolution of the questions (p=35.71%).
I included the Brier score and the log loss score - lower scores are better.
Note that the Neyman aggregation performed quite well.
When assuming a zero baseline logodds it performs better than all simple methods. It also (barely) outperforms the Metaculus aggregation in terms of log score (though not in terms of Brier score).
When assuming a baseline logodds that match the actual empirical rate it outperforms all other methods I tried. This is slighly misleading, since we only have access to the empirical resolution rate in hindsight. It is still quite encouraging.
The script to replicate my findings is here. It is based off Simon M's script here.
Footnotes
[1] Note that in the paper the aggregation is discussed in the context of estimating real-value quantities. Here I am independently arguing that their framework can reasonably apply to the context of estimating discrete logodds and plausibly continuous logdensities.
[2] Note that this factor d≈√3 falls within the confidence interval d∈[1.161,3.921] of optimal extremizing factors found by Satopää et al.
[3] Suppose we are trying to forecast the odds Y of an event. Each of n experts is granted a piece of evidence Ei that they use to elicit a forecast Yi:=Y|Ei. We then summarize their beliefs with an aggregate forecast ^Y=f(Y1,...,Yn). Our goal is to compare how good this aggregate forecast ^Y is with respect to the forecast an expert would make, if they had access to all information, ie Y[n]:=Y|E1,...,En.
The approximation ratio of an aggregate estimator ^Y then would be:
Note that the approximation ratio satisfies that AR(Y[n],Y|E)=1 and AR(E[Y],Y|E)=0.
[4] The relevant part is theorem 4.1.
We contrast this result with theorem 3.1, which shows the approximation ratio in the case of a simple average.
In short, they find that with their extremizing method they can achieve an approximation ratio of 3√32n−O(1n2)≈2.598/n, while a non-extremized average attains an approximation ratio of 1+√3/2n−O(1n2)≈1.866/n (the approximations hold for large n).
According to the authors analysis this is the best possible extremizing method of the form f(Y1,...,Yn,E[Y]) with f linear in terms of optimizing the approximation ratio. But better non-linear methods might exist, or other results for more appropriate measures of optimality.
[5] Being inexact, it means that the information gap between a group of experts sharing all their evidence and a strict subset of it would decrease if we were to add another expert to both the group and the subset.
[6] For example, in Ord's Jack, Queen and King example the projective substitutes condition does not hold, since the joint information of players A and B complements each other. The weaker weak substitutes condition does not hold either.
[7] Using the resolution baseline logodds is in a sense cheating, since I used the results of the questions to estimate this baseline. But this is an encouraging result assuming that the positive resolution rate (PRR) is roughly constant over time.
To investigate this, I ran a bootstrap study on the 995 resolved binary questions on Metaculus. I resampled with replacement 995 questions B=100,000 times and computed the PRR. The resulting 90% confidence interval is [0.3315;0.3571;0.3838].
I also studied the rolling positive resolution rate. I computed the PRR up to the ith question for 1≤i≤995. The resulting 90% confidence interval is [0.2754;0.3068;0.3729].
Both of these results are weak evidence that the PRR in Metaculus is relatively stable.
[8] Note that Eric Neyman himself raised a few concerns when I showed him a draft of the post:
It is not clear that the approximation ratio is the thing we care most about when aggregating forecasts. Neyman remarks that the KL divergence between the aggregation and the "true odds" would be a better metric to optimize.
It is not clear that "prior/ baseline log-odds" means in the contexts of aggregating forecasts. Recall that this method was developed to aggregate point estimates of real values. We are taking a license when assuming the analysis would apply to aggregating logodds as well.
Ultimately, he argues that the extremization factor to use should be empirically derived. These theoretical results provide guidance in choosing how to aggregate results, but its no substitute for empirical evidence.
I eagerly look forward to his future papers.
Bibliography
Neyman, Eric, and Tim Roughgarden. 2021. ‘Are You Smarter Than a Random Expert? The Robust Aggregation of Substitutable Signals’. ArXiv:2111.03153 [Cs], November. http://arxiv.org/abs/2111.03153.
Satopää, Ville A., Jonathan Baron, Dean P. Foster, Barbara A. Mellers, Philip E. Tetlock, and Lyle H. Ungar. 2014. ‘Combining Multiple Probability Predictions Using a Simple Logit Model’. International Journal of Forecasting 30 (2): 344–56. https://doi.org/10.1016/j.ijforecast.2013.09.009.
Baron, Jonathan, Barb Mellers, Philip Tetlock, Eric Stone, and Lyle Ungar. 2014. ‘Two Reasons to Make Aggregated Probability Forecasts More Extreme’. Decision Analysis 11 (June): 133–45. https://doi.org/10.1287/deca.2014.0293.
This post is co-authored with Ben Garfinkel. It is cross-posted from the CEA blog. A PDF version can be found here.
Summary: Some strategic decisions available to the effective altruism m...
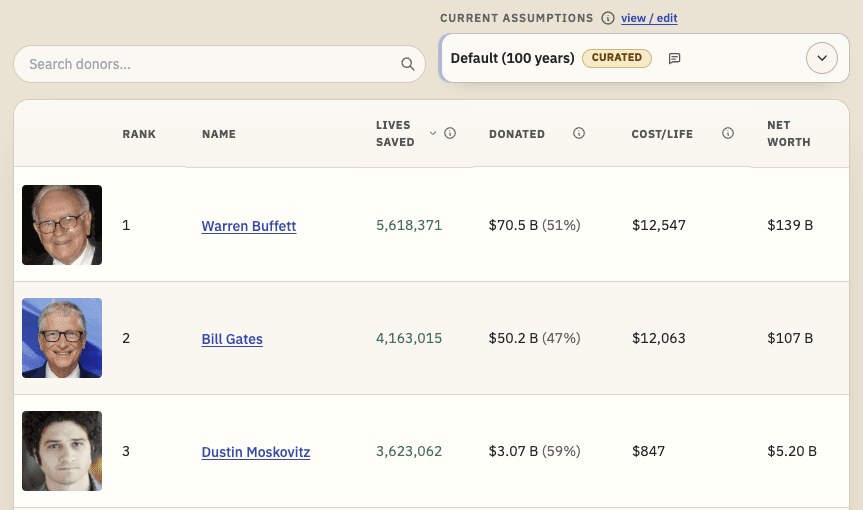
TL;DR: I'm releasing a website that ranks philanthropists according to EA principles and research, and allows users to re-rank the list using their own assumptions. I'd like feedback and help making it better. I'd especially like ideas for how to make the results more trustworthy. Funding may be available.
I recently built Impact List (impactlist.xyz), a site which ranks people by their positive impact via donations.
The goal is t...
Disclaimer: Although I work on the Groups Team at CEA, I’m writing this in a personal capacity, and this post does not constitute an endorsement by CEA.
Agency - the realisation that you really can just do things.
TL;DR
Biosecurity needs people (of any background) who are agentic and have a high execution velocity and track record....


Hi! I'm an author of this paper and am happy to answer questions. Thanks to Jsevillamol for the summary!
A quick note regarding the context in which the extremization factor we suggest is "optimal": rather than taking a Bayesian view of forecast aggregation, we take a robust/"worst case" view. In brief, we consider the following setup:
(1) you choose an aggregation method.
(2) an adversary chooses an information structure (i.e. joint probability distribution over the true answer and what partial information each expert knows) to make your aggregation method do as poorly as possible in expectation (subject to the information structure satisfying the projective substitutes condition).
In this setup, the 1.73 extremization constant is optimal, i.e. maximizes worst-case performance.
That said, I think it's probably possible to do even better by using a non-linear extremization technique. Concretely, I strongly suspect that the less variance there is in experts' forecasts, the less it makes sense to extremize (because the experts have more overlap in the information they know). I would be curious to see how low a loss it's possible to get by taking into account not just the average log odds, but also the variance in the experts' log odds. Hopefully we will have formal results to this effect (together with a concrete suggestion for taking variance into account) sometime soon :)