Hide table of contents

118

The Centre for Exploratory Altruism Research (CEARCH) works on cause prioritization research as well as grantmaking and donor advisory. This project is an external evaluation of Giving What We Can (GWWC) – specifically, its giving multiplier.

We are grateful to the GWWC team for all the advice and data they have provided to us, and for their outstanding transparency and cooperation; we are also grateful to the various effective giving organizations and meta grantmakers we consulted during the research process. To avoid any conflict of interest, we have explicitly declined to be evaluated by GWWC in 2024 for its evaluate-the-evaluators project.

Note that we have since updated our calculations of GWWC's giving multiplier, but have not updated this report, as the results do not vary significantly.


Outline

This is an estimate of GWWC's giving multiplier. This evaluation differs from GWWC's previous impact evaluation in two important ways:

  • This is a prospective analysis aimed at estimating the marginal value of funding GWWC going forward (particularly, in 2025); in contrast, GWWC's previous evaluation was a retrospective focused on past average impact.
  • We believe that GWWC's methodology for their impact evaluation is generally reasonable, and fairly conservative in important respects. However, we also believe that there were some limitations to their analysis, both in the exclusion of important variables, and in how included variables were estimated. In our evaluation, we attempt to improve on the original methodology as pioneered by GWWC.

For all our calculations and sources, refer to our spreadsheet (link). For our full report, see here (link).


Results

We estimate that GWWC's marginal 2025 giving multiplier is around 13x – for every additional $1 they spend on promoting pledging, around $13 will be raised for GiveWell top charities [1]. Uncertainty is high and caution in interpreting results is advised.


Key Model Parameters

Estimating GWWC's marginal 2025 giving multiplier is challenging, for a number of reasons:

  • Earlier pledge batches may differ from later pledge batches in their giving habits, as can an individual's giving change over time.
  • Amounts that pledgers report giving may differ from actual giving.
  • The counterfactual of how much pledgers would have given to highly-effective charities absent GWWC is fundamentally difficult to estimate.
  • Cost-effectiveness varies even amongst top charities.
  • The pledge is too young for us to observe giving patterns across an entire lifetime.
  • Pledgers may simply not report their giving at all.


Notwithstanding these difficulties, we take the following approach to estimating the following key parameters that we use to model GWWC's giving multiplier:


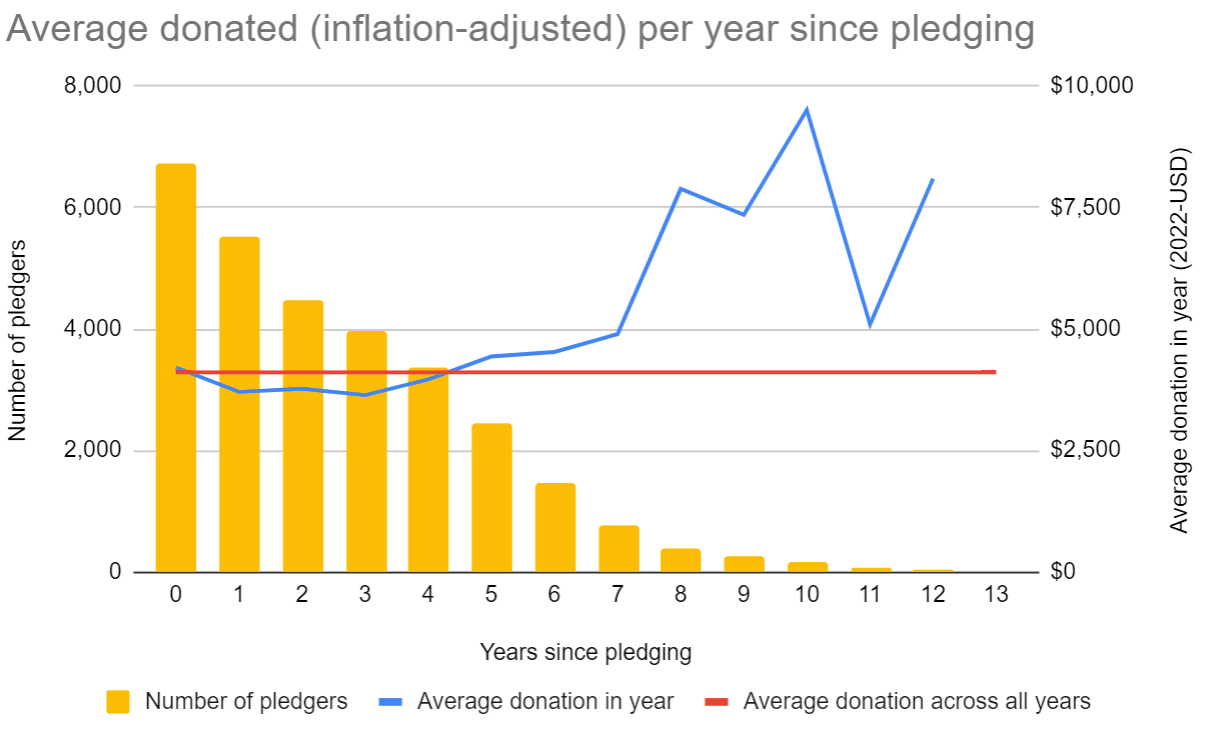
  • Annual donations per pledger: To estimate how much a pledger gives annually, we use GWWC panel data to run a regression of dollars donated against pledge batch (or trial pledge batch) and year of giving, and then project out expected 2025 donations. We also calculate a simple average of dollars donated for the last 3 years. Both estimates are then used to form a weighted average.
     
    • Pledgers: We found evidence that earlier pledgers give more than later pledgers – implying that the selection effect (i.e. self-selection of the highly zealous into the early EA movement) outweighs the income effect (i.e. rising GDP per capita over time). Meanwhile, for any given batch, pledgers gave about the same year after year, with income increases roughly balancing out attrition.
       
    • Trial pledgers: In contrast, earlier trial pledgers give less than later trial pledgers – implying that the selection effect is outweighed by the income effect. Meanwhile, for any given batch, trial pledgers give less over time, with income increases swamped by attrition.


  • Recording adjustment: To estimate how much is actually given by pledgers relative to what they report as giving, we use GWWC surveys and external reference classes to produce a weighted average.


  • Counterfactual adjustment: To estimate how much of the money given is being counterfactually moved by GWWC, we similarly use GWWC surveys and external reference classes to create a weighted average.


  • Effectiveness adjustment: To estimate how cost-effective the charities being supported are relative to GiveWell, we rely on CEARCH's previous analysis of GiveWell's cost-effectiveness, as based on GiveWell's own estimates of the cost-effectiveness of various top charities across different countries, and their relative funding distributions.


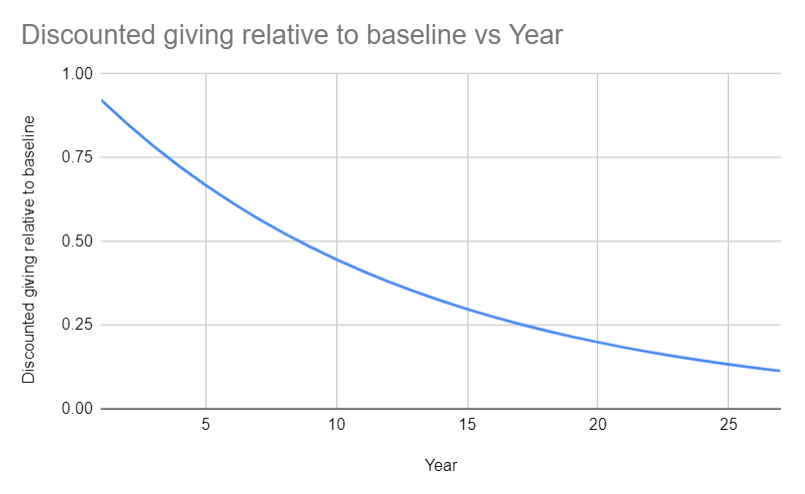
  • Discounted giving lifespan: To estimate how long a pledger is expected to keep to their pledge, we use both the results of our empirical analysis, as based on GWWC data, along with external reference classes, to generate a weighted average. This in turn is subject to a number of temporal discounts, particularly expected growth/decline in giving, global catastrophic risk, uncertainty, decline in cost-effectiveness of top charities over time, and inflation.


  • Reporting adjustment: We explicitly take into account pledgers who donate but don't necessarily report their donations, as a potentially significant source of underestimation.


Actionable Implications


  • For grantmakers and donors: CEARCH is moderately confident that GWWC generates more dollars for effective charities than it costs, and is worth funding.


  • For effective giving organizations in general: Given the value of pledging, it may be worth considering prioritizing resources towards pledging, and not just towards directing annual donations.


  • For GWWC:
     
    • Money moved is very top heavy (i.e. the biggest donors make up a disproportionate fraction of GWWC's overall impact), such that outreach to HNWIs/UHNWIs is highly valuable, perhaps facilitated by (a) hiring dedicated staff, (b) funding events and outreach targeted at the wealthy, and (c) orienting strategy around this opportunity (e.g. identifying and executing a plan to secure UHNWIs before their fortunes are made, like at Y-combinator).
       
    • It may be that GWWC is understaffed, if its giving multiplier is significantly above 1, with a lot of potential gain not yet captured by expansion.
       
    • There are potential ways to improve GWWC's M&E, particularly in survey participation (n.b. to reduce non-response bias) and design (n.b. to eliminate acquiescence and response order bias). CEARCH is pleased to provide technical advice on this issue at no cost.
  1. ^

    Note: We initially reported GWWC's giving multiplier as 14x; we have since corrected this to 13x after noticing and fixing an error related to the adjustment incorporating GWWC's top 10 largest donors.

Comments24


Sorted by Click to highlight new comments since:

Hi Joel,

Just in case you are not aware, the link below is no longer publicly accessible.

For all our calculations and sources, refer to our spreadsheet (link).

Thanks for flagging out! Have fixed it.

Thanks, Joel! The giving multiplier is now 10 instead of 13 as mentioned in the post, which you may want to update.

Hi Joel,

How did you estimate the adjustment for diminishing marginal returns in funding of 11 % (= 6/55)? You link to this post, but it does not have "55".

Hi Vasco,

Just copying over the analysis from within the spreadsheet:

  • We expect that the typical funding decision will be made in a context where GWWC has already raised - or will likely go on to raise - a meaningful portion of its budget anyway from other donors.
  • Hence, I discount for diminishing marginal returns, based on (a) the assumption that the initial 10% of baseline funding has 10 units of marginal returns, and marginal returns decline by 1 unit for every 10% increase in baseline funding; and (b) the assumption that GWWC's funding situation at the end of 2023 (about 70% of baseline budget expected to be secured) is representative of how much funding will usually be left after institutional and other reliable individual donors have made their contributions or have had their expected contributions factored in. In other words, we are assessing the value specifically of filling the last 30% of GWWC's baseline budget.
  • Note that we have gotten an independent estimate from GWWC as to the likely marginal value of the last 30% of their baseline budget, and they ballpark it at 10%.
  • However, the uncertainty is radical; and both we and GWWC expect better calibration once GWWC trials out different pledge outreach strategies over the next year and measures their returns in terms of pledges secured.


Hope that helps!

Thanks, Joel. I had seen that. However, you used the formula "= 6/55" to calculate the adjustment for diminishing marginal returns, which is 11 %. The 10 % in the notes above seems to be referring to a different calculation from GWWC for the same adjustment (otherwise, I would have expected you to use the formula "= 0.1").

Hi Vasco,

Apologies if I didn't explain clearly. Yes, the 10% estimate from GWWC was used as a sense-check, against our own calculation based on the assumptions laid out above (i.e. 1st decile of funding is 10 units of impact out of 55, 2nd decile is 9/55, 3rd decile is 8/55 ... 8th decile is 3/55, 9th decile is 2/55, and 10th & final decile is 1/55 - and since 70% of the budget is already funded, the remaining 30% is 3+2+1=6 units of impact out of 55).

Definitely not scientific, but I wanted to model a smooth decline across each decile of funding, and I ended up not worrying too much as Sjir's own subjective assessment converging with ours.

Thanks, Joel! Makes sense. Sorry for not having read the 2nd bullet carefully.

We estimate that GWWC's marginal 2025 giving multiplier is around 14x

I think it would be really helpful to graph this over time. If the majority of it manifests in 10 years, that's very different than e.g. if it assumes pledgers' will be young, have increasing salaries over their careers, and give the majority of it in 40-50 years time.

(and AI doomers will probably think that even 10 years is an irrelevant timespan, and it only really matters how much is moved in the next 1-5 years)

I don't have the estimates for how the multiplier changes over time, though you would expect a decline, driven by the future pledging pool being less EA/zealous than earlier batches.

For the value of a *pledge* - based on analysis of the available data, it doesn't appear that donations increase over time (for any given pledge batch), so after relevant temporal discounts (inflation etc), the value of a pledge is relatively front-loaded:
 

To be clear, I don't mean 'graph of how the expected multiplier on a dollar changes over time', I mean 'graph of how the expected donations generated by a dollar given are distributed over time' (before any discounting).

You may be interested in this chart from the What trends do we see in GWWC Pledgers’ giving? subsection of GWWC's 2020-22 cost-eff self-evaluation, as well as their discussion:

This is something Sjir's team and myself have discussed at length - we're definitely more pessimistic than GWWC on this point.

CEARCH's view is that the raw numbers look good, but if you regress dollar donated against year since pledging, while controlling for pledge batch (and hence the risk that earlier pledgers are systematically different/more altruistic), there is a positive but statistically insignificant relationship between average annual donations and years since pledging (n.b. increase in 35 dollars per annum at p=0.8). The experts we spoke to were split, with a weak lean towards it increasing over time - some were convinced by the income effects, while others were sceptical that you can beat attrition.

Ultimately, we chose to model a very marginal increase (<0.01% per annum); we're really not confident that you can reasonably expect an increase in giving over time for the 2025 and future pledge batches.

For how expected donations generated by a dollar evolves over time (ignoring discounts), available evidence suggests that it's flat (and so the graph is just a horizontal line terminating around 30 years later). There's a lot of uncertainty, not least on how long the giving lasts, given that we can only observe a little more than a decade of giving at this point.

Seconding this! I would also be very curious about what the multiplier is if you discount giving in future years, ideally as a chart of multiplier vs annual discount rate.

I haven't looked at this model, but in GWWC's 2020–2022 Impact evaluation, you can change the annual discount rate here or here (and other key parameters in cells nearby)

If I understand correctly, a ~10% yearly discount rate ~halves the expected value of a pledge and changes the best guess non-marginal multiplier from 30x to 23x

I think the equivalent in this model is here and a ~10% discount rate changes the marginal multiplier from 14x to 8x

I thought it would be interesting to add uncertainty. If you have

20K 40K       # Mean annual salary 2025 pledgers
* 0.1         # 10% given 
* beta 1 4    # counterfactual adjustment. Differs from post
* beta 5 5    # effectiveness adjustment
* 5 20        # discounted living lifespan
* 1.1 2       # reporting adjustment
* 800 2K      # expected number of pledgers
* 1.2 1.5     # adjustment for largest donors
* beta 2 8    # more adjustments (the product of rows 27:37 is 0.18)
/ 209K        # cost of GWWC

The result is a giving multiplier of 0.2 to 30.

To me the key parameter is the counterfactuality of these donations. Your current number is 50%, but not super sure if you are accounting for people being less able to do ambitious things because they have fewer savings.

To some extent you may also want to account for adjustments you haven't thought of generally

Hi Nuno,

We report a crude version of uncertainty intervals at the end of the report (pg 28) - taking the lower bound estimates of all the important variables, the multiplier would be 0x, while taking the upper bound estimates, it would be 100x. 

In terms of miscellaneous adjustments, we made an attempt to be comprehensive; for example, we adjust for (a) expected prioritization of pledges over donations by GWWC in the future, (b) company pledgers, (c) post-retirement donations, (d) spillover effects on non-pledge donations, (e) indirect impact on the EG ecosystem (EG incubation, EGsummit), (f) impact on the talent pipeline, (g) decline in the counterfactual due to the growth of EA (i.e. more people are likely to hear of effective giving regardless of GWWC), and (h) reduced political donations. The challenge is that a lot of these variables lack the necessary data for quantification, and of course, there may be additional important considerations we've not factored in.

That said, I'm not sure if we would get a meaningful negative effect from people being less able to do ambitious things because of fewer savings - partly for effect size reasons (10% isn't much), and also you would theoretically have people motivated by E2G to do very ambitious for-profit stuff when they otherwise would have done something less impactful but more subjectively fulfilling (e.g. traditional nonprofit roles). It does feel like a just-so story either way, so I'm not certain if the best model would include such an adjustment in the absence of good data.

It does feel like a just-so story either way

Yeah, possible. It's just been on my mind since FTX.

Thanks for the analysis, Joel!

We estimate that GWWC's marginal 2025 giving multiplier is around 13x – for every additional $1 they spend on promoting pledging, around $13 will be raised for GiveWell top charities [1]. Uncertainty is high and caution in interpreting results is advised.

Open Philanthropy's (OP's) bar is around 2 times the cost-effectiveness of GiveWell's top charities. You got a multiplier of 13 which is significantly higher than 2, and therefore suggests OP is underfunding GWWC. Does OP think the multiplier is much closer to 2, or are they limiting themselves to providing at most a given fraction of GWWC's funding? @JamesSnowden may have feedback here.

We're limiting ourselves to a fraction of GWWC's funding. At the moment, that's in the region of 70%, but GWWC and OP are aligned that we expect to dial it down substantially over time, both to enable a more diverse funding base for GWWC and to free up programmatic budget for other organizations.

Fwiw I disagree that OP's bar is 2x the cost-effectiveness of GiveWell's top charities in practice. In my view (not an official OP position or anything) differences in modeled cost-effectiveness between GW and OP's bar are indistinguishable from noise.

Thanks, James! Strongly upvoted for the transparency and willingness to share views which differ from OP's official position.

Thanks a lot for doing this evaluation, Joel! You've been great to work with throughout the process, e.g. respectful of our time but also asking some good, challenging questions. I hope we'll see more external evaluations from CEARCH (and others) of effective giving organisations in the near future, as I think it will benefit the whole space in multiple ways (increased transparency and accountability, shared learnings, information for potential donors, etc.).

Thanks Sjir! I'm grateful for the transparency and data sharing throughout - I don't see how we could have done the evaluation otherwise!

Curated and popular this week
Relevant opportunities