Comments
This is really important and interesting to read, thank you!
Would the general point apply for insect farming? Seems like the recommendations are particularly relevant there
This is really important and interesting to read, thank you!
Would the general point apply for insect farming? Seems like the recommendations are particularly relevant there
Thank you for reading!
I'm less familiar with insect farming, but these recommendations are likely useful to consider in any industry that's highly experimental, rapidly evolving, or hyper-localized. With insects, I think preventative approaches are probably more tractable than direct intervention approaches because we have such limited welfare knowledge about them.
This seems like an interesting and important point, thanks for writing.
I might nitpick the way you're characterizing the terrestrial animal case though. Layers and broilers may technically be the same species, but I think they're different enough that a lot of the same considerations apply from the fish case. For example, you mention cage-free as the paradigm scalable intervention, but actually they only apply to layers, which I'm guessing constitute less than 5% of global terrestrial animals (most are broilers). Applying a similar intervention to broilers (BCC) has been less successful than for layers.
Speaking just about the US, I would say there are actually four groups of poultry worth considering. The following are their population sizes and days spent on form from this population per year (US):
This is much more homogenous than aquatic animals, but it's not quite as homogenous as you made it seem!
Hi Hazo, yes I completely agree with you about overstating the homogeneity of chickens! The broiler/layer distinction is a problem, but most advocates intuitively understand this only for terrestrial systems. My analysis only segments aquaculture by species and country. I don't break down by production system, life stage, or procedure, all of which I think create additional target populations within a single species. Atlantic salmon farmed in RAS vs marine cages alone should be considered completely different target populations.
Thanks for the relevant post, Chiawen.
This is a portfolio problem, not an intervention problem, and many major producing countries are trending towards further fragmentation.
I would say it is an intervention problem in the sense greater fragmentation limits the scale of the benefits for a given spending (or, equivalently, increases the spending for a given scale of benefits), thus decreasing the cost-effectiveness of interventions.
A direct welfare intervention targeting Scottish farmed salmon could be more cost-effective in 2025 than 2000 as the population has increased even as global aquaculture has diversified.
I agree there's some important sense in which species diversification constrains how many species we can help with fixed resources (if species diversified and total population remained still, then intervention cost-effectiveness would decrease). I think "portfolio problem" gestures at how this phenomenon is hard to notice if we analyse the cost-effectiveness only at the level of direct welfare interventions, and don't take a step back to look at how we distribute resources across welfare interventions or consider approaches that target the diversification problem itself (like the post's recommendations).
Thanks for clarifying, Ben. That makes sense.
Are you planning on doing any additional work towards "Explore preventative approaches" front? Where there any another avenues you saw for reducing/ preventing fragmentaiton over time similar to the enviormental risk assesment? Are/ could these being deployed in the regions driving the trend?

TLDR: Welfare interventions in aquaculture don't reliably transfer across species, so each species requires independent research and implementation. I introduce "target populations" as a unit of analysis to quantify how many groups exist. From 2000 to 2023, the number of species comprising 85% of aquaculture production grew from 14 to 22. This means the structural cost of covering the same share of the industry has grown substantially, independent of how well any single intervention performs. This is a portfolio problem, not an intervention problem, and many major producing countries are trending towards further fragmentation.
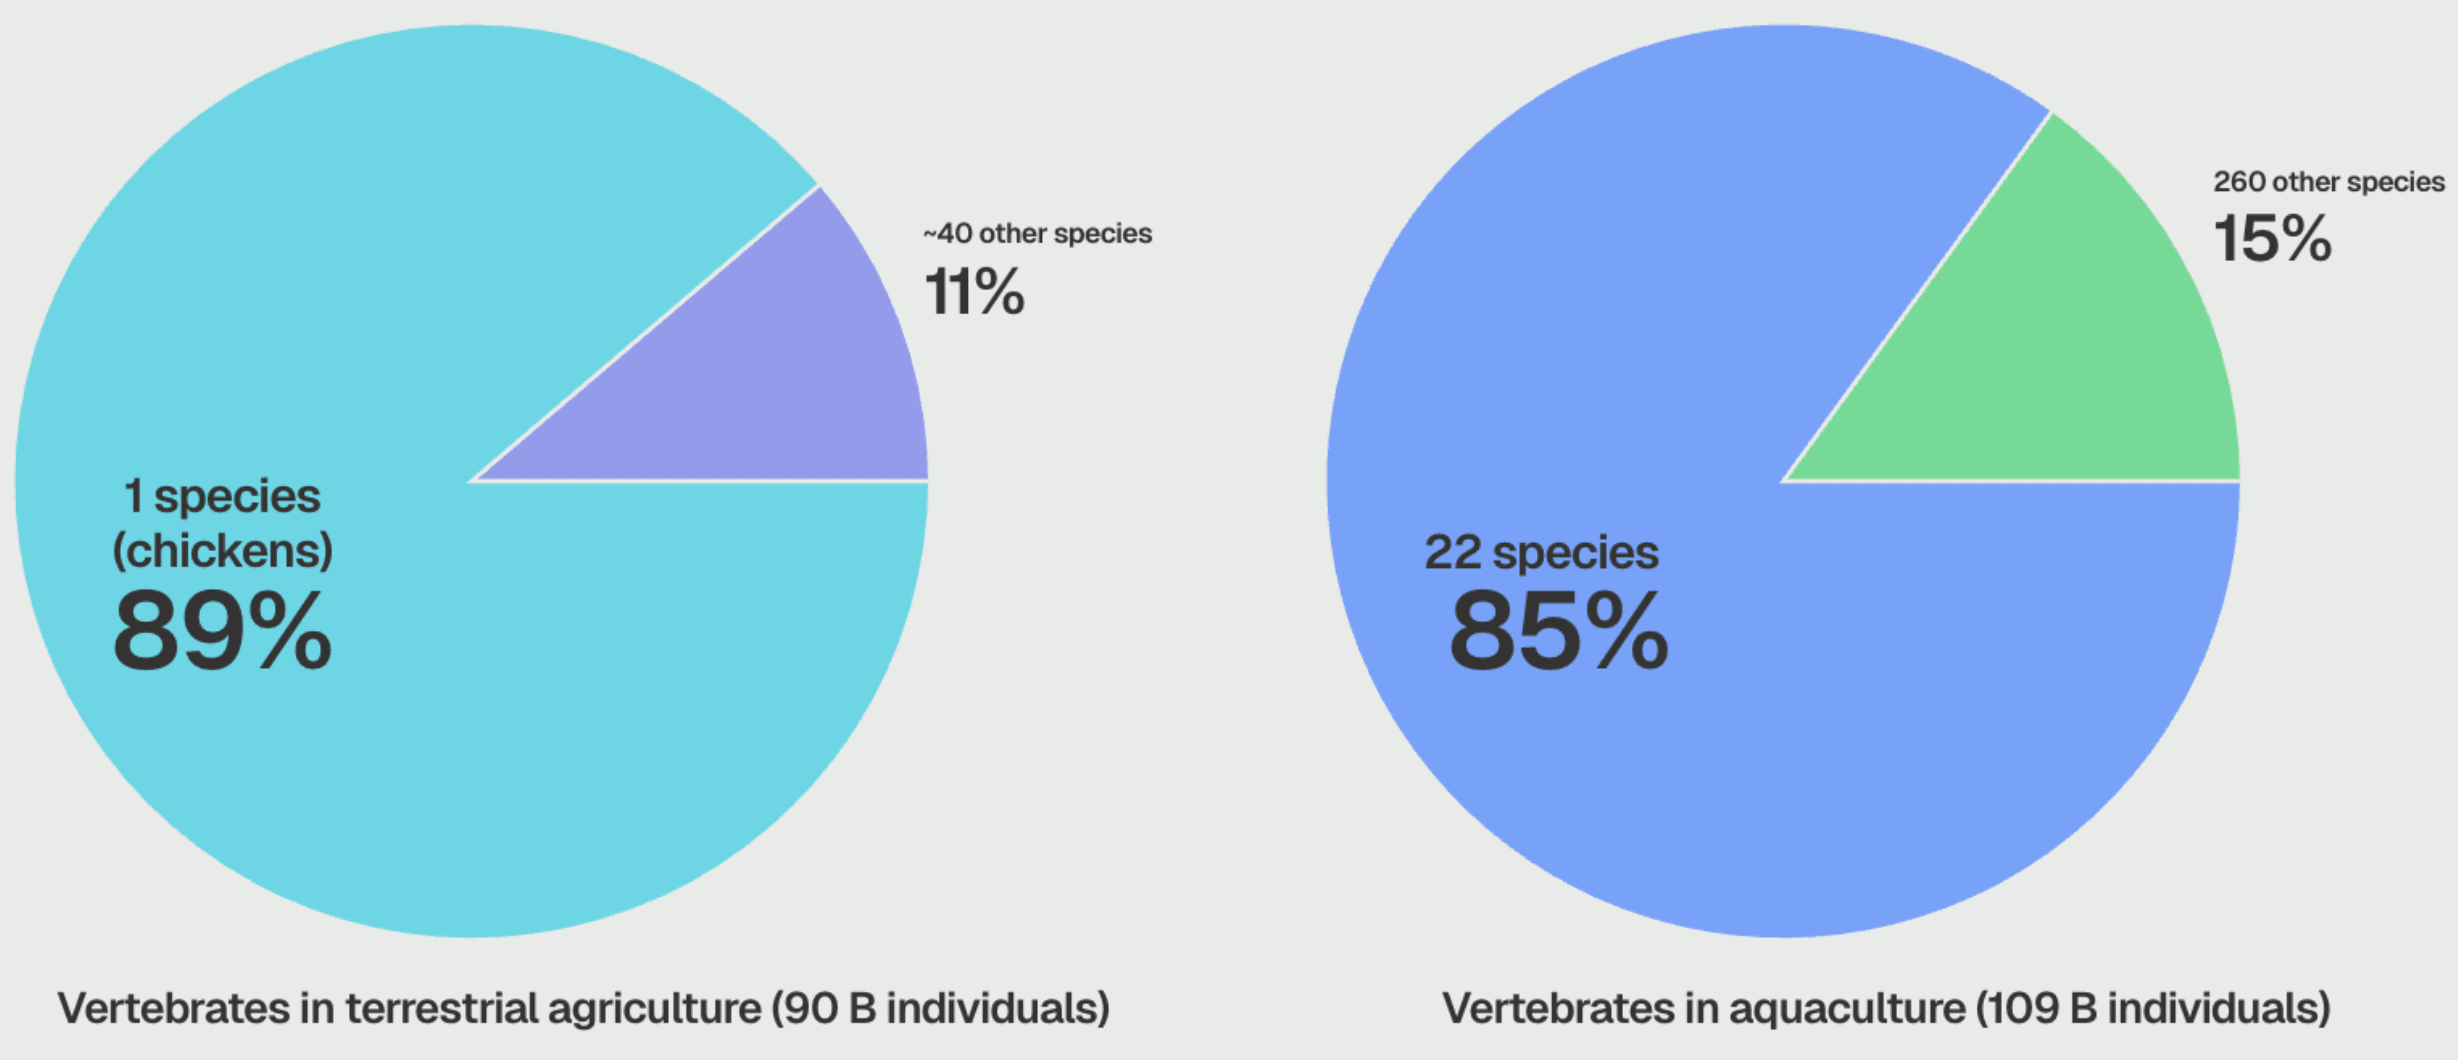
In terrestrial agriculture, one species (the domestic chicken) accounts for 89% of all farmed vertebrates. That lack of species diversity is part of what made cage-free campaigns scalable and tractable: the same welfare issues recurred across farms, enabling one intervention to address the same problem everywhere, and similar farm contexts made that intervention feasible everywhere.
Aquaculture does not have this structure. 22 species (e.g. Mrigal carp, Atlantic salmon) comprise 85% of farmed aquatic vertebrates, and 260 more account for the rest. This diversity has not consolidated over time. The number of species comprising the top 85% of production has increased from 14 to 22 since 2000.
This matters because welfare interventions don't easily transfer across species. Even if some welfare problems fundamentally are shared (e.g. low oxygen is bad), in practice their biology and farming practices can be so different that an intervention developed for a shared problem in one species won’t work as effectively for others. Surface paddle aerators that improve oxygen for carp are useless for Atlantic salmon because they live deeper in the water column. Percussive stunners, even if validated for Atlantic salmon, will never work for tilapia because their skulls are too laterally compressed. The further apart two species are taxonomically, the less likely interventions carry over. At the distance between salmon and tilapia, about as far taxonomically as a chicken and a crocodile, we should assume that no intervention transfers, even if basic biological principles are conserved.
Most cost-effectiveness analyses (CEAs) look at one intervention in isolation, or compare one intervention against another. That level of analysis is useful, but it cannot see the landscape as a whole. As the industry fragments across more species, covering the same share of the industry requires more distinct interventions. This is a structural overhead cost that grows with fragmentation regardless of how many individuals any one given intervention reaches.
To make this argument, I use a unit of analysis that captures when two groups of animals actually require independent interventions, and when they don't. That unit is a target population. This post develops that framework, applies it empirically to global aquaculture data from 2000 to 2023, and draws out what the results mean for movement strategy.
A target population is the group of animals an intervention can actually benefit: those who share both the welfare problem the intervention addresses and the operational context that makes it feasible. If welfare problems or operational contexts differ enough that the intervention no longer applies or no longer meaningfully reduces suffering, those animals constitute a distinct target population requiring independent assessment.
What causes welfare problems and operational contexts to differ? The further apart two species are taxonomically, the less they share in common physically (salmon's torpedo-shaped body vs tilapia's deep, laterally compressed form), and behaviorally (salmon migrate thousands of kilometers; tilapia establish small territories). These differences affect what welfare problems exist and what interventions are likely to transfer.
Species distance can be underestimated as a boundary because welfare problems appear to be universally shared (e.g. low oxygen is bad, handling causes fear and distress). This intuition is reasonable but misleading. The threshold at which a problem causes harm differs across species, and establishing where that threshold lies requires empirical work. For example, lowering stocking density is used as a way to decrease crowding stress. While this principle is generally true, schooling species like milkfish prefer proximity, while low densities cause aggression in Atlantic salmon by allowing territorial behaviors that higher densities suppress.[1] This shifting goldilocks zone appears in dissolved oxygen, feed composition, and water quality parameters more broadly.
A potentially more serious problem is that research on these parameters optimize for production rather than welfare per se. Growth rate and survival are not the same as welfare outcomes. This has clearly happened in terrestrial systems (Frankenchicken), but is less recognized as an issue in aquaculture. [2] Shared biology establishes that a problem matters across species but does not necessarily reduce the work required to understand how it matters to the species.
Table 1. Evolutionary distance comparisons for aquatic and terrestrial farmed species
Evolutionary distance | Fish species example | Comparable terrestrial example | Intervention transferrability |
Same genus | Atlantic salmon, coho salmon | Domestic chicken, red junglefowl | Most likely to transfer |
Same family | Atlantic salmon, rainbow trout | Chickens, turkeys | More likely to transfer |
Same order | Salmon, pike | Chickens, peacocks | Less likely to transfer |
Different order (same class) | Salmon, tilapia, carp, eel | Turtles, penguins, crocodiles, snakes | Not at all likely to transfer |
Species is not the only source of divergence. The actual unit of analysis is a tuple: (Species, Production System, Procedures & Technology, Local Context). As diversity increases along any of these dimensions, the number of distinct target populations tends to increase sometimes multiplicatively, though not all theoretical combinations exist in practice.
Table 2: Dimensions along which target populations diverge
| Dimension | Examples | Welfare heterogeneity | Implementability heterogeneity |
| Species (and life stage) | Atlantic salmon, tilapia, milkfish; fingerling, post-smolt, market-size adult | Species vary in natural behaviors and physiological needs (e.g., salmon are highly stress-prone; tilapia tolerate high densities better) | Biological differences determine what's physically possible (e.g., percussive stunning methods for salmon are incompatible with head shape of tilapia) |
| Production system | Recirculating aquaculture systems (RAS), earthen ponds, marine cages | RAS technical complexity creates acute failure risk; high densities mean collapses are rapid and affect large numbers simultaneously while earthen ponds are prone to algal bloom | What's feasible in one system may be impossible in another (e.g., physical enrichment interferes with RAS water filtration) |
| Procedures & technology | Vacuum pumps vs. nets; thermolicer vs. chemical baths for sea lice treatment | Different procedures expose fish to different stressors (e.g., vacuum pumps create different injury risks than netting) | Existing technology creates dependencies that constrain what changes are feasible |
| Local context | Profit margins, access to capital, road conditions | Farmers without access to capital or knowledge cannot adopt higher-welfare technologies and practices. | Technically sound interventions may be impossible to deploy if farmers cannot physically execute them (e.g., no electricity in the area). |
An intervention that works for one combination of species, production system, technology, and local context can fail entirely for another not only because the welfare problem is different, but because the solution pathway is. Take for example, the issue of sea lice in Atlantic salmon. The viable interventions and effectively the number of individuals any intervention can reach, diverge based on operational context:
Table 3: How operational constraints fragment the target population (sea lice interventions in Atlantic salmon)
Possible intervention | Implementation requirements | Final target population |
| Thermal delousing (heated water bath) | Well boat delouser; 8–20% mortality risk; requires large, healthy fish | Atlantic salmon × Sea cages × Farms with well boats × Fish >500g, no co-morbidities or recent stressors |
| Snorkel barriers (submerged feeding) | Sites with low-medium water current and oxygenators; submerged feeders; deep cages (>20m); | Atlantic salmon × Sea cages × Low-medium current sites × Submerged feeders × Deep cages |
| Cleaner fish (wrasse/lumpfish) | Water temps 8–18°C year-round; creates cleaner fish welfare concerns | Atlantic salmon × Sea cages × Temperate sites × Farms managing cleaner fish welfare |
This framework establishes when species, production system, technology, or local context diverge enough to require independent interventions. The answer to how many target populations exist is entirely intervention-dependent (a stunning intervention and a stocking density standard will carve the industry into different populations). I use species and species-country combinations as tractable proxies. This is a simplification that likely understates true fragmentation but is sufficient to show its direction and scale.
Using FAO data from 2000-2023, and species and species-country combinations as proxies for target populations, here's what the industry looks like. [3]
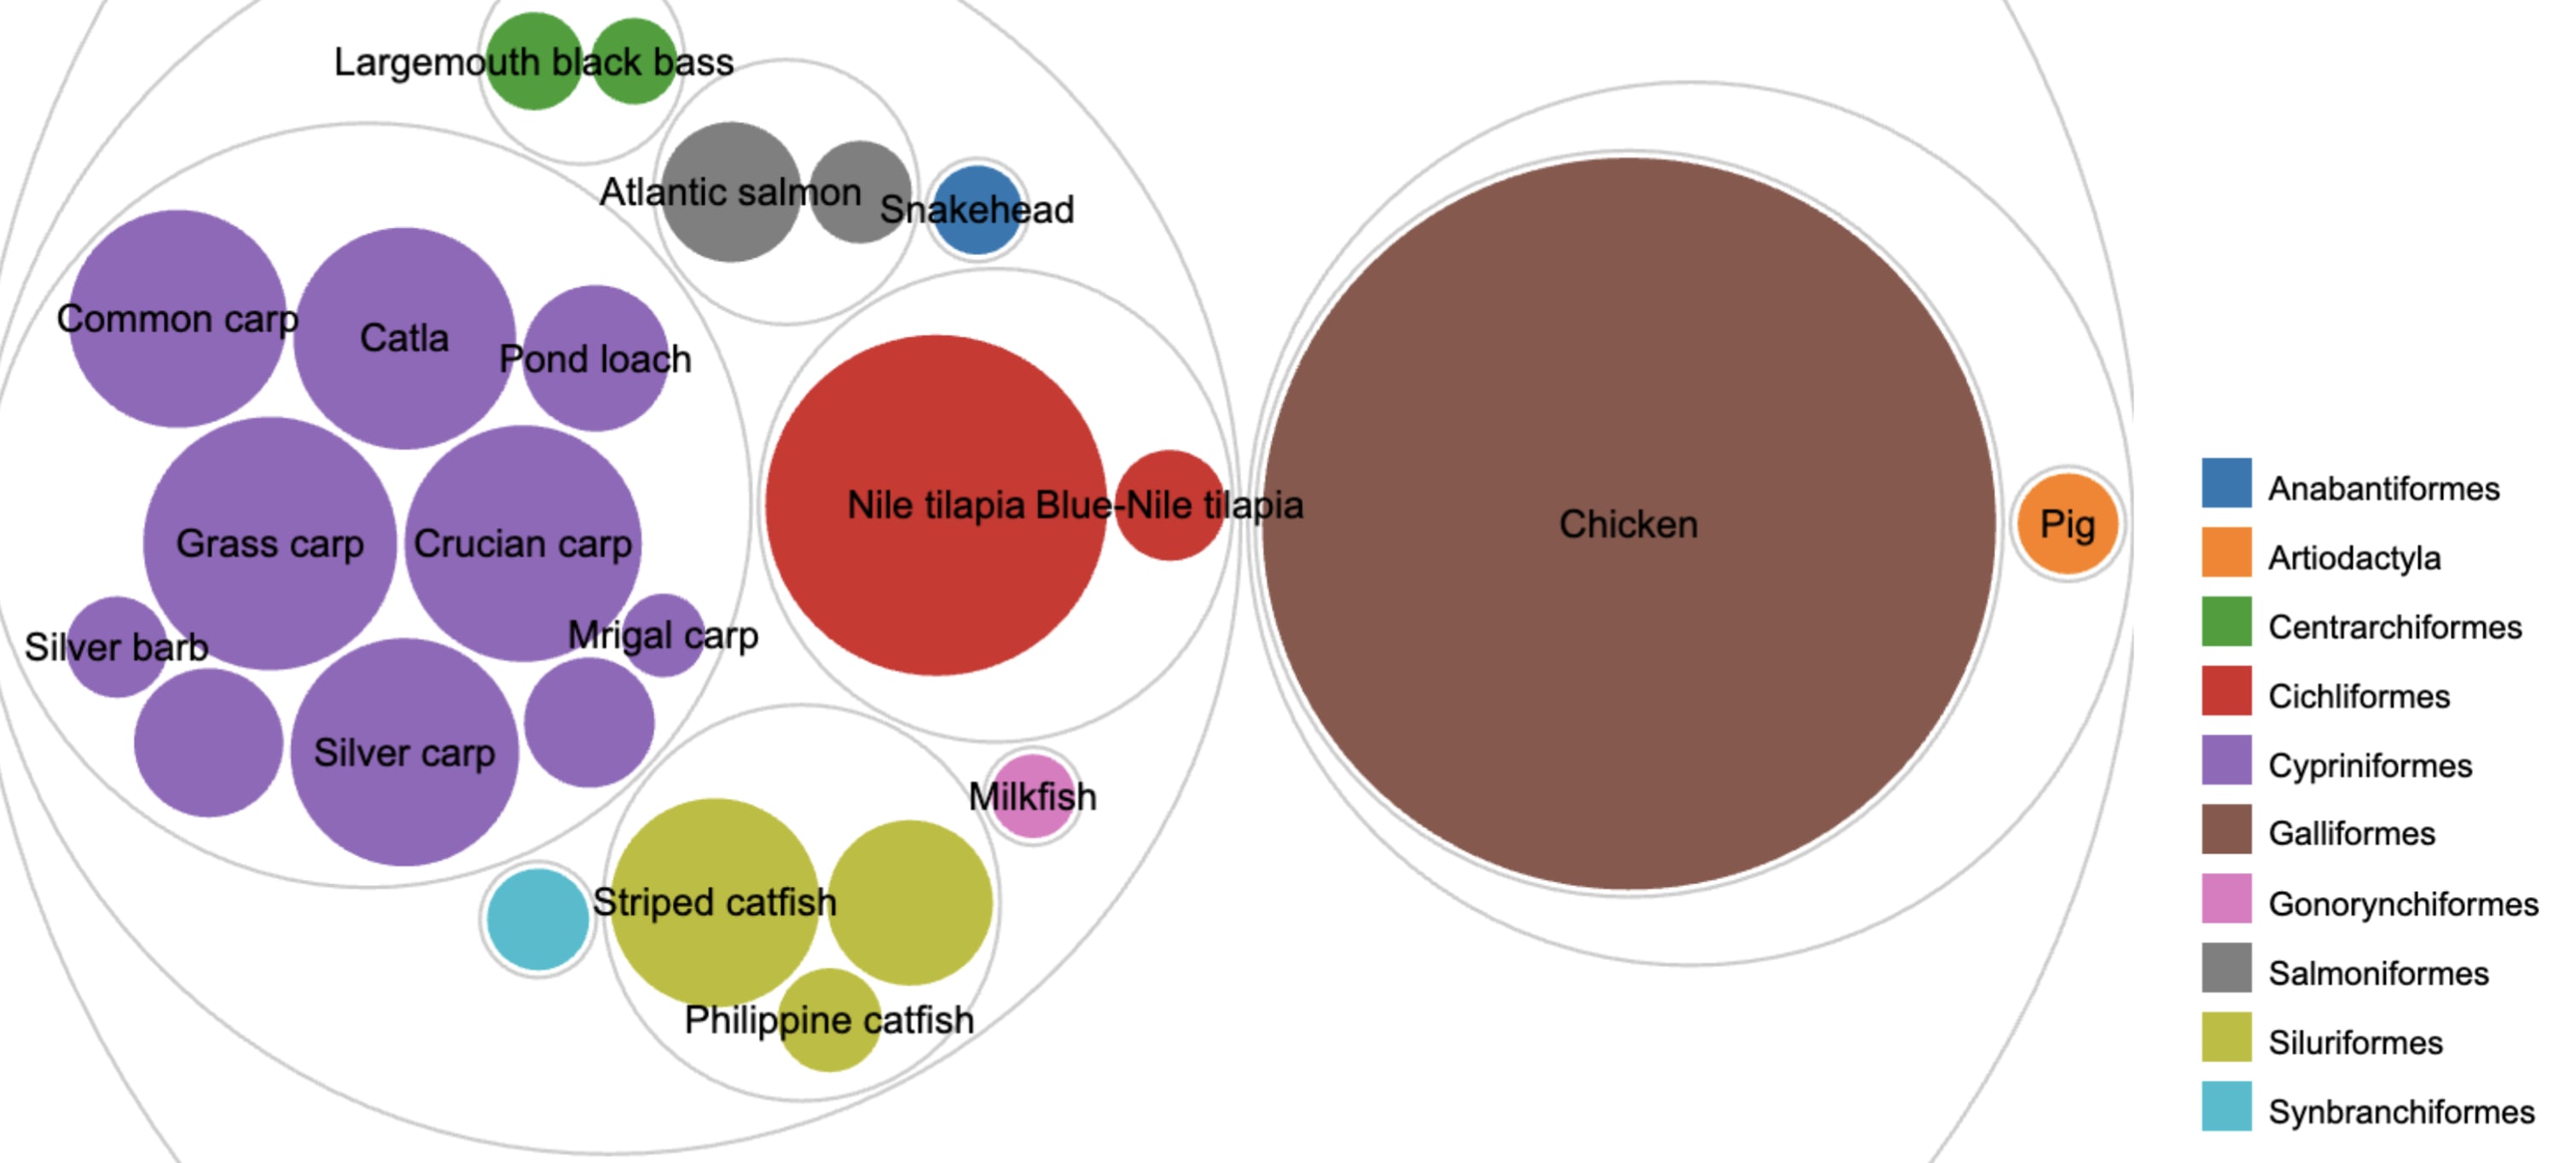
Figure 1. The 22 species comprising 85% of global farmed aquatic vertebrates (2023), compared to terrestrial production at scale. Bubble size is proportional to number of individuals. Colors indicate taxonomic order-- 8 orders are present within the 85%. The remaining 15% spans 259 additional species not shown.
If we factor in country contexts, the global aquaculture industry currently operates across 1337 active species-country combinations. Table 4 compares this fragmentation to chicken production.
Table 4.
Species | Species-country pairs | Individuals | |
Chickens | 1 | ~190 | 79 B |
Fishes | 275 | 1314 | 107 B |
Turtles and frogs | 6 | 23 | 1.6 B |
This fragmentation is not evenly distributed. To measure it at the country level, I use Effective Number of Species (ENS). ENS is a measure of diversity that is calculated by exponentiating the Shannon index, which converts it into a more intuitively interpretable metric. It accounts for both how many species are farmed and how evenly production is distributed across them. [4]
Table 5. Species diversity patterns across representative countries among the top 20 aquaculture-producing countries (excluding Iran). Global ENS is 27.3
Country | Total Individuals | Effective Number of Species (ENS) |
China | 55.2 B | 16.5 |
India | 11.6 B | 3.8 |
Indonesia | 7.6 B | 5.7 |
Viet Nam | 6.7 B | 2.7 |
Bangladesh | 5.2 B | 9.9 |
Egypt | 3.5 B | 2.6 |
Norway | 1.8 B | 1.4 |
Chile | 1.3 B | 2.2 |
Nigeria | 432 M | 6.5 |
Malaysia | 302 M | 8.5 |
Taken together, these numbers point to a structural challenge for direct welfare interventions. An organization deploying a welfare intervention for one species reaches, in expectation, roughly 1/ENS of the farmed aquatic vertebrates in a given country (assuming no additional constraints from production systems or local context). Globally, with an ENS of 27, a single species-level intervention reaches roughly 4% of farmed aquatic vertebrates as a biological ceiling. This is radically different from terrestrial agriculture, where 89% of all farmed vertebrates are chickens, housed largely either as layer hens in battery cages or broiler chickens.
From 2000 to 2023, the number of aquatic vertebrates farmed globally increased along three different measures of diversity: [5]
Among the top 20 aquaculture-producing nations, ENS trajectories (2021-2023) diverge: 10 countries show diversifying trends, 4 show consolidating trends, and 6 exhibit volatile patterns with no clear direction.
Table 6. ENS trajectories of the 20 highest producing countries of vertebrates (2021-2023). [6]
| Strongly diversifying | Weakly diversifying | Volatile | Weakly consolidating | Strongly consolidating |
| Bangladesh | Myanmar* | Chile | Thailand | Brazil |
| Cambodia | Ecuador | India | Turkey | |
| China | Norway | Indonesia | Egypt* | |
| Colombia | Philippines* | Nigeria | ||
| Malaysia | Vietnam | |||
| Mexico | USA |
As the industry fragments across more species, covering the same share of it requires more distinct interventions. This is a portfolio problem: the movement's total coverage is a function not just of how well any single intervention performs, but of how many independent interventions the movement can sustain in parallel. Evaluating cost-effectiveness at the level of a single intervention cannot see this. A well-designed tilapia intervention reaches more animals today than it would have in 2000, because the number of farmed Nile tilapia increased from 3 billion individuals to 17 billion over that period. By that measure, fragmentation may not appear to matter. Instead of asking what one intervention can return, this analysis asks what it costs the movement to cover the industry as a whole.
Between 2000 and 2023, the aquaculture industry grew 3.4 times in individual count, but the number of species comprising 85% of the industry grew from 14 to 22, a 57% increase. Each of the 8 new species requires independent context specific welfare research, field studies, and implementation infrastructure that must take place before an animal in that population is meaningfully helped.
Some regulatory instruments appear to sidestep this cost. Outcome-based standards like minimum dissolved oxygen thresholds, and prohibitions like banning CO₂ stunning, don't prescribe how producers must act. They shift the burden of finding a solution onto producers. But this relocates R&D costs rather than eliminating them, and it makes welfare outcomes hard to track (particularly where producers resist scrutiny of whether their chosen alternatives are actually welfare-positive). When chemical sea lice treatments were restricted for Atlantic salmon, farms shifted to thermal delousing and cleaner fish, both of which introduced serious welfare harms (thermolicers carry up to 19% mortality risk, and cleaner fish face significant welfare costs of their own). It seems possible that suffering from delousing efforts could have outweighed the suffering from the lice burden itself.
Identifying those harms required new research cycles and vast monitoring to detect, and this happened in the species with the most developed welfare infrastructure in aquaculture. Where that infrastructure doesn't exist, the consequences of transferred interventions will be harder to detect. Assuming transferability without empirical validation means accepting outcomes that could be null, or worse than the status quo.
Neither outcome-based standards nor prohibitions structurally resolve the costs that a diversifying industry creates. Within any given target population, a well-researched and implemented intervention can still meaningfully reduce suffering. But when evaluated at the portfolio level, fragmentation has made the task measurably more expensive per animal over time, with the trajectory pointing toward further difficulty for at least half of the top 20 producing countries.
This analysis shows three things: fragmentation in aquaculture is structurally important for animal welfare, it has increased substantially over the past two decades, and for a majority of major producing countries the trajectory points toward further diversification. Taken together, this constitutes a structural constraint on the cost-effectiveness of direct welfare interventions as a whole that is worsening over time.
I’ve also done work together with Shloka Janapaty thinking about how species diversification will change over time. This will be shared in a follow up post!
This work was supported by the EA Animal Welfare Fund. Views expressed are my own.
I used AI assistance in drafting, editing, and writing the analysis code, which I supervised and reviewed.
Thank you to the following individuals for their time and feedback on this work: Lauri Torgerson-White, Becca Franks, Sagar Shah, Hannah McKay, Ben Stevenson, Haven King-Nobles, Jeff Sebo, Evan Boyar, and Constance Li.
See here for a discussion on the challenges of finding a "golden" stocking density.
For Atlantic salmon, the fish species with arguably the richest welfare research, establishing a welfare indicator toolkit required evaluating over 90 candidate indicators, differentiated by production system and life stage.
See here for methods and data.
For example, although Norway farms 6 different species, their production is dominated by Atlantic salmon, so their ENS is 1.4. Functionally their production is so monolithic that we can consider it as if they are farming 1.4 equally abundant species. Conversely, China has an ENS of 16.5, meaning their production fragments across populations equivalent to farming 16.5 species of equal size. Based on the ENS, this suggests a welfare intervention targeting one species could reach approximately 6% (1/16.5) of China's farmed animals on average, compared to approximately 70% (1/1.4) in Norway on average.
The diversity reported here is the most conservative scenario. ~20% of tonnage reported to FAO has no species specificity. The conservative scenario allocates these individuals to the dominant known species within the most specific available taxonomic group, searching first within the reporting country and year, then the country's full production history, then the broader region, and finally globally. This minimizes diversity by concentrating unknowns into already-dominant species.
Countries marked with an asterisk show consistent directional trends across NEI allocation scenarios but differ in the magnitude of change, indicating moderate sensitivity to NEI allocation assumptions. See methods for more details.
Does this account for the >1 trillion fish fry artificially propagated in China per year, a large share of which are probably fed live to mandarin fish? See my post here, and some (higher) estimates here. My sense is that these fish aren't counted in the FAO stats, because they're not slaughtered for food, and fish fed to mandarin fish are from a smaller number of species. From my post:
Li and Xia (2018) wrote “Almost all prey for mandarin fish is provided through artificial propagation”, and single out mud carp as the favourite feed fish, although others are reported elsewhere, e.g. FAO:
And “silver carp, bighead, grass carp, Wuchang fish or tilapia fry” (Kuanhong/FAO, 2009).
Thanks for linking to your post! I rely solely on FAO-reported tonnage here and assume market-size animals destined for human consumption when converting live weights to individual counts. Feed fish are a structurally distinct welfare context I don't really account for here, and probably needs a different intervention approach altogether.