Content information: This post discusses that lives can be valued negatively by intended beneficiaries.
TLDR: GiveWell can include the sign of life quality variable in its analyses.
Centre for Pesticide Suicide Prevention (CPSP)
In January 2021, GiveWell recommended an approximately $7 million general support grant for the Centre for Pesticide Suicide Prevention (CPSP). The Centre supports the deregistration of pesticides commonly used in suicide.
GiveWell assumes that the Centre accelerates the pesticide deregistration by 9 years in each of the countries of operation. The number of lives saved is calculated as the difference between the numbers of lives saved in different policy scenarios weighted by these scenarios' probabilities and the counterfactual improvement in pesticide suicide rates, as extrapolated from past trends. 25,938 lives are expected to be saved.
The assumption that the intended beneficiaries would otherwise suicide can suggest that they value their lives negatively.
GiveWell assumes that as a result of the pesticide deregistration [edit based on a comment: and agricultural productivity decrease, the expected value of the program falls by 30%. The productivity decrease can be much lower than 30%, around low units of percent.] The effects of this estimated productivity decrease on the quality of the intended beneficiaries’ lives are not discussed.
CPSP-promoted pesticide bans would affect entire nations with large farming populations, who live in extreme and national poverty. A 30% decrease in yield can result in increased hunger levels and decreased income levels, which can negatively affect the health and quality of life of millions of people.
If the decreases in health and life quality cause a large percentage of farmers to value their lives negatively, support of CPSP can cause millions of people to live dissatisfied.
Thus, while CPSP is expected to save thousands of lives, it can also cause [edit: millions an unknown number of people] to live dissatisfied.
Malaria vaccination in Kenya
(Edit based on a comment: The 2022 World Happiness Report (WHR) (p. 19) estimates 'happiness' in Kenya as 4.5/10.) The Measuring people’s preferences IDinsight survey (edit: which shows values lower than similar reports) cites 2.3/10 (p. 42). If the neutral point, “the point where someone is neither satisfied nor dissatisfied,” is above (edit: 2.3/10–4.5/10), reducing mortality in Kenya by malaria vaccination can save lives of dissatisfaction.
A small-scale (n=30) survey that I conducted in early 2021 in a Kenyan slum suggests that many respondents can value their lives negatively. Respondents were asked to label death and their quality of life on a visual analog scale (arrow) from the worst and the best imaginable situation. If worst corresponds to -1, death to 0, and best to 1, the average quality of life was -0.18, with a standard deviation of 0.40 (column AC). On average, respondents wanted to live 13 additional years (SD=26), while the median was 2 additional years.
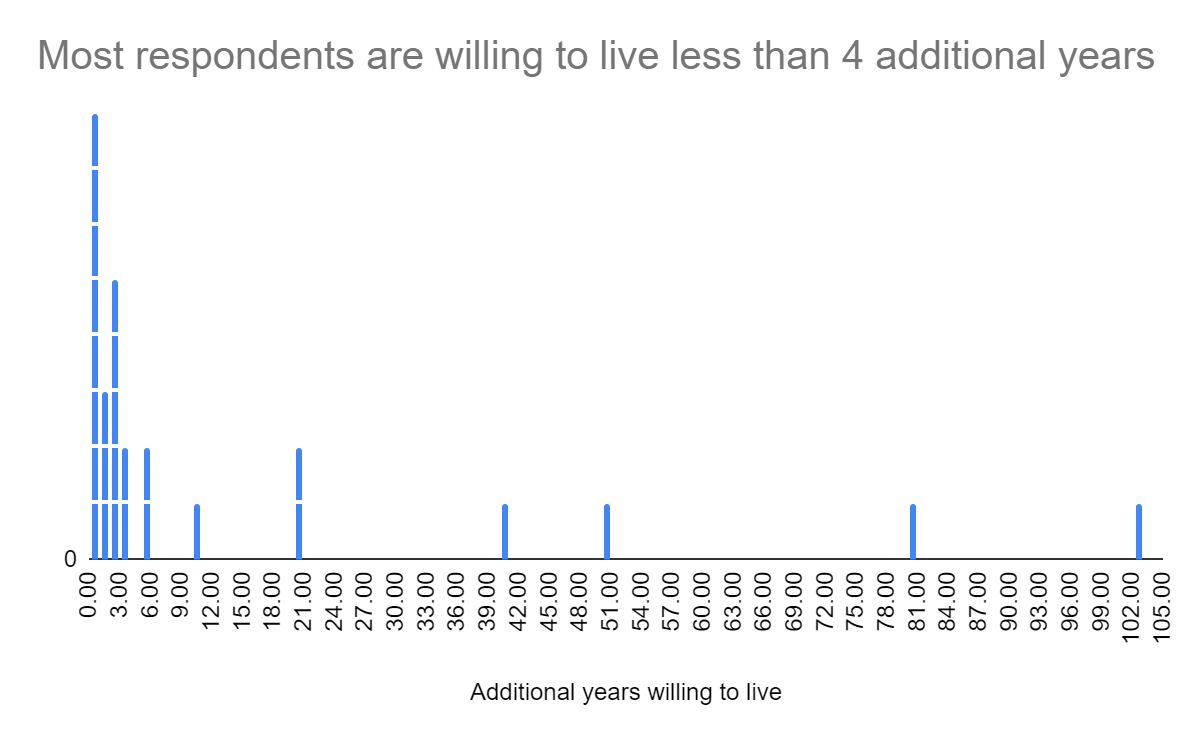
The wording of the quality of life questions and their survey context can be assessed as leading, which can suggest low quality of data.
If you mai[n]tain your lifestyle and the future is what you expect it to be, how many more years starting from now do you want to live? You can say anything from 0 to forever.
Where do you place death on this arrow? Please put a line there and write "0." … Where do you place yourself on this arrow? Please put a line there and write "myself."
A local enumerator familiar with the area collected the data, while knowing that it is gathered for informational purposes only, without a possible benefit of answering in any specific way. While some (globally poor) respondents accepted a small stipend for their time (which is a custom in the area), many were happy to share their responses without a stipend. This can suggest that respondents answered relatively honestly, with little experimenter bias.
This survey shows that the quality of life in a Kenyan slum can be valued negatively by the respondents. The quality of life in areas of Kenya that are prioritized for malaria vaccination can be different in sign, for example due to urban-rural disparities. Further research on the expected sign of life quality of intended malaria vaccination beneficiaries (considering possible philanthropic and market co-interventions) can inform whether, when, and to whom GiveWell should recommend the scale up of this pilot.
Conclusion
GiveWell can consider incorporating a variable on the sign of the quality of life from the perspective of intended beneficiaries in their Centre for Pesticide Suicide Prevention and malaria vaccination analyses. The inclusion of this variable in GiveWell's analyses can inform whether programs that "save or improve" lives should be prioritized.
This will be huge if true. Fortunately it is probably not true. My guess is that you got the 30% figure from this quoted text:
My process is that I searched for "30%" in the linked article, here's the relevant excerpts:
(In context Givewell seems to assume a mean of 0.3% decrease in expected agricultural productivity, and a median of 0%. This is >=100 times lower than 30%)
I genuinely appreciate the reasoning transparency and epistemic legibility illustrated in your article that made it easy for me to pinpoint the presumed error.
TLDR: Sure, the 30% seems quite high, although if the price of alternative fertilizer is around double, it could be accurate for many subsistence farmers.
I have the 30% from this cited text and the BOTEC. In the sheet, 30% seems to be subtracted from the overall cost-effectiveness that considers qualitative adjustments (E77 in "Calculations"). "Calculations" E58 specifies 70% adjustment due to -30% due to risk of agricultural harm ("Assumptions" E36). This 70% multiplies other qualitative adjustments (E60), which multiply the cost-effectiveness before qualitative adjustments (E76) to get cost-effectiveness after adjustments (E77).
The number does seem high, though, especially considering that substitutes seem available. However, it may also be accurate, if farmers are able to afford less fertilizer due to its higher price. One Acre Fund (OAF) RCT-based analysis cites about 50% improvement in yield (in a different region) when farmers are given a loan to purchase (and trained to use) fertilizer and improved seed variety (fertilizer:seed cost is about 2:1[1]). Based on anecdotes from The Last Hunger Season, some farmers cannot afford fertilizer.
The price difference between the highly hazardous pesticides and alternatives is not stated, although pesticides constitute only 7.5% of input costs. However, the document (pp. A-12 - A-13 or 58-59 in the pdf) cited by GiveWell that gathers statistics on farm inputs considers relatively high costs for farm labor and land rent which in the case of subsistence farmers can be neglected (thus the cost would be much higher than 7.5%). There is also very high variance among states in India. Some states seem to use much less fertilizer (e. g. 2.5% of seed costs in Mizoram) than others (39% of seed costs in Andhra Pradesh). Thus, it is unclear to what extent any increases in fertilizer price affect yield.
Further, GiveWell cites that
Farmers in "The Last Hunger Season" were not trained in fertilizer use prior to the OAF program. It can be that farmers who pay attention to using fertilizer correctly will do so even if another type is offered and vice versa. India's growing network of rural e-centers with agricultural information can provide appropriate fertilizer information. In other countries of CPSP operations, farmers may be less informed. Thus, any decrease in agricultural productivity due to unfamiliar fertilizer use can be limited.
A professor conducted research on the substantiation of sentiments on counterfeiting. It could be possible that when a new type is introduced, farmers will be suspicious. This can be temporary or have limited effect (trust in local retailer not brand).
(More costly) fertilizer can also substitute other items that increase life quality, such as food, education, or health. Thus, even if a higher cost does not lower yields, the -30% (or other) adjustment could still be valid due to the effects of counterfactual spending.
I understand that GiveWell is assuming a 0.3 agricultural productivity decrease high estimate and 0 or 0.01 low estimate. The high estimate is used, while numbers with 0 decrease are cited next to the adjusted ones, possibly due to high uncertainty about the complex effects on agriculture.
So far, I only considered the effects on smallholders. Effects on industrial farms may be much more substantial, even if the price difference is in the order of percent. I assume that in India, most farms are subsistence. That should be 85% (by land holdings?) in Uttar Pradesh. I further assume that industrial productivity is about 5-10x that of subsistence farm (about 1/2-1/3 of land can be used in subsistence compared to commercial and productivity can be about 2-3x lower). This would suggest that commercial farms produce about as much (Fermi estimate) as subsistence farms (15%*5=75%≈85% or (15%*10=150%≈1.8*85%).
In areas where subsistence farmers use little chemical fertilizer, productivity decrease can be negligible (and much lower than that in commercial agriculture). Conversely, in regions where smallholders spend significant proportions on fertilizer, they can be affected disproportionately more than industries. The former suggests that the median would be close to 0 and mean would be the average of the commercial effects and 0 (e. g. 2% if commercial outputs fall by 4%). The latter can suggest a median value of >30% and mean value of the half of that.
The median would be 30% and mean around 0 if few farmers constitute a large majority of output and are relatively unaffected, while the majority of smallholders are affected significantly. This is what makes intuitive sense, upon the assumption that industrial agriculture largely outperforms subsistence in output and can flexibly (with negligible per unit cost) switch to alternative (or is already using it). However, this can be a biased perspective based on the knowledge of US and other developed economies' agriculture. While the rapidly industrializing India is the largest nation among CPSP partners, other beneficiary countries can be less industrialized.
Secondary effects from forgone commercial agriculture taxation (as well as any decreases in International competitiveness of beneficiary nations) that can support large proportions subsistence farmers could be discussed.
Lower fertilizer use could lead to higher rents accrued to farmers, if their product is sold as organic with a premium.
Another consideration is that CPSP on its previous website cited investigating the possible negative effects on agricultural productivity in Sri Lanka (listing this on the website can suggest a significant concern). This can be considered in conjunction with GiveWell's cited enthusiasm and great fit of the professor who leads the project/applied for the grant (he could be motivated to gather and interpret evidence in a way that highlights benefits and unhighlights risks).
The effects of highly hazardous pesticides on agricultural productivity (and the impact on populations) will depend on the
Guessing these values, measuring productivity in real local currency units and considering effects only on smallholders, based on the above discussion, the decrease can have a mean of 0.04 with SD=0.02 and be normally distributed, with possible other distributions based on country or region.
One Acre Fund provides $75-80 loans for fertilizer and seeds. 10kg of improved corn seeds costs 70,000 UGX. 10-15kg is needed for an acre (used 100,000 UGX or about $25). Based on the book and confirmed by Global Partnerships, the average farm size is about one acre. $25/$75=1/3, so about 1:2.
I should be clearer. Givewell did not assume a 30% decrease in agricultural productivity anywhere. The 30% reduction is to total expected value of the intervention from a 0.3% (by my inference, not directly stated) reduction in agricultural productivity.