Executive summary: The author estimates the total welfare of many biological populations by assuming individual welfare scales with basal metabolic rate (BMR) raised to an uncertain exponent, concluding that under plausible assumptions soil organisms, microorganisms, or trees could dominate total welfare and that reducing uncertainty about interspecies welfare comparisons could substantially change funding priorities.
Key points:
The author assumes individual (expected hedonistic) welfare per fully-healthy-organism-year is proportional to “BMR at 25 ºC” raised to an exponent between 0 and 2, and treats exponents from 0.5 to 1.5 as plausible best guesses.
Using population sizes, estimated living conditions, and BMRs, the author finds that total welfare rankings across humans, farmed animals, wild animals, trees, soil animals, and microorganisms vary dramatically with the exponent.
For exponents of 0.5, 1, and 1.5, soil bacteria and archaea or trees often have the largest absolute total welfare, sometimes exceeding human welfare by orders of magnitude.
The author argues that uncertainty about interspecies welfare comparisons is severely underestimated and that prioritisation across populations matters least around an exponent of 1.07.
They claim that current welfare-weighting approaches, such as AIM’s and ACE’s estimates for shrimps, may overstate shrimp welfare by several orders of magnitude under BMR- or neuron-based comparisons.
The author recommends funding further research on interspecies comparisons of expected hedonistic welfare, particularly via restricted funding to Rethink Priorities, and expresses pessimism about interventions affecting soil animals due to dominant uncertainty from microorganisms.
This comment was auto-generated by the EA Forum Team. Feel free to point out issues with this summary by replying to the comment, andcontact us if you have feedback.
I recommend decreasing the uncertainty about how the individual (expectedhedonistic) welfare per unit time of different organisms and digital systems compares with that of humans. In particular, I recommend supporting Rethink Priorities (RP) via restricted funding. [...] I committed donating 2 k$ to RP for them to scope out whatever projects they believe would decrease the most cost-effectively the uncertainty about how the individual welfare per unit time of different organisms and digital systems compares with that of humans.
Do you think "whatever projects RP believes would decrease the most cost-effectively the uncertainty" would address your reasons for uncertainty? I haven't yet taken the time to comprehend the details of your current views on hedonistic P(sentience)-adjusted welfare ranges, but I get the sense that your sources of uncertainty on this are not the same as RP's.
I am not confident I am aligned with RP in terms of which projects to fund. However, my commitment was just for them to scope out projects. Based on their research agenda on valuing impacts across species, I think it is likely I would find some sufficiently promising for me to fund them.
My commitment was also related to decreasing uncertainty about individual (expectedhedonistic) welfare per unit time. I would not want RP to scope out projects addressing non-hedonistic considerations.
In your linked context for assuming a correlation between welfare and BMR^Exp you talk about neurons. How do you justify expanding this assumption to organisms without neurons?
Hi Aleph. I believe i) individual welfare per fully-healthy-animal-year being proportional to "individual number of neurons"^"exponent of the individual number of neurons" for some animals is a reason for testing extending i) to all animals. Likewise, I think ii) individual welfare per fully-healthy-animal-year being proportional to "BMR"^"exponent of the BMR" for some organisms (which I see as a possibility for the reasons I provide in the comment) is a reason for testing extending ii) to all organisms.
Do you have an underlying causal model for why BMR^Exp1 and IW/FHAY could be generally correlated beyond being correlated through the indirect connection BMR^Exp2 ∝ Neuron Count and NC^Exp2 ∝ Welfare ?
Do you have theories of consciousness that could give a model for how organisms without neurons could have hedonic experiences?
Naively I would assume that the correlation between BMR^Exp1 and IW/FHAY is completely explained through the connection through the neuron count variable and extending the model to organisms without neurons would be fallacious.
I share some thoughts below. I still have very little confidence in my modelling of the individual welfare per fully-healthy-organism-year. However, I think this strengthens my redommendation of decreasing the uncertainty about how the individual welfare per unit time of different organisms and digital systems compares with that of humans.
Do you have an underlying causal model for why BMR^Exp1 and IW/FHAY could be generally correlated beyond being correlated through the indirect connection BMR^Exp2 ∝ Neuron Count and NC^Exp2 ∝ Welfare ?
Producing welfare requires energy, and the output of a Cobb–Douglas production function, which is typically used in economics, is proportional to "input 1"^"exponent 1"*"input 2"^"exponent 2"*...*"input N"^"exponent N". A greater energy consumption also means more room to process information, and I think this is necessary to produce welfare.
Nitpick. The exponents in the last sentence above should be different.
Do you have theories of consciousness that could give a model for how organisms without neurons could have hedonic experiences?
Here are Gemini's 10 most credible theories of consciousness that do not require biological neurons, and 10 most credible that predict bacteria have a probability of consciousness above exactly 0.
Naively I would assume that the correlation between BMR^Exp1 and IW/FHAY is completely explained through the connection through the neuron count variable and extending the model to organisms without neurons would be fallacious.
You may well be right. Yet, I believe my recommendation stands even if one is certain that all organism without biological neurons have an expected welfare per unit time of exactly 0.
This post is co-authored with Ben Garfinkel. It is cross-posted from the CEA blog. A PDF version can be found here.
Summary: Some strategic decisions available to the effective altruism m...
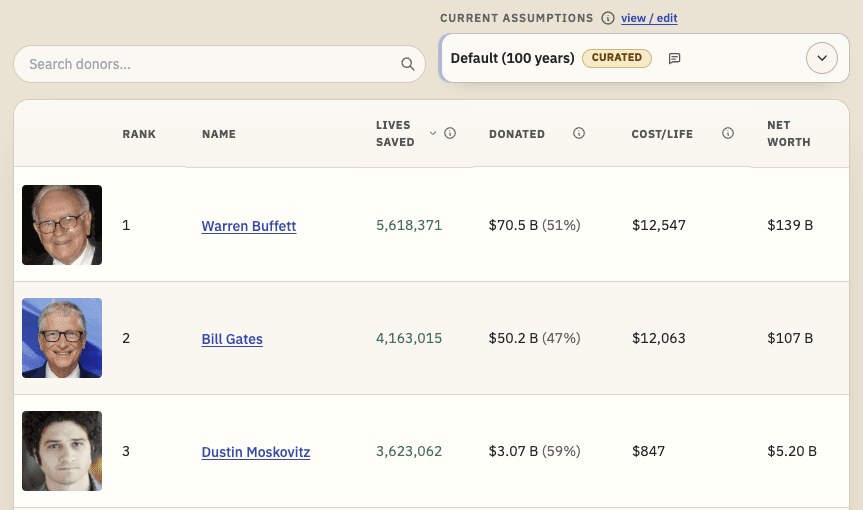
TL;DR: I'm releasing a website that ranks philanthropists according to EA principles and research, and allows users to re-rank the list using their own assumptions. I'd like feedback and help making it better. I'd especially like ideas for how to make the results more trustworthy. Funding may be available.
I recently built Impact List (impactlist.xyz), a site which ranks people by their positive impact via donations.
The goal is t...
Disclaimer: Although I work on the Groups Team at CEA, I’m writing this in a personal capacity, and this post does not constitute an endorsement by CEA.
Agency - the realisation that you really can just do things.
TL;DR
Biosecurity needs people (of any background) who are agentic and have a high execution velocity and track record....
I calculate the total welfare of organism populations assuming individual (expectedhedonistic) welfare per fully-healthy-organism-year is proportional to “basal metabolic rate (BMR) at 25 ºC”^“exponent of the BMR”, where the BMR is the energy spent per unit time by any organism at rest. Here is relevant context about my assumption. For an exponent of:
0, the individual welfare per fully-healthy-organism-year is equal to the welfare per fully-healthy-human-year, 1 QALY/organism-year.
1, the individual welfare per fully-healthy-organism-year becomes 10 times as large when the BMR at 25 ºC becomes 10 times as large.
2, the individual welfare per fully-healthy-organism-year becomes 100 (= 10^2) times as large when the BMR at 25 ºC becomes 10 times as large.
I estimate the following total welfare for exponents of 0.5, 1, and 1.5:
For cattle, hens, broilers, and farmed finfishes, -4.59, -0.341, and 0.375 times that of humans.
For farmed black soldier fly (BSF) larvae, mealworms, and shrimps, -0.625, -0.00137, and -3.00*10^-6 times that of humans.
For trees, 110, 34.0, and 10.6 times that of humans.
For wild birds, mammals, and finfishes, -75.1, 0.0519, and 0.0253 times that of humans.
For soil bacteria and archaea, -64.2 billion, -389, and -2.36*10^-6 times that of humans.
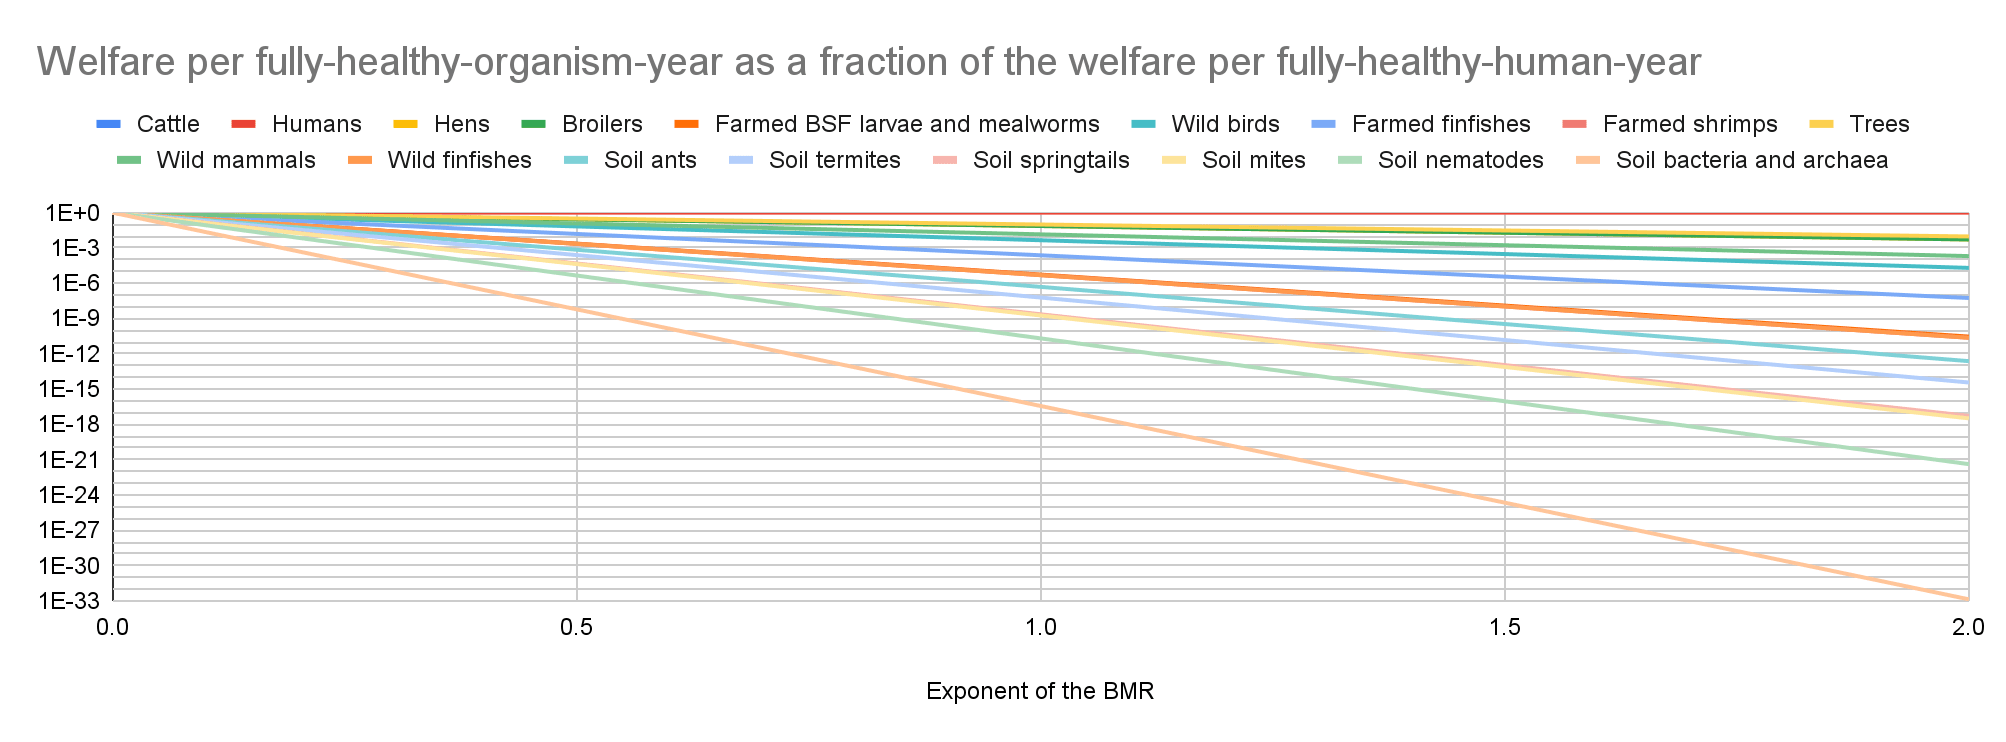
I guess exponents from 0.5 to 1.5 lead to reasonable best guesses under my assumption that individual welfare per fully-healthy-organism-year is proportional to “BMR at 25 ºC of the organisms”^“exponent of the BMR”. I do not know whether this is the case, which means my results underestimate uncertainty, but I do not rule it out. So I conclude any of the following are reasonable views, although not the only ones (I use |x| for the absolute value of the total welfare of x, and << for “is smaller than 10 % of”). For an exponent of:
I recommend decreasing the uncertainty about how the individual (expectedhedonistic) welfare per unit time of different organisms and digital systems compares with that of humans. In particular, I recommend supporting Rethink Priorities (RP) via restricted funding.
I think the above research has lots of room to change funding decisions even neglecting soil animals and microorganisms. For example, Ambitious Impact’s (AIM’s) estimates of suffering-adjusted days (SADs), which are used at least by them and Animal Charity Evaluators (ACE), are proportional to the (expected) welfare range, the difference between the maximum and minimum welfare per unit time, and their welfare range of shrimps is 19.9 % of that of humans (you can ask Vicky Cox for the sheet). However, I would say a much better best guess could be10^-6 of that of humans, the ratio between the number of neurons of shrimps and humans, or 4.79*10^-6, the ratio between the BMR at 25 ºC of shrimps and humans. Using this would lead to benefits to shrimps 0.00241 % of those estimated by AIM and ACE, which I believe would justify decreasing the funding targeting shrimps by more than 90 %.
I had recommended research informing how to increase the welfare of soil animals, but I am now more pessimistic about this. I have very little idea about whether existing interventions which robustly increase the welfare of humans or non-soil animals increase or decrease animal welfare due to potentially dominant uncertain effects on soil animals. Likewise, I do not know whether hypothetical interventions which robustly increased the welfare of soil animals would increase or decrease welfare due to potentially dominant uncertain effects on soil microorganisms.
Introduction
I estimated the total welfare of animal populations assuming individual (expectedhedonistic) welfare per fully-happy-animal-year is proportional to “number of neurons”^“exponent of the number of neurons”. In this post, I repeat a similar analysis based on the basal metabolic rate (BMR) at 25 ºC, which allows me to cover microorganisms and trees. These do not have neurons, and therefore would have no welfare under my past approach. However, I am not certain they are not sentient, and I suspected the absolute value of the total welfare of bacteria and archaea is much larger than that of animal populations.
BMR is “the rate of energy expenditure per unit time by endothermic animals at rest”. These are animals like birds and mammals that maintain their body at a metabolically favorable temperature. In this post, I use BMR to refer to the energy spent per unit time by any organism at rest.
Methods
Overview
I estimate the total welfare of each group of organisms multiplying its population and individual welfare per unit time. I calculate this from the product between the following:
Individual welfare per organism-year as a fraction of the individual welfare per fully-healthy-organism-year. This describes the quality of the living conditions. It is 1 for fully healthy organisms, and 0 for ones with neutral lives.
Individual welfare per fully-healthy-organism-year as a fraction of the welfare per fully-healthy-human-year. This is the factor enabling comparisons across species. It is 1 for humans, and would be 0 for organisms with a probability of sentience of 0. The welfare per fully-happy-human-year is 1 QALY.
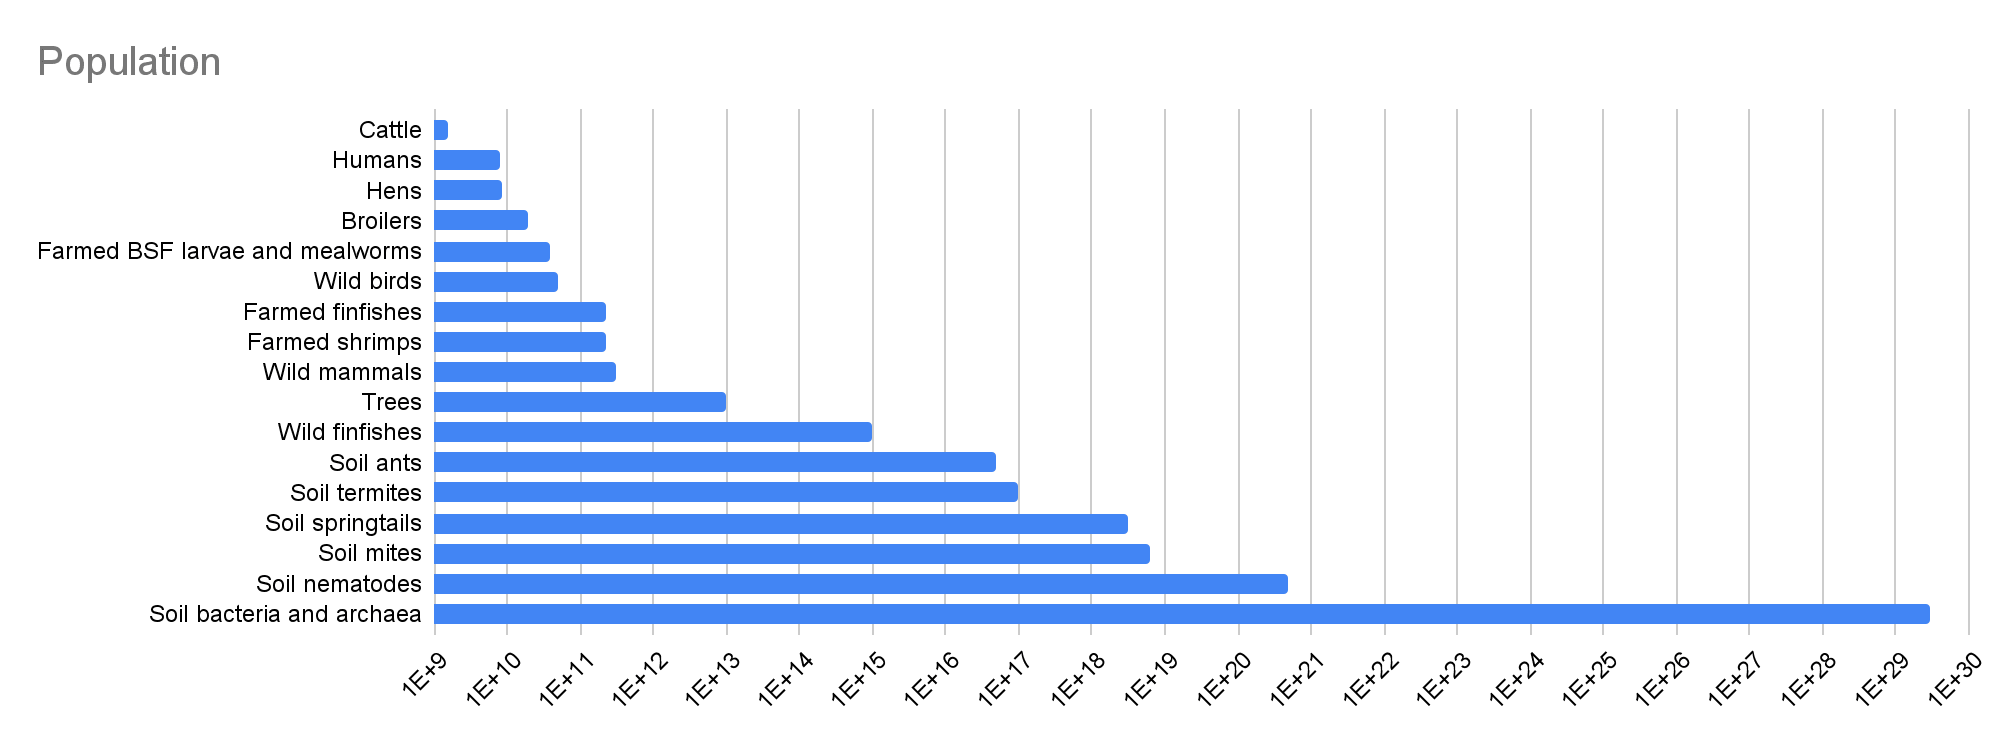
Here are my values for the population, from the smallest to largest:
1.58 billion cattle, as reported by the Food and Agriculture Organization (FAO) for 2023.
8.09 billion humans, as estimated by the United Nations (UN) for 2023.
18.8 billion broilers, which is the difference between the 27.2 billion chickens and 8.44 billion hens reported by FAO for 2023. This difference includes the breeders of laying hens, but I guess excluding this would barely decrease the number of broilers.
38.2 billion farmed black soldier fly (BSF) larvae and mealworms, as estimated by Hannah and Sagar for 2022.
50 billion wild birds, in agreement with Callaghan et al. (2021). “By aggregating the species-level estimates, we find that there are ∼50 billion individual birds in the world at present”.
223 billion farmed finfish, as estimated by Hannah McKay and Sagar Shah for 2022.
230 billion farmed shrimps, as estimated by Hannah and Sagar for 2020.
316 billion wild mammals, which is the geometric mean of the lower and upper bound estimated by Brian Tomasik of 100 billion and 1 trillion.
10^15 wild finfishes, in agreement with Table S1 of Bar-On et al. (2018).
5*10^16 soil ants, as mentioned in Rosenberg et al. (2023). “Our estimated global population of nonarboreal ants, considered as part of the soil and plant litter habitat, is 5 × 10^16 (uncertainty range, 1 × 10^16 to 9 × 10^16) individuals”.
10^17 soil termites, as shared by Yuval Rosenberg, the 1st author of Rosenberg et al. (2023). “We estimate their population to be about 10^17 with a 2-fold uncertainty”.
3.17*10^18 soil springtails. This is the product between:
10^19 soil arthropods from Rosenberg et al. (2023). “there are ≈1 × 10^19 (twofold uncertainty range) soil arthropods on Earth”.
95 % of soil springtails and mites among soil arthropods from Rosenberg et al. (2023). “there are ≈1 × 10^19 (twofold uncertainty range) soil arthropods on Earth, ≈95% of which are soil mites and springtails”.
1/3 (= 1 - 2/3) of soil springtails among soil springtails and mites from Rosenberg et al. (2023). “The [soil] microarthropods, mites and springtails, account for >95% of the total population of soil arthropods, with about two-thirds of these being mites". I confirmed with the 1st author “>95%” is supposed to mean “≈95%”, which is what is mentioned in the abstract”.
6.33*10^18 soil mites. This is the product between:
10^19 soil arthropods from Rosenberg et al. (2023).
95 % of soil springtails and mites among soil arthropods from Rosenberg et al. (2023).
2/3 of soil mites among soil springtails and mites from Rosenberg et al. (2023).
4.89*10^20 soil nematodes. This is the ratio between:
4.4*10^20 soil nematodes from van den Hoogen et al. (2019). “The resulting maps show that 4.4 ± 0.64 × 10²⁰ nematodes (with a total biomass of approximately 0.3 gigatonnes) inhabit surface soils across the world”. They “focus on the top 15 cm of soil, which is the most biologically active zone of soils”, and Stefan Geisen, the 2nd author, clarified they focussed on the most active layer, which was sometimes more or less than 15 cm.
90 % of nematodes in the top 15 cm of soil among soil nematodes, which is a guess from Stefan.
Here are my values for the individual welfare per organism-year as a fraction of the individual welfare per fully-healthy-organism-year, from the lowest to highest:
-8.77 for farmed shrimps, as I hadestimated for shrimps on an ongrowing farm with air asphyxiation slaughter.
-5.38 for farmed finfishes, which is the sum between 25 % of my value for broilers, 25 % of my value for hens, and 50 % of my value for farmed shrimps.
-2.27 for broilers, as I hadestimated for broilers in a conventional scenario.
-1.69 for hens, as I hadestimated for hens in conventional cages.
-0.25 for farmed BSF larvae and mealworms, wild finishes, and soil ants, termites, springtails, mites, nematodes, bacteria, and archaea, which is my speculative guess.
0.25 for trees, which is my speculative guess.
1/3 for cattle, and wild mammals and birds, which is my speculative guess.
Individual welfare per fully-healthy-organism-year
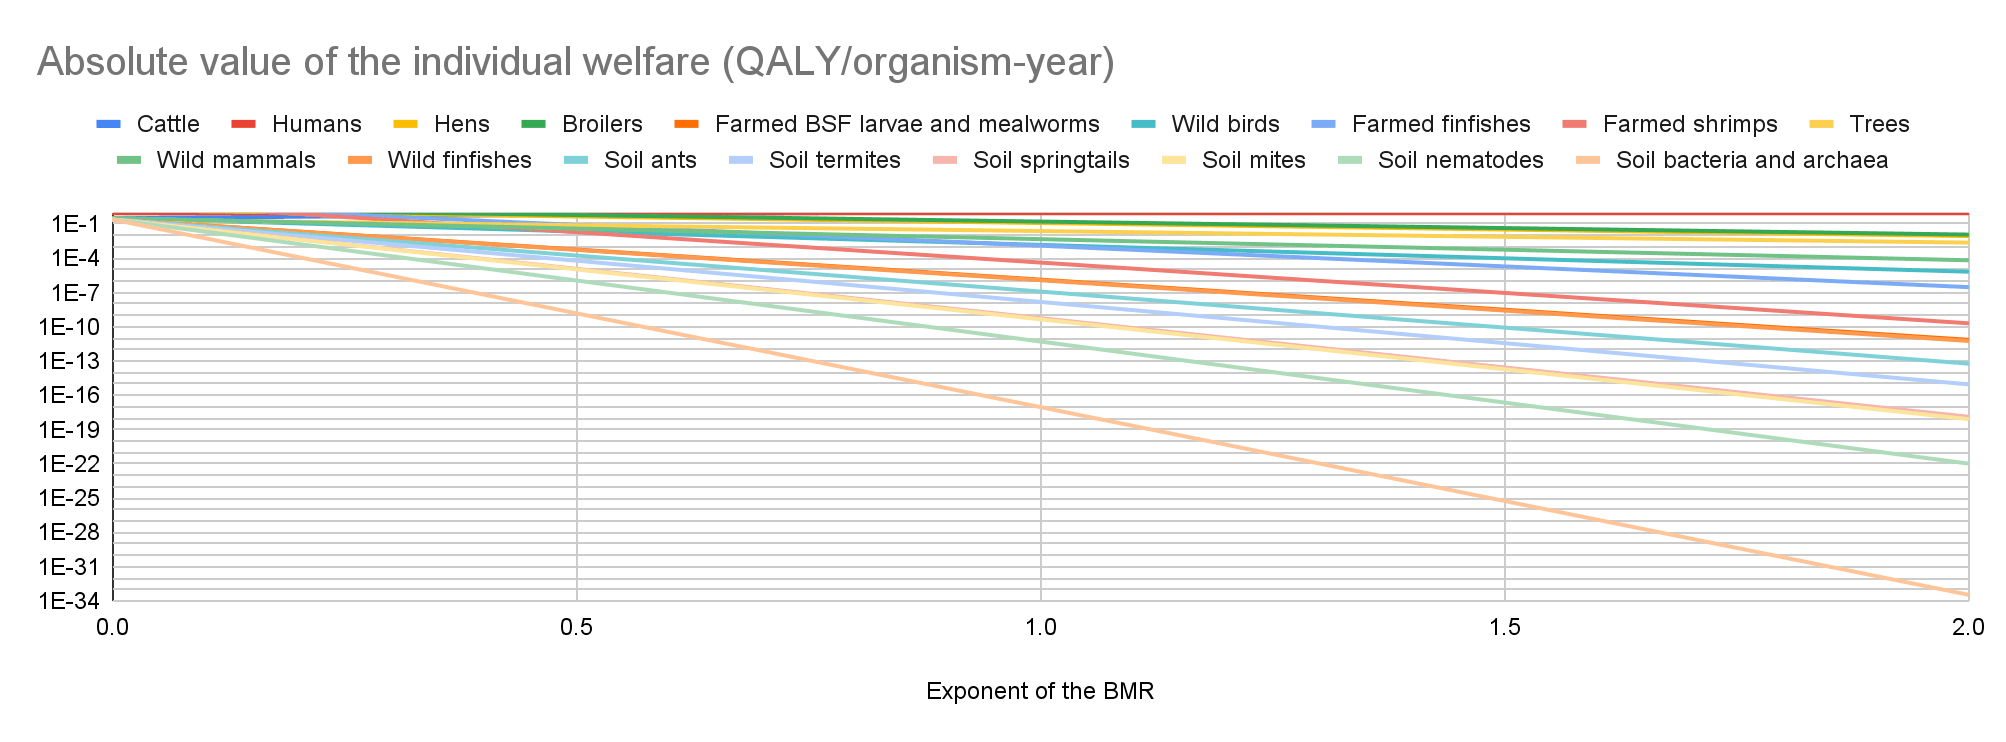
I assume the individual welfare per fully-healthy-organism-year as a fraction of the welfare per fully-healthy-human-year is equal to (“BMR at 25 ºC of the organisms”/“BMR at 25 ºC of humans”)^“exponent of the BMR”, with this exponent ranging from 0 to 2. Here is relevant context about my assumption. For an exponent of:
0, the individual welfare per fully-healthy-organism-year is equal to the welfare per fully-healthy-human-year, 1 QALY/organism-year.
1, the individual welfare per fully-healthy-organism-year becomes 10 times as large when the BMR at 25 ºC becomes 10 times as large.
2, the individual welfare per fully-healthy-organism-year becomes 100 (= 10^2) times as large when the BMR at 25 ºC becomes 10 times as large.
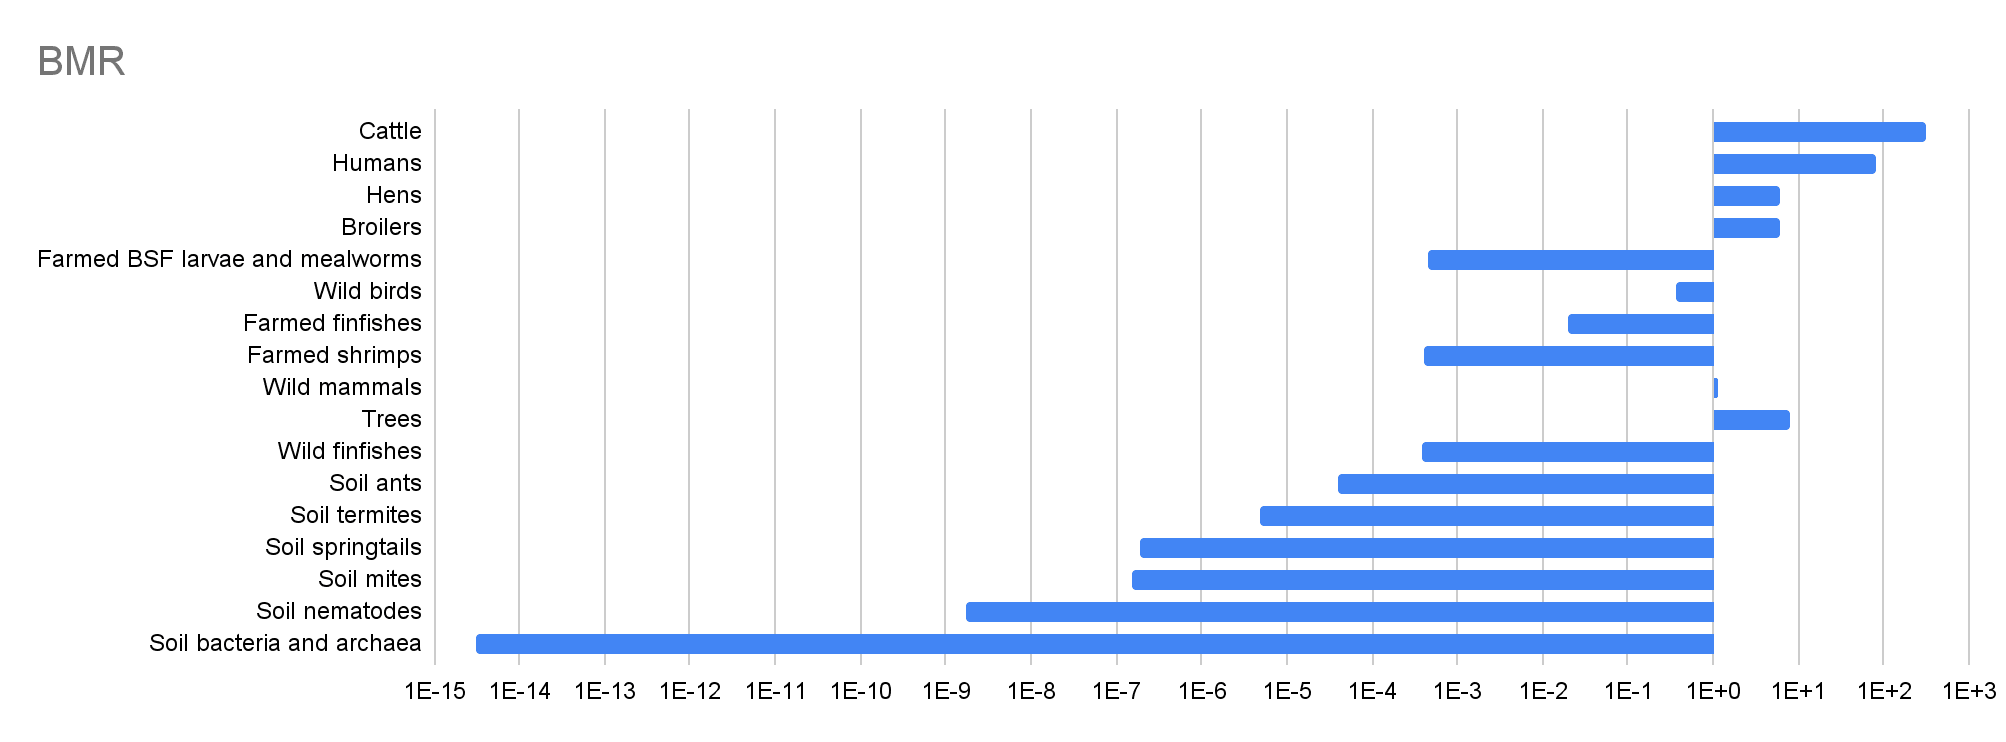
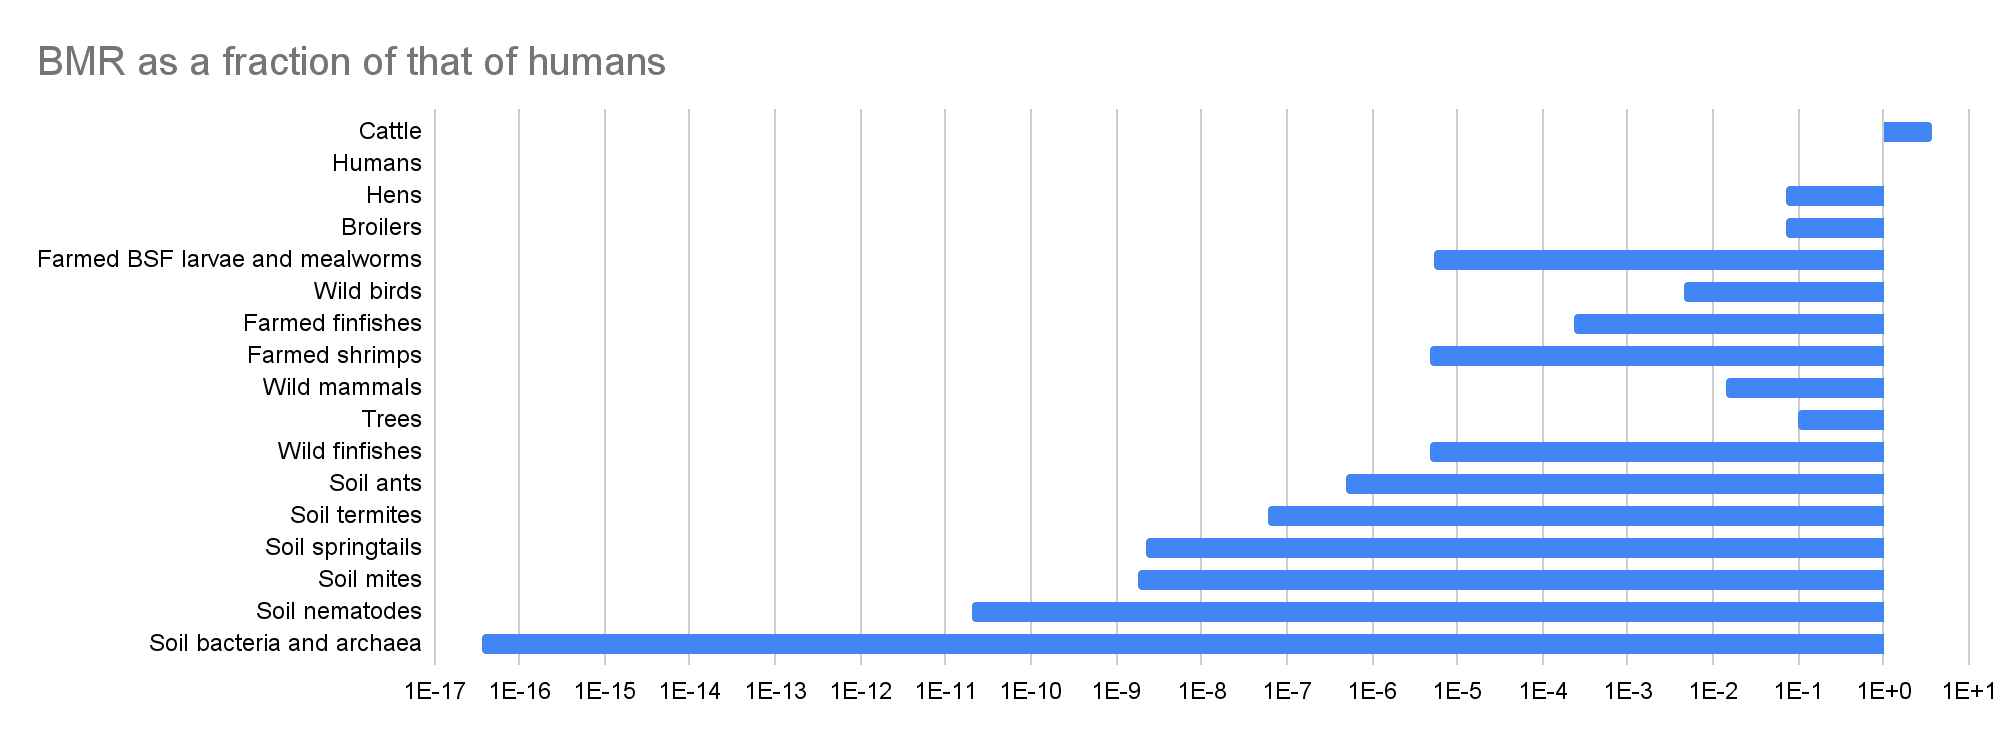
I use the following values for the BMR at 25 ºC, from the highest to lowest:
82.8 W for humans, as for Homo sapiens in Hoehler et al. (2023).
8.00 W (= 80*10^12/(10^13)) for trees. This is the ratio between the 80 TW of power needed for their autotrophic respiration presented in Table 1 of Hoehler et al. (2023), and my estimate for their population.
5.96 W for hens and broilers, as for Gallus gallus (red junglefowl) in Hoehler et al. (2023). That is the species of domesticated chickens.
1.17 W for wild mammals, as for Rattus norvegicus (brown rat) in Hoehler et al. (2023). That is the most abundant mammal species.
0.369 W for wild birds, as for Passer domesticus bactrianus (Turkestan House Sparrow) in Hoehler et al. (2023). That is a subspecies of the house sparrow, and this is the most abundant bird species (population of 1.6 billion) according to Callaghan et al. (2021), which is my source for the population of wild birds.
0.0194 W for farmed finfishes, as for Misgurnus fossilis (weatherfish) in Hoehler et al. (2023). That is the only species in the dataset which has the same genus as Misgurnus anguillicaudatus (pond loach or oriental weatherfish), which, according to a 2020 report from the Fish Welfare Initiative (FWI), “is by far the most produced fish worldwide with over 11.5 billion individuals alive on farms at any given point”. FWI cites an estimate from Coefficient Giving (CG) obtained in 2016 of 11.7 billion (slightly above FWI’s number).
4.45*10^-4 W for farmed BSF larvae and mealworms, which is the mean of the 24 values for the orderDiptera (flies) in Hoehler et al. (2023), which range from 1.53*10^-5 to 3.04*10^-3 W. Gemini 3 Thinking on 29 December 2025 guessed 5.0*10^-4 W for farmed BSF larvae.
3.97*10^-4 W for farmed shrimps, which is the mean of the 2 values for the familyPenaeidae (penaeid shrimp) in Hoehler et al. (2023), which are 3.10*10^-4 and 4.83*10^-4 W. That family includes Litopenaeus vannamei (whiteleg shrimp) and Penaeus monodon (giant tiger prawn), and these are the 2 species accounting for the most production of farmed shrimp. “In fact, vannamei shrimp (Litopenaeus vannamei, often called Pacific white shrimp) dominates the global shrimp farm output – roughly 80% of farmed production is this single species. The next biggest farmed species is the giant tiger prawn (Penaeus monodon), which makes up only about 9% of farmed volumes”.
3.96*10^-4 W for wild finfishes, which is the mean of the 10 values for the genus Cyclothone (bristlemouths or bristlefishes) in Hoehler et al. (2023), which range from 1.24*10^-4 to 0.00121 W. From Wikipedia, “Cyclothone is believed to be the most abundant fish genus on Earth, with estimates that there are up to a quadrillion individuals [10^15]”, which is the value I use for the population of wild finfishes.
4.02*10^-5 W for soil ants, which is the mean of the 46 values for the family Formicidae (ants) in Hoehler et al. (2023), which range from 1.10*10^-6 to 4.31*10^-4 W. From Wilkie et al. (2003), Pheidole “was the most abundant genus [the most often across collections] on the soil surface and beneath it (Figure 3)”, but it is not covered by Hoehler et al. (2023).
4.98*10^-6 W for soil termites, which is the mean of the 24 values for the family Termitidae (higher termites), which range from 6.00*10^-7 to 5.18*10^-5 W. That family covers the most soil termites according to Gemini 3 Thinking on 25 December 2025. From Wikipedia, it “is the largest family of termites [by number of species]”.
1.90*10^-7 W for soil springtails. Analysing Fig. 4 of Rosenberg et al. (2023) with a ruler, I determine soil springtails have a total dry mass of 17.3 Mt (= 1.8/5.2*50*10^6). This and my estimate for their population imply a dry mass per soil springtail of 5.46*10^-6 g (= 17.3*10^12/(3.17*10^18)). Eyeballing Fig. 6 of Petersen (1981), the mean oxygen consumption at 15 ºC across the 4 species of soil springtails analysed for that temperature for the aforementioned dry mass is 12.6 nL/h (= 10^(2/3)*20^(1 - 2/3)). For the ratio between energy and oxygen consumption of 20 kJ/L assumed in Hoehler et al. (2023), the BMR at 15 ºC is 7.00*10^-8 W (= 12.6*10^-9/60^2*20*10^3). From Tab. 4 of Petersen (1981), I determine the mean oxygen consumption at 10 ºC higher temperature (Q10 temperature coefficient) across 12 species is 2.72 (= (2.7 + 3.2 + 2.3 + 2.2 + 1.6 + 2.0 + 2.0 + 1.9 + 2.9 + 5.2 + 3.3 + 3.4)/12) times as high based on data for increases from 5 to 10, and 11 to 15 ºC. So I conclude soil springtails have a BMR at 25 ºC of 1.90*10^-7 W (= 7.00*10^-8*2.72^((25 - 15)/10)).
1.49*10^-7 W for soil mites. Analysing Fig. 4 of Rosenberg et al. (2023) with a ruler, I determine soil mites have a total dry mass of 26.7 Mt (= 2.8/5.25*50*10^6). This and my estimate for their population imply a dry mass per soil mite of 4.22*10^-6 g (= 26.7*10^12/(6.33*10^18)). From Equation [1] of Hoehler et al. (2023), the BMR is proportional to “individual carbon mass”^0.95 “when viewed over the entire tree of life”. In addition, their ratio between the carbon and dry mass is “generally taken to be 0.5 [constant across species]”. So I assume the BMR is proportional to “individual dry mass”^0.95 when viewed over the entire tree of life. Based on this, and my estimate that a random soil mite has 77.3 % (= 4.22*10^-6/(5.46*10^-6)) as much dry mass as a random soil springtail, I suppose soil mites have a BMR at 25 ºC equal to 78.3 % (= 0.773^0.95) of that of soil springtails. So I infer soil mites have a BMR at 25 ºC of 1.49*10^-7 W (= 1.90*10^-7*0.783).
1.69*10^-9 W for soil nematodes. From Table 1 of van den Hoogen et al. (2019), the total carbon mass of nematodes “on the top 15 cm of soil” is 0.0314 Gt. This and their estimate for the number of topsoil nematodes imply a mass of carbon per topsoil nematode of 7.14*10^-8 g (= 0.0314*10^15/(4.4*10^20)). Inputting this into Equation [1] of Hoehler et al. (2023), I conclude the BMR of soil nematodes is 1.69*10^-9 W (= 0.0104*(7.14*10^-8)^0.95).
3.05*10^-15 W for soil bacteria and archaea. From Figure 1 of Bar-On et al. (2018), the total carbon mass of bacteria and archaea is 77.0 Gt (= (70 + 7)*10^9). From the abstract of Flemming and Wuertz (2019), which is my source for the population of soil bacteria and archaea, there are 1.2*10^30 bacteria and archaea. So I calculate the carbon mass per organism among soil bacteria and archaea is 6.42*10^-14 g (= 77.0*10^15/(1.2*10^30)). Inputting this into Equation [1] of Hoehler et al. (2023), I conclude the BMR of bacteria is 3.05*10^-15 W (= 0.0104*(6.42*10^-14)^0.95).
Results
1E+N means 1*10^N. For example, 1E+2 means 1*10^2 = 100.
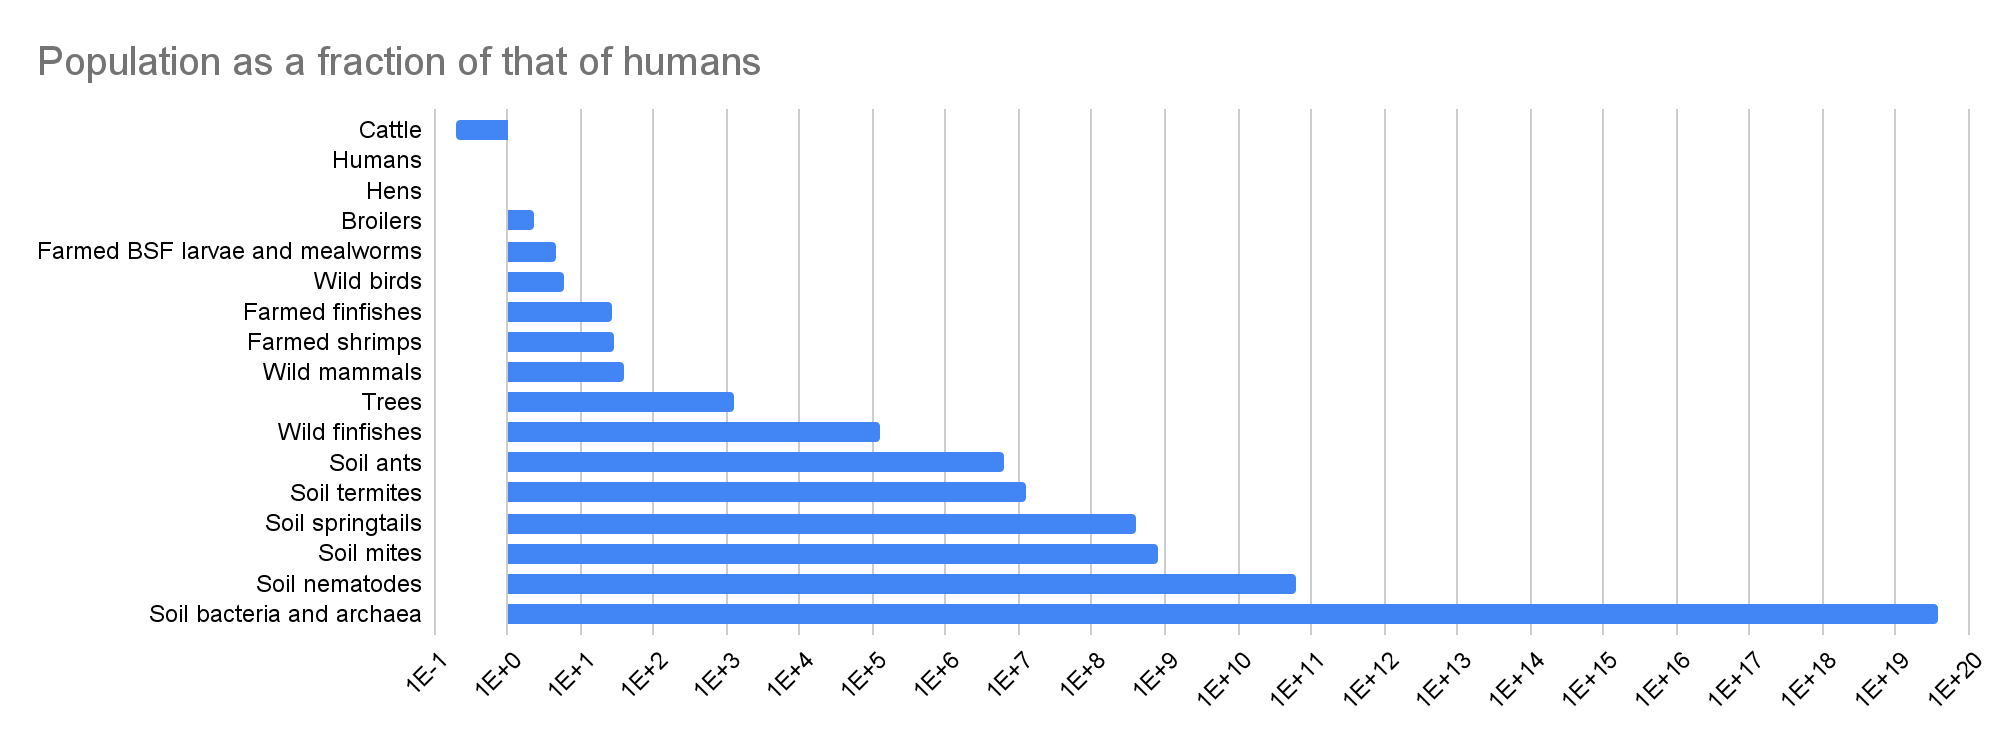
Population
BMR
Total BMR
Population, individual welfare per organism-year, and BMR
Organisms
Population
Population as a fraction of that of humans
Individual welfare per organism-year as a fraction of the individual welfare per fully-healthy-organism-year
BMR (W)
BMR as a fraction of that of humans
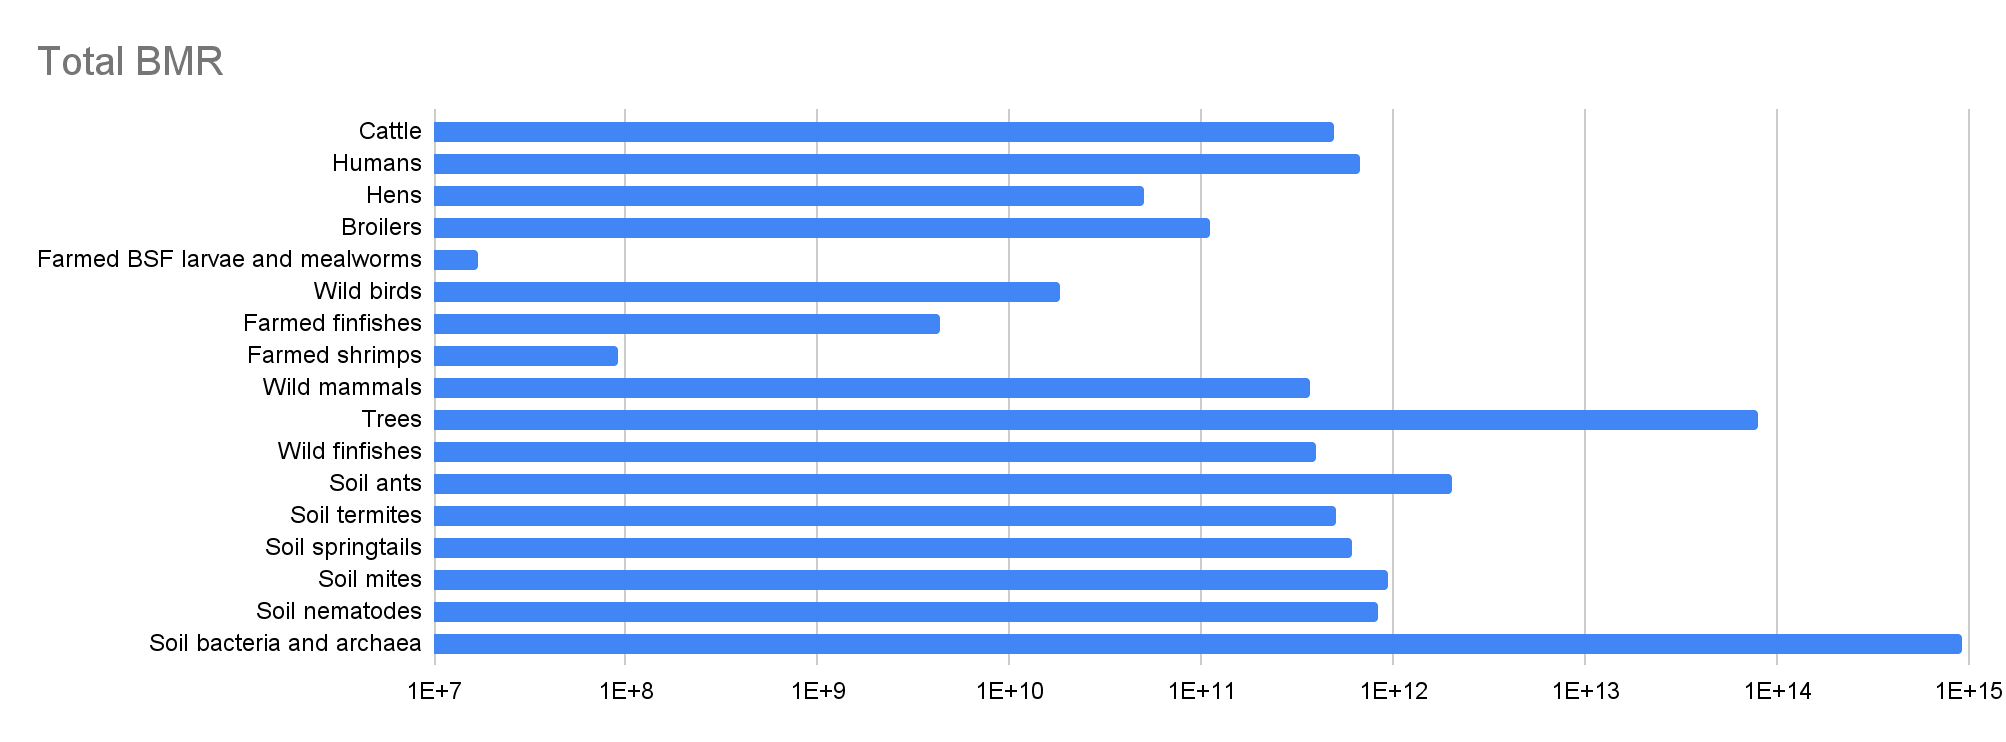
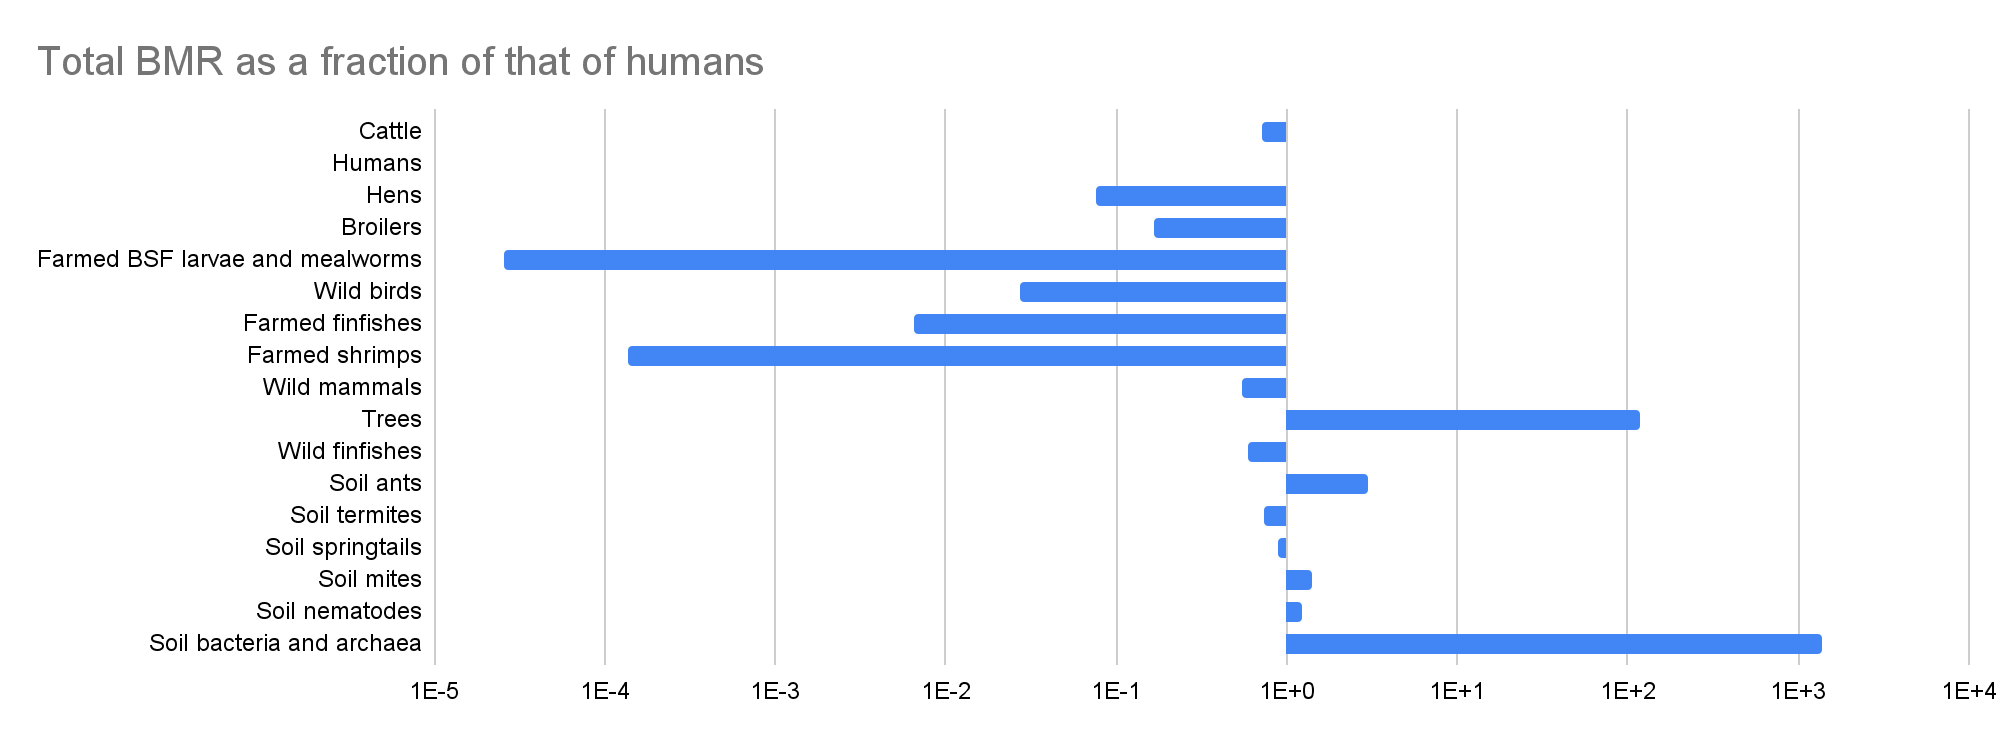
Total BMR (W)
Total BMR as a fraction of that of humans
Cattle
1.58E+09
19.5%
0.333
307
3.71
4.85E+11
72.4%
Humans
8.09E+09
100%
0.877
82.8
100%
6.70E+11
100%
Hens
8.44E+09
1.04
-1.69
5.96
7.20%
5.03E+10
7.51%
Broilers
1.88E+10
2.32
-2.27
5.96
7.20%
1.12E+11
16.7%
Farmed BSF larvae and mealworms
3.82E+10
4.72
-0.250
4.45E-04
5.37E-06
1.70E+07
2.54E-05
Wild birds
5.00E+10
6.18
0.333
0.369
0.446%
1.85E+10
2.75%
Farmed finfishes
2.23E+11
27.6
-5.38
0.0194
0.0234%
4.33E+09
0.646%
Farmed shrimps
2.30E+11
28.4
-8.77
3.97E-04
4.79E-06
9.12E+07
0.0136%
Wild mammals
3.16E+11
39.1
0.333
1.17
1.41%
3.70E+11
55.2%
Trees
1.00E+13
1.24E+03
0.250
8.00
9.66%
8.00E+13
119
Wild finfishes
1.00E+15
1.24E+05
-0.250
3.96E-04
4.78E-06
3.96E+11
59.1%
Soil ants
5.00E+16
6.18E+06
-0.250
4.02E-05
4.85E-07
2.01E+12
3.00
Soil termites
1.00E+17
1.24E+07
-0.250
4.98E-06
6.01E-08
4.98E+11
74.3%
Soil springtails
3.17E+18
3.91E+08
-0.250
1.90E-07
2.29E-09
6.02E+11
89.8%
Soil mites
6.33E+18
7.83E+08
-0.250
1.49E-07
1.80E-09
9.44E+11
1.41
Soil nematodes
4.89E+20
6.04E+10
-0.250
1.69E-09
2.04E-11
8.26E+11
1.23
Soil bacteria and archaea
3.00E+29
3.71E+19
-0.250
3.05E-15
3.68E-17
9.15E+14
1.37E+03
Welfare per fully-healthy-organism-year as a fraction of the welfare per fully-healthy-human-year
Individual welfare
Total welfare
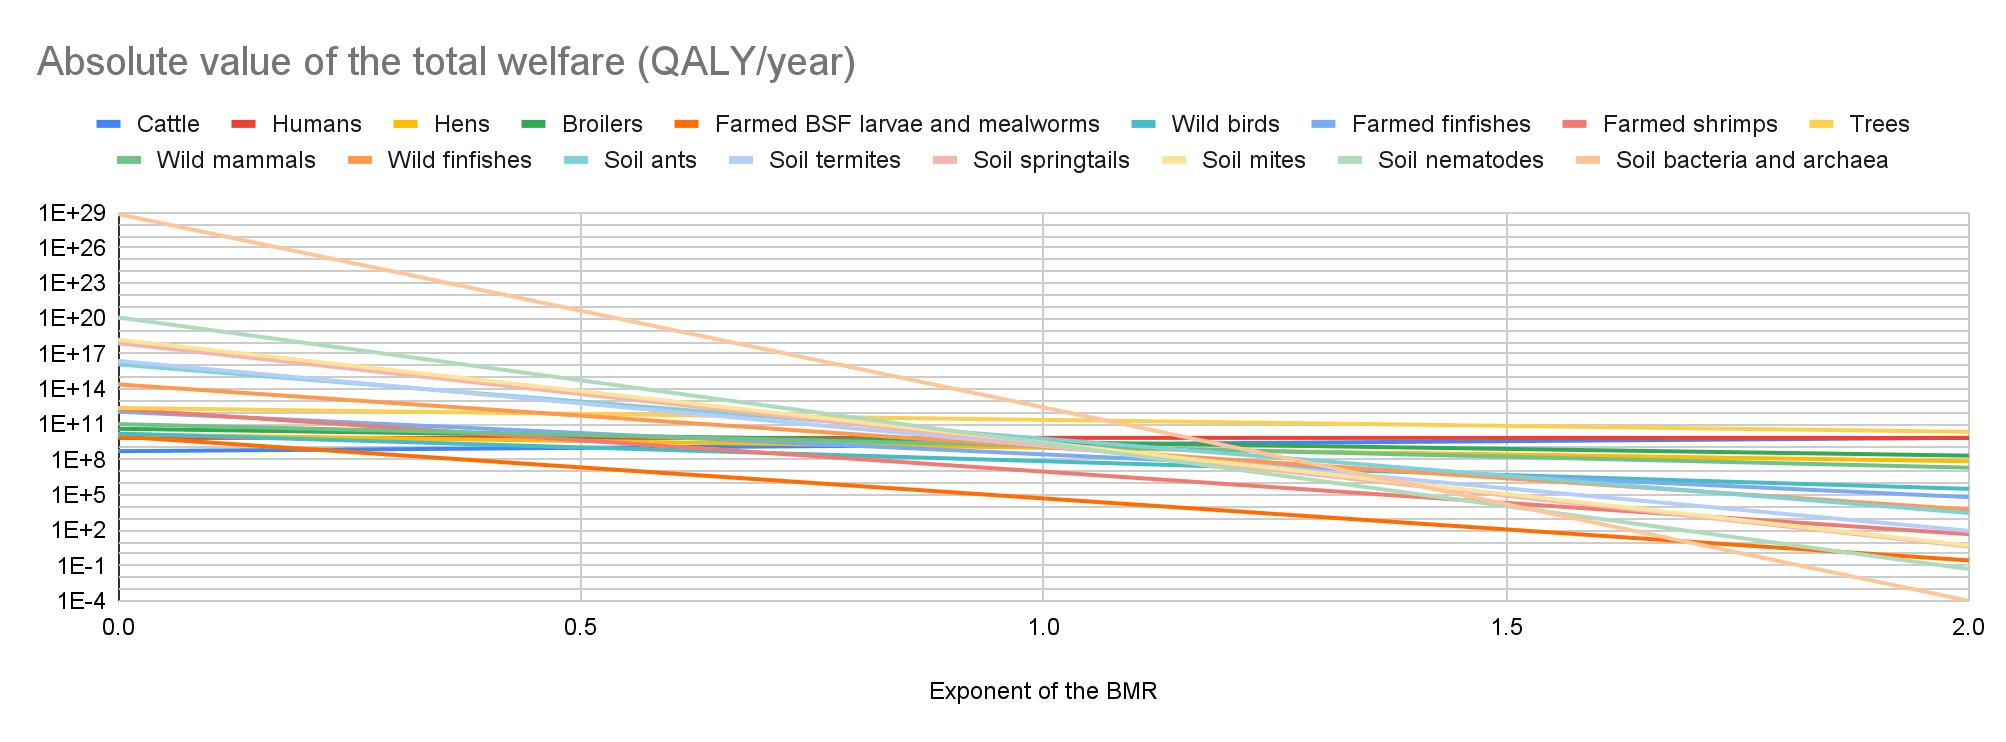
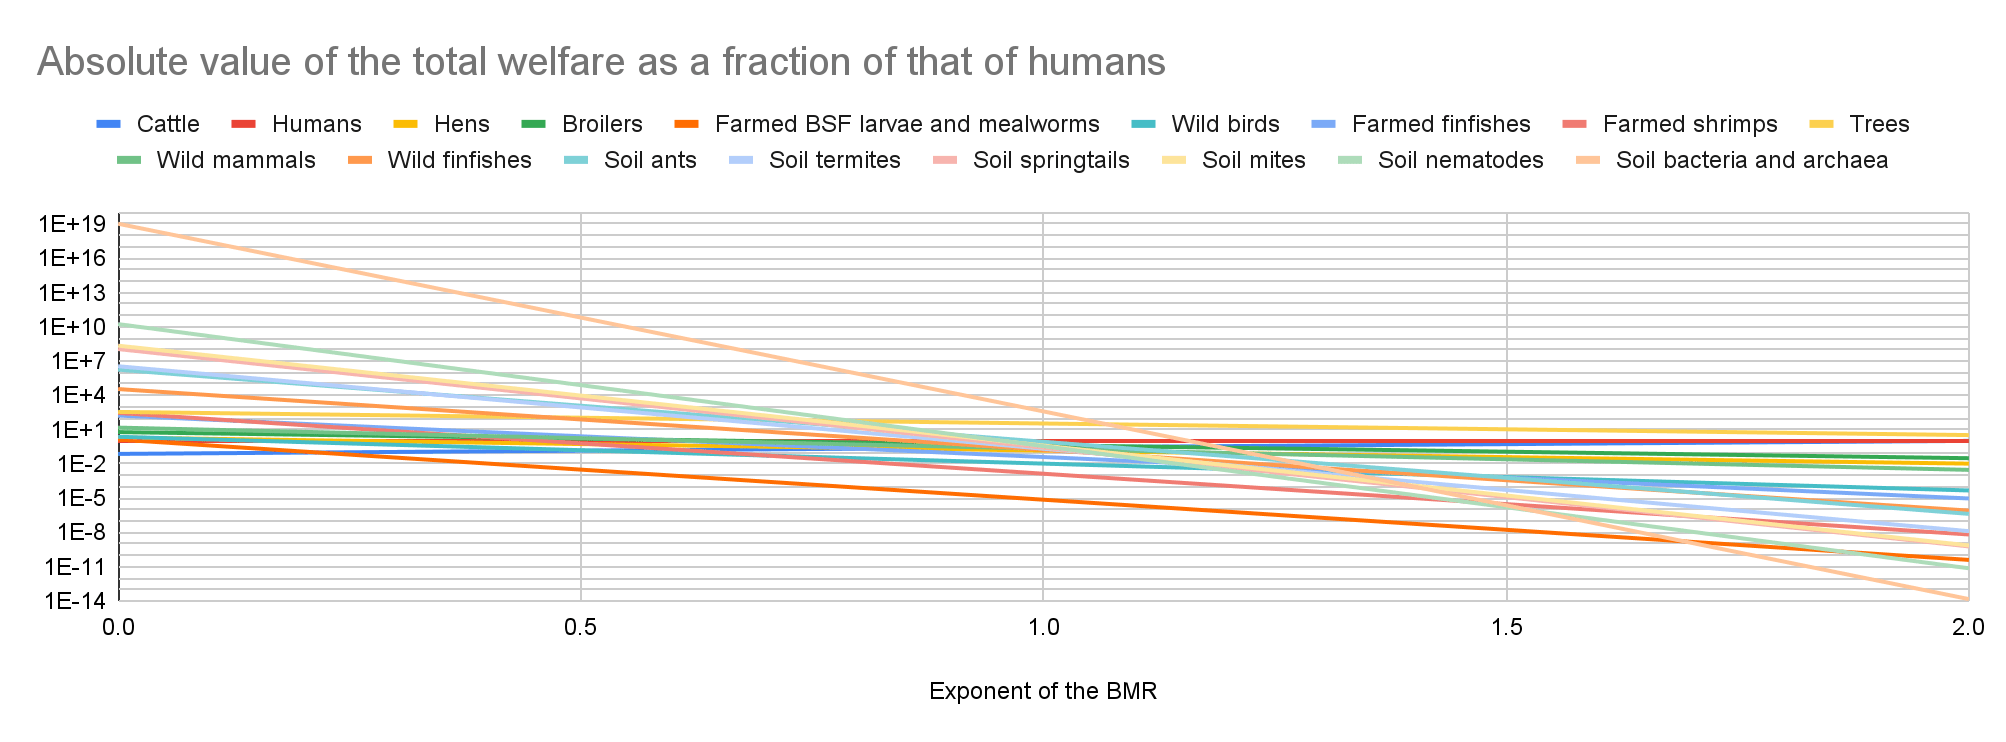
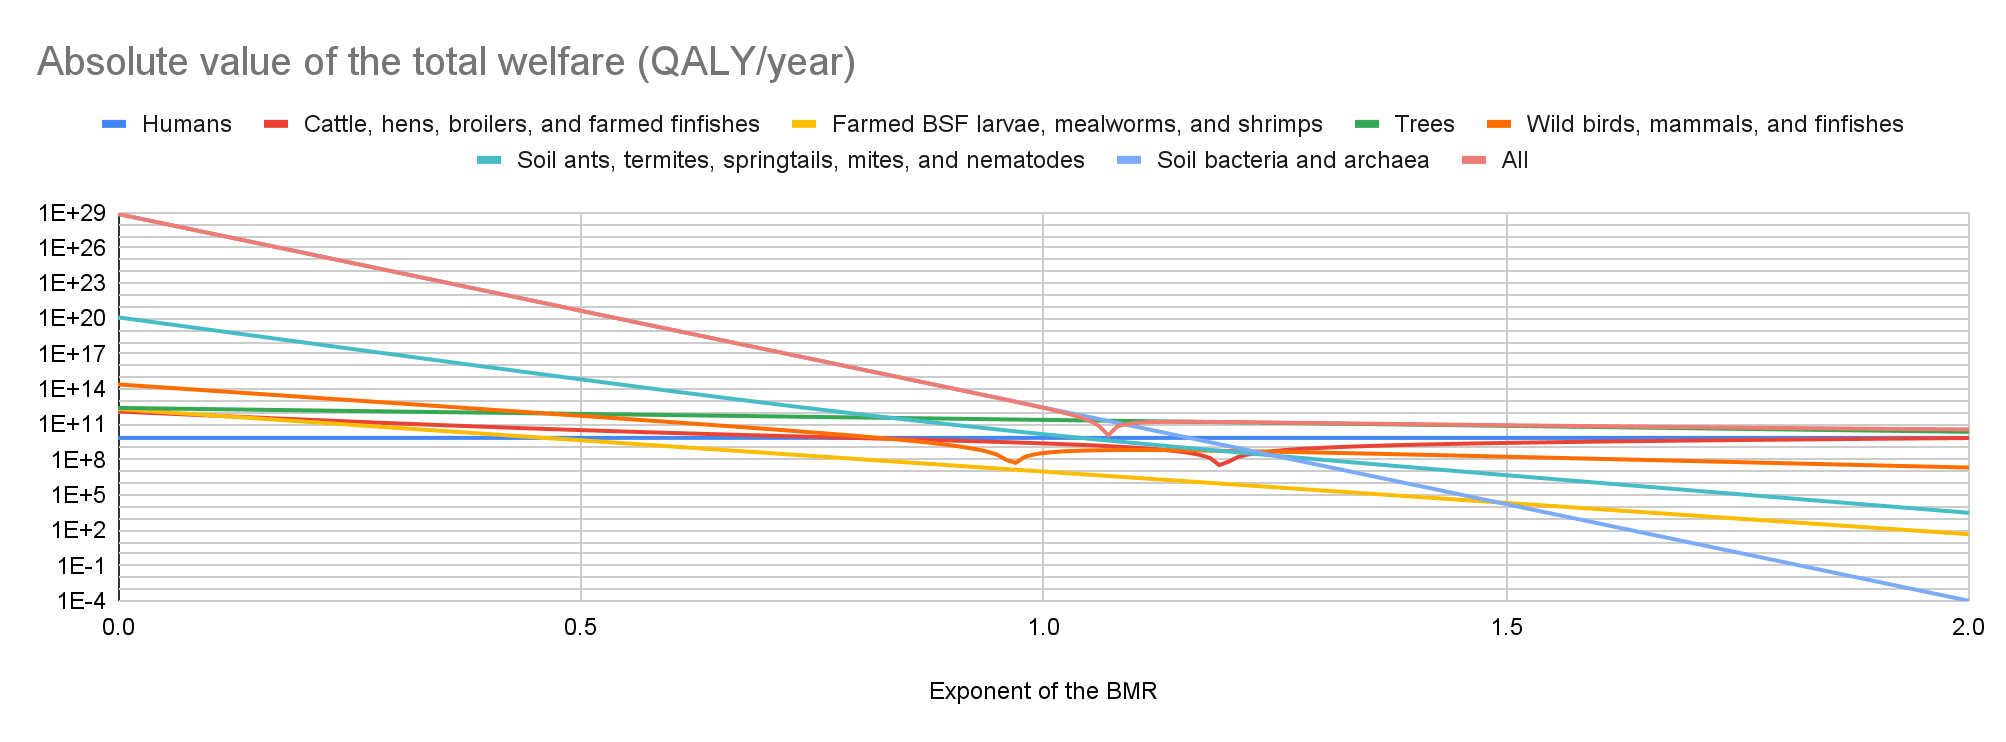
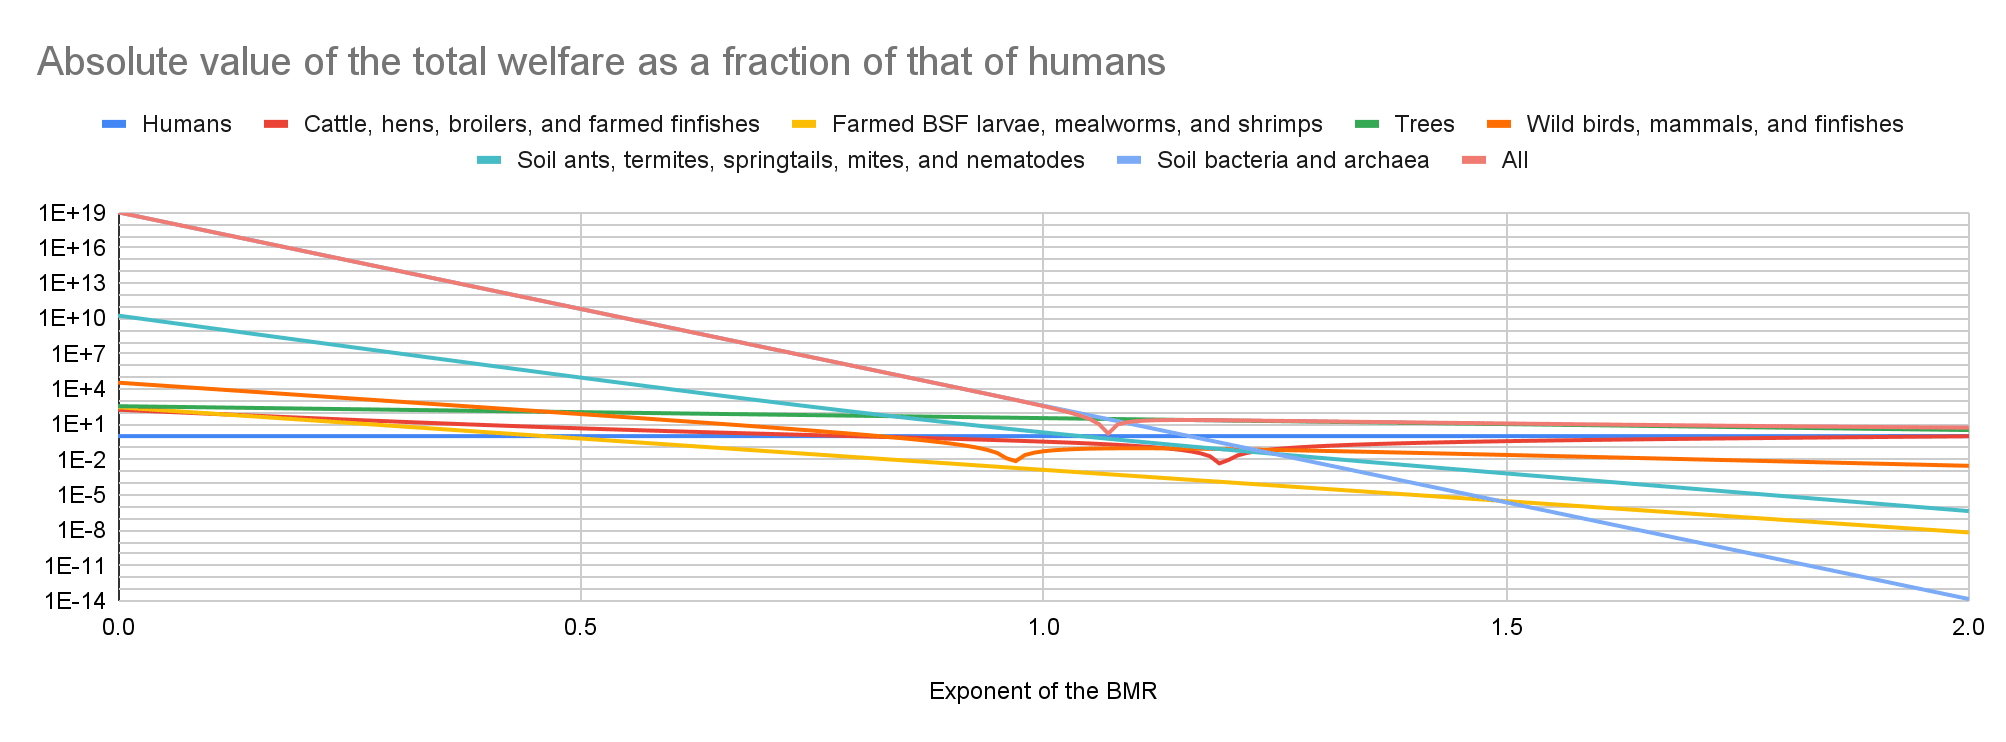
Cattle have the lowest absolute value of the total welfare for an exponent of the BMR from 0 to 0.21, farmed BSF larvae and mealworms for an exponent from 0.22 to 1.69, and soil bacteria and archaea for an exponent from 1.70 to 2. Soil bacteria and archaea have the highest absolute value of the total welfare for an exponent from 0 to 1.06, and trees for an exponent from 1.07 to 2.
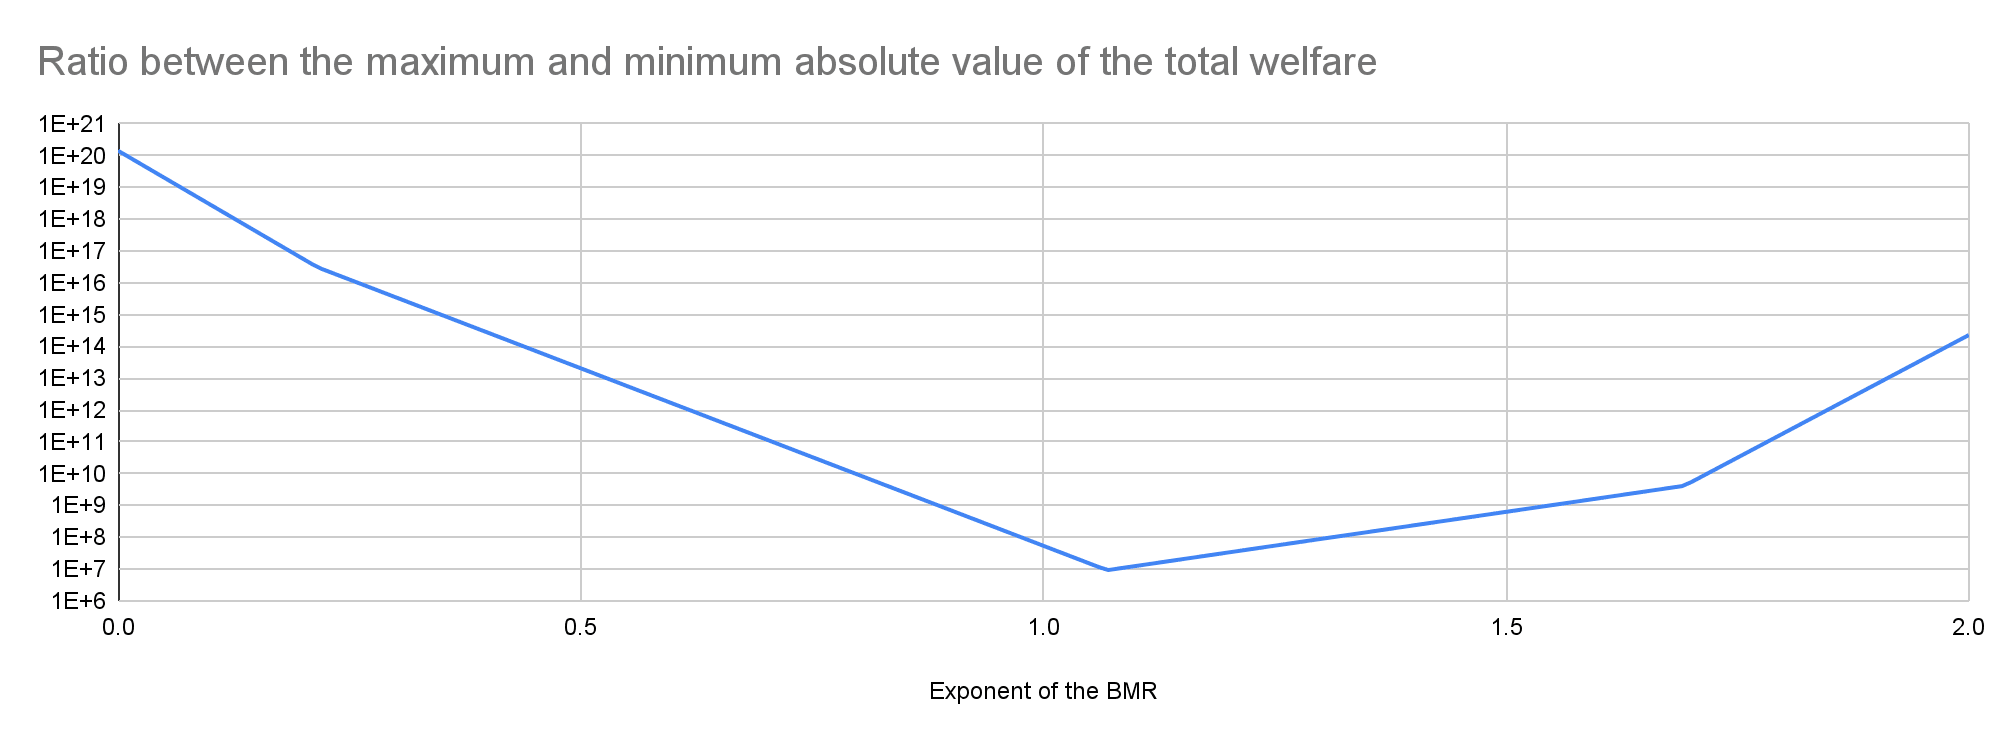
My results suggest prioritisation across populations matters the least for an exponent of 1.07. Among the 17 populations I analysed, the ratio between the highest and lowest absolute value of the total welfare decreases for an exponent of 0 to 1.07 from 1.42*10^20 to 9.35 M, and increases for an exponent of 1.07 to 2 from 9.35 M to 2.29*10^14.
In the last 2 graphs below, the lines representing the farmed animals, wild vertebrates, and all organisms I analysed have sharp points marking transitions from negative to positive total welfare.
Key numbers
Below are the total BMR, and individual and total welfare for exponents of the BMR of 0.5, 1, and 1.5.
Organisms
Total BMR (W)
Total BMR as a fraction of that of humans
Individual welfare for an exponent of the BMR of 0.5 (QALY/organism-year)
Total welfare for an exponent of the BMR of 0.5 (QALY/year)
Total welfare for an exponent of the BMR of 0.5 as a fraction of that of humans
Individual welfare for an exponent of the BMR of 1 (QALY/organism-year)
Total welfare for an exponent of the BMR of 1 (QALY/year)
Total welfare for an exponent of the BMR of 1 as a fraction of that of humans
Individual welfare for an exponent of the BMR of 1.5 (QALY/organism-year)
Total welfare for an exponent of the BMR of 1.5 (QALY/year)
Total welfare for an exponent of the BMR of 1.5 as a fraction of that of humans
Cattle
4.85E+11
72.4%
0.642
1.01E+09
14.3%
1.24
1.95E+09
27.5%
2.38
3.76E+09
53.0%
Humans
6.70E+11
100%
0.877
7.09E+09
100%
0.877
7.09E+09
100%
0.877
7.09E+09
100%
Hens
5.03E+10
7.51%
-0.453
-3.83E+09
-53.9%
-0.122
-1.03E+09
-14.5%
-0.0326
-2.75E+08
-3.88%
Broilers
1.12E+11
16.7%
-0.609
-1.14E+10
-1.61
-0.163
-3.07E+09
-43.2%
-0.0438
-8.22E+08
-11.6%
Farmed BSF larvae and mealworms
1.70E+07
2.54E-05
-5.79E-04
-2.21E+07
-0.312%
-1.34E-06
-5.13E+04
-7.23E-06
-3.11E-09
-119
-1.68E-08
Wild birds
1.85E+10
2.75%
0.0223
1.11E+09
15.7%
0.00149
7.43E+07
1.05%
9.92E-05
4.96E+06
0.0699%
Farmed finfishes
4.33E+09
0.646%
-0.0823
-1.83E+10
-2.59
-0.00126
-2.81E+08
-3.96%
-1.93E-05
-4.30E+06
-0.0606%
Farmed shrimps
9.12E+07
0.0136%
-0.0192
-4.41E+09
-62.2%
-4.20E-05
-9.66E+06
-0.136%
-9.19E-08
-2.11E+04
-2.98E-06
Wild mammals
3.70E+11
55.2%
0.0396
1.25E+10
1.77
0.00471
1.49E+09
21.0%
5.60E-04
1.77E+08
2.50%
Trees
8.00E+13
119
7.77E-02
7.77E+11
110
0.0242
2.42E+11
34.0
0.00751
7.51E+10
10.6
Wild finfishes
3.96E+11
59.1%
-5.47E-04
-5.47E+11
-77.0
-1.20E-06
-1.20E+09
-16.8%
-2.61E-09
-2.61E+06
-0.0368%
Soil ants
2.01E+12
3.00
-1.74E-04
-8.71E+12
-1.23E+03
-1.21E-07
-6.06E+09
-85.5%
-8.45E-11
-4.22E+06
-0.0595%
Soil termites
4.98E+11
74.3%
-6.13E-05
-6.13E+12
-864
-1.50E-08
-1.50E+09
-21.2%
-3.69E-12
-3.69E+05
-0.00520%
Soil springtails
6.02E+11
89.8%
-1.20E-05
-3.79E+13
-5.35E+03
-5.74E-10
-1.82E+09
-25.6%
-2.75E-14
-8.70E+04
-0.00123%
Soil mites
9.44E+11
1.41
-1.06E-05
-6.72E+13
-9.47E+03
-4.50E-10
-2.85E+09
-40.2%
-1.91E-14
-1.21E+05
-0.00170%
Soil nematodes
8.26E+11
1.23
-1.13E-06
-5.52E+14
-7.78E+04
-5.10E-12
-2.49E+09
-35.2%
-2.31E-17
-1.13E+04
-1.59E-06
Soil bacteria and archaea
9.15E+14
1.37E+03
-1.52E-09
-4.55E+20
-6.42E+10
-9.21E-18
-2.76E+12
-389
-5.59E-26
-1.68E+04
-2.36E-06
I estimate the following total welfare for exponents of 0.5, 1, and 1.5:
For cattle, hens, broilers, and farmed finfishes, -4.59, -0.341, and 0.375 times that of humans.
For farmed BSF larvae, mealworms, and shrimps, -0.625, -0.00137, and -3.00*10^-6 times that of humans.
For trees, 110, 34.0, and 10.6 times that of humans.
For wild birds, mammals, and finfishes, -75.1, 0.0519, and 0.0253 times that of humans.
For soil ants, termites, springtails, mites, and nematodes, -94.7 k, -2.08, and -6.78*10^-4 times that of humans.
For soil bacteria and archaea, -64.2 billion, -389, and -2.36*10^-6 times that of humans.
Discussion
I guess exponents of the BMR from 0.5 to 1.5 lead to reasonable best guesses under my assumption that individual welfare per fully-healthy-organism-year is proportional to “BMR at 25 ºC of the organisms”^“exponent of the BMR”. I do not know whether this is the case, which means my results underestimate uncertainty, but I do not rule it out. So I conclude any of the following are reasonable views, although not the only ones (I use |x| for the absolute value of the total welfare of x, and << for “is smaller than 10 % of”). For an exponent of:
I recommend decreasing the uncertainty about how the individual (expectedhedonistic) welfare per unit time of different organisms and digital systems compares with that of humans. In particular, I recommend supporting RP via restricted funding. They have a research agenda on valuing impacts across species, and Hannah Tookey from RP commented the following on 6 January 2026. “We don’t currently have anything scheduled on this topic [“projects decreasing the uncertainty of interspecies comparisons of expectedhedonistic welfare”], but we regularly review project ideas and may consider working on something like this a little later in the year. Dedicated funding would certainly make it more likely that we could prioritize this work”. In agreement with this, Bob Fischer, who led RP’s moral weight project, and published a book about comparing welfare across species, commented the following on 1 July 2025. “Funding is, and long has been, the bottleneck [for further work on moral weights]”. “But if people are interested in supporting these or related projects, we’d be very glad to work on them”. I committed donating 2 k$ to RP for them to scope out whatever projects they believe would decrease the most cost-effectively the uncertainty about how the individual welfare per unit time of different organisms and digital systems compares with that of humans.
I think more research on how the individual welfare per unit time of different organisms and digital systems compares with that of humans has lots of room to change funding decisions even neglecting soil animals and microorganisms. For example, AIM’s estimates of SADs, which are used at least by them and ACE, are proportional to the (expected) welfare range, the difference between the maximum and minimum welfare per unit time, and their welfare range of shrimps is 19.9 % (= 0.433*0.460) of that of humans for a probability of sentience of 43.3 %, and welfare range conditional on sentience of 46.0 % of that of humans (you can ask Vicky Cox for the sheet). However, I would say a much better best guess could be10^-6 of that of humans, the ratio between the number of neurons of shrimps and humans, or 4.79*10^-6, the ratio between the BMR at 25 ºC of shrimps and humans. Using this would lead to benefits to shrimps 0.00241 % of those estimated by AIM and ACE, which I believe would justify decreasing the funding targeting shrimps by more than 90 %.
I had recommended research informing how to increase the welfare of soil animals, but I am now more pessimistic about this. I have very little idea about whether existing interventions which robustly increase the welfare of humans or non-soil animals increase or decrease animal welfare due to potentially dominant uncertain effects on soil animals. I expect effects on soil animals dominate for an exponent of the BMR of 0.5. Likewise, I do not know whether hypothetical interventions which robustly increased the welfare of soil animals would increase or decrease welfare due to potentially dominant uncertain effects on soil microorganisms. I expect effects on microorganisms dominate for an exponent of 0.5.
16
More posts like this
31
Expanding agricultural land may increase or decrease the welfare/suffering/happiness of soil invertebrates

Executive summary: The author estimates the total welfare of many biological populations by assuming individual welfare scales with basal metabolic rate (BMR) raised to an uncertain exponent, concluding that under plausible assumptions soil organisms, microorganisms, or trees could dominate total welfare and that reducing uncertainty about interspecies welfare comparisons could substantially change funding priorities.
Key points:
This comment was auto-generated by the EA Forum Team. Feel free to point out issues with this summary by replying to the comment, and contact us if you have feedback.