I haven’t reviewed the literature on what weights are reasonable but Gómez-Emilsson (2019) argues that worse pains are many orders of magnitude worse than mild pains. I think that the question of how to weight different pain intensities used by the Welfare Footprint Institute deserves more research, and I imagine it could be researched in many different ways.
In 2023, Adam Shriver and I ran a workshop to try to figure out how to best address this question empirically. The event summary is here, but my overall updates based on that event were:
In addressing why an individual wouldn't be willing to endure Excruciating pain, even for a much shorter period of time than a less severe category of pain, there is more than one plausible explanation. While it could be that Excruciating pain is orders of magnitude worse than, say, Disabling pain, it could also be that, beyond a certain level of severity, individuals have reduced volition to choose a form of pain that is worse on a per-moment basis (brief explanation here).
Because both views are plausible and I am pessimistic that we will satisfactorily resolve the issue empirically anytime soon, I think sensitivity analysis on this parameter is often worthwhile.
It's difficult to design studies that tease apart these competing explanations, and it would hard to get permission from ethical review boards to carry them out.
For comparing different levels of severe pain, that leaves us with asking humans to report on past experiences or integrating studies into situations where humans have to go through pain anyway. Welfare Footprint covers some of the relevant studies here.
If there is convergence among several different methodologies, then we're getting somewhere, but if not, we might be stuck.
Hopefully results that apply to humans would apply to farmed animals, but the usual caveats apply about degree of evolutionary divergence.
Even more speculatively, it could be that pain severity is not a cardinal trait at all, something Adam and I briefly touch on here.
(Strongly upvoted and bookmarked for future reference)
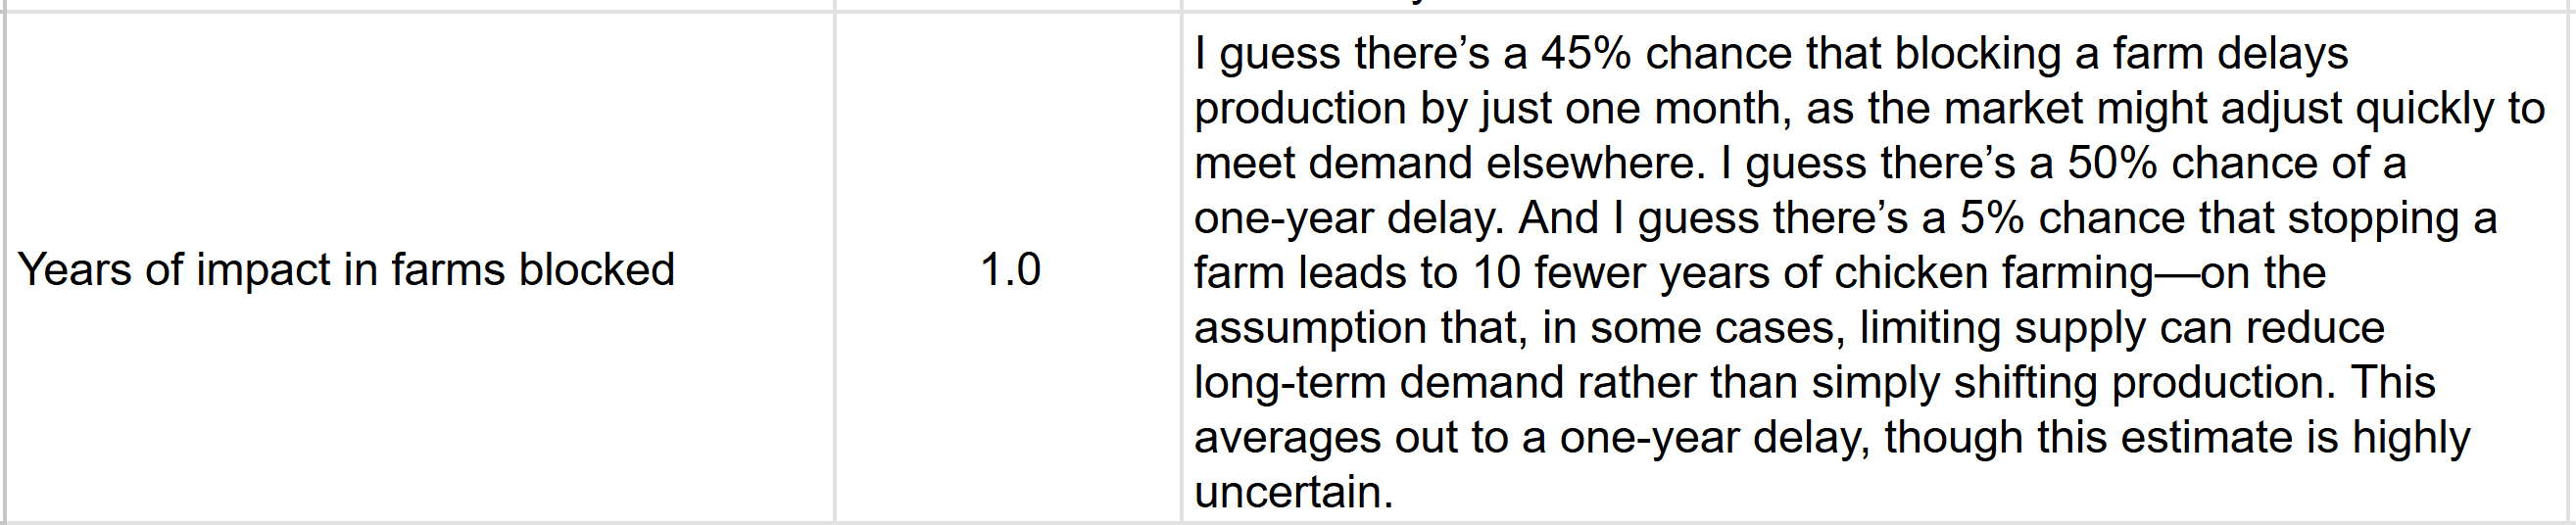
For how many years do reforms have an impact?
One of the most uncertain parameter in all estimates is “years of impact”. ...
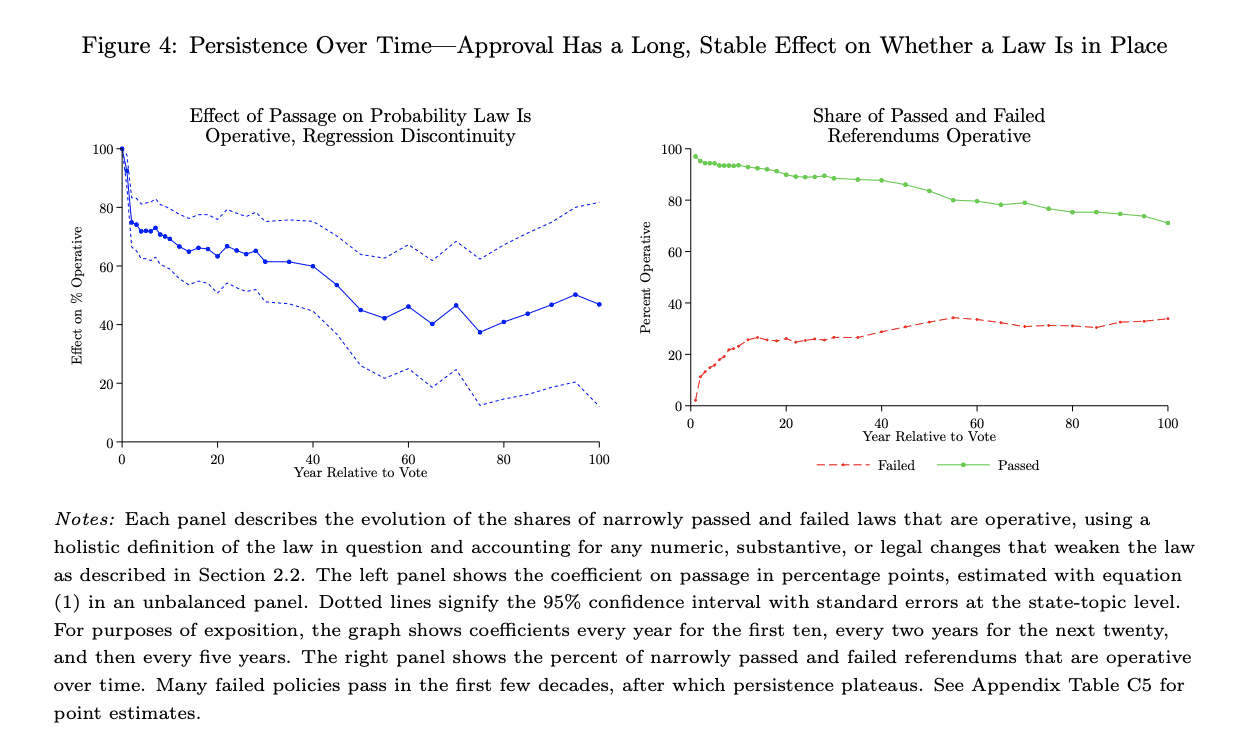
You've probably seen zdgroff's analysis, but just in case, would it have helped? He used a regression discontinuity design approach to analyse 800+ state policies that were the subjects of close referendums in U.S. states since 1900 and estimated that "passing a referendum increases the chance a policy is operative 20, 40, or even 100 years later by over 40 percentage points", and found similar policy persistence "for a range of institutional environments, cultures, and topics". Notably, he said, the hazard rate is much lower in later years (chart below).
My own main reservation about using zdgroff's result, aside from Poland's policy persistence possibly being different from that of the US, is that the future seems very uncertain generally, so I'm just unsure graphs like zdgroff's will remain true going forward. So in your shoes I would've probably done a simple threshold analysis resulting in a series of hopefully decision-informing statements like (making up numbers) "we estimate Anima's stop the farms work to be more cost-effective than [standard benchmark] if production takes longer than 1.2 years to increase elsewhere to meet demand", where [standard benchmark] is the FAW equivalent of cash transfers or something (maybe AIM's cage-free work in the Middle East?), and then contextualise by mentioning how this could take anywhere from a week to 20 years, affected by factors XYZ some of which may be affectable inputs into strategy. Not as simple as a single-number estimate unfortunately, but hopefully more informative?
It’s also not even certain that some of these programs do more good than harm to animals.
Stop The Farms campaign could be just moving animal production to countries where improving animal welfare could be even more challenging. If a chicken farm is blocked in Poland, another farm might be built in, say, Romania to meet the same demand—potentially with even lower welfare for chickens.
I don't have anything useful to say unfortunately, except that this has also been on my mind since Joseph asked a conceptually analogous question in a different context ("Should we consider this an example of economic growth? Is this just shifting spending/consumption from one place to another?"). So input on how to better think about this sort of "potential offset effect" seems useful, albeit probably heavily domain-specific so not that generalisable.
I'm aware of zdgroff's analysis. In the context of my analysis, I guess it would inform how long the ban of fur farming in Poland might last. But the possibility of fur farming being banned in Poland and then the ban being lifted some years later hadn't even occurred to me. I am much more worried about production moving to other countries to meet the same demand, as this has happened before. I imagine that investors into fur farming would choose to build farms in one of the many countries that allow fur farming, rather than lobby a country like Poland to rescind its ban.
Actually, it is also relevant for a possible EU cage-free ban. I can imagine that ban being rescinded. I don't think this consideration would affect the results of my estimate much, though it does complicate thinking about how many years impact lasts a little bit.
Thanks for doing this Saulius! I have been wondering about modeling the cost effectiveness of animal welfare advocacy under assumptions of relatively short AI timelines. It seems like one possible way of doing this is to to change the "Yearly decrease in probability that commitment is relevant" numbers in your sheet (cells I28:30). Do you have any thoughts on that approach?
In general, if you are worried that animal advocacy efforts will soon become irrelevant because the world will change a lot soon, it could make sense to donate to charities that have impact quickly. Shrimp Welfare Project might qualify. But maybe it makes more sense to try to find a way to impact the welfare of animals in the post-AGI world somehow, even though it's really unclear how to do that.
Regarding the cells I28:30, yes you could do that, it would change estimates for cage-free and broiler reforms. If you think these yearly probability that commitments become irrelevant should be higher, I'd be curious for which reason. Possible reasons I listed include x-risks, global catastrophic risks, societal collapse, cultured meat taking over, animals bred not to suffer, black swans.
For context, my choices for "Yearly decrease in probability that commitment is relevant" numbers are informed by this forecast which predicts that the number of chickens slaughtered for meat will be roughly the same in 2052 as it is now, but just 12% of what it is now in 2122. My value for 2122 is slightly lower, 11% because that meticulous question also has this condition: "If humanity goes extinct or ceases to have a developed society prior to a listed year, that sub-question will resolve as Ambiguous." I only decreased the forecast for 2122 slightly because this forecast predicts that the probability of human extinction before 2100 is just 1%, although looking back at this, I think I could've adjusted for x-risks more because much higher estimates of x-risks seem reasonable.
Very cool work, thanks Saulius & Nuno for doing it and Anima for commissioning!
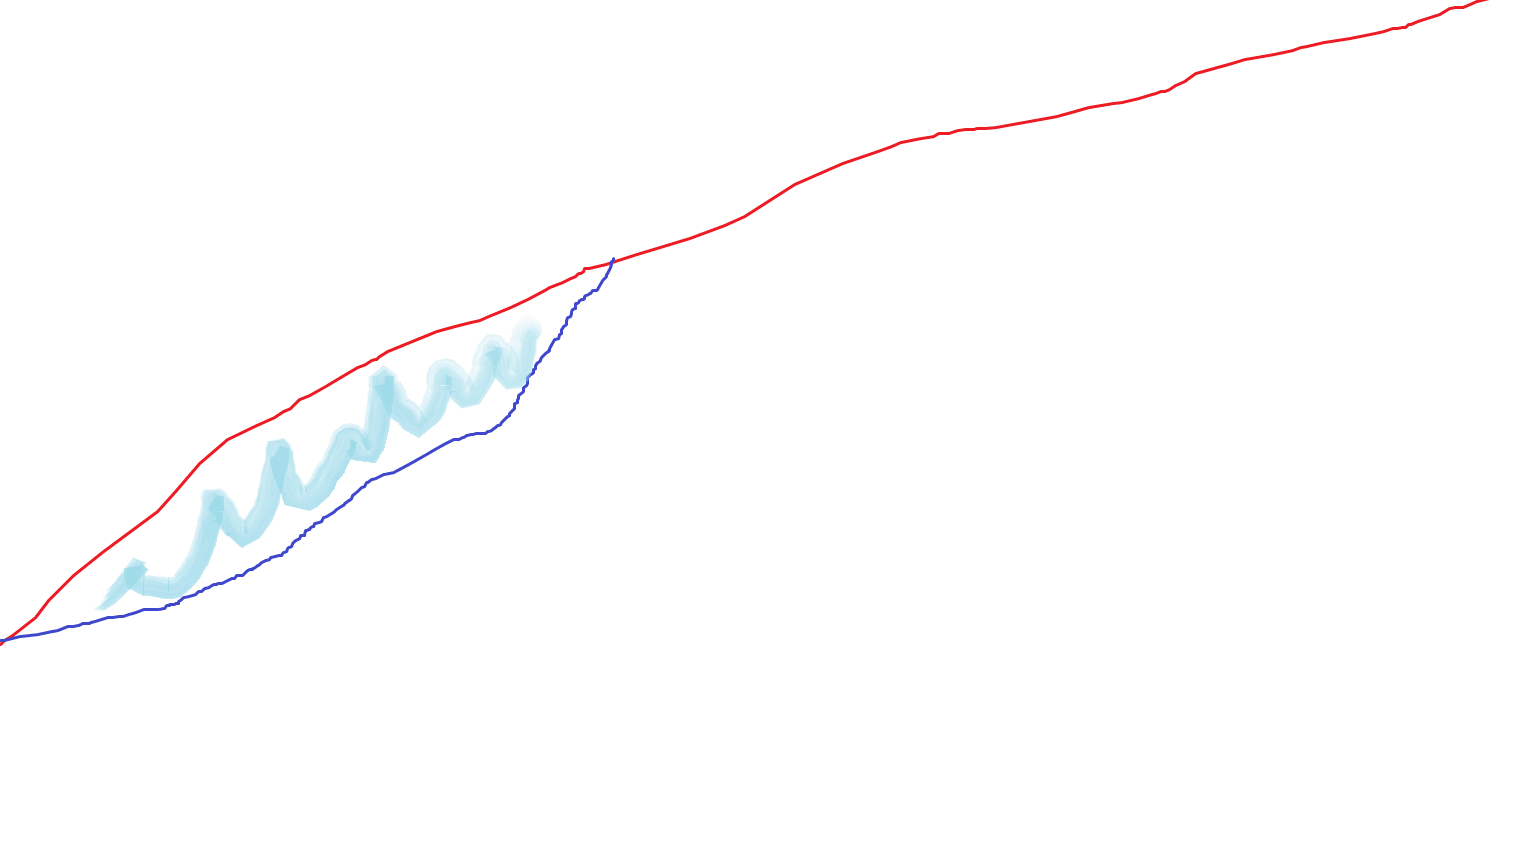
I'm particularly interested in the stopping new factory farms campaign and am keen to understand how you think about this. I drew some very rough graphs to help me get my head around this and curious if you are modelling this in a similar way. I'll leave aside the impact on the price of meat, although, I anticipate there may be some small increase when supply is more constrained.
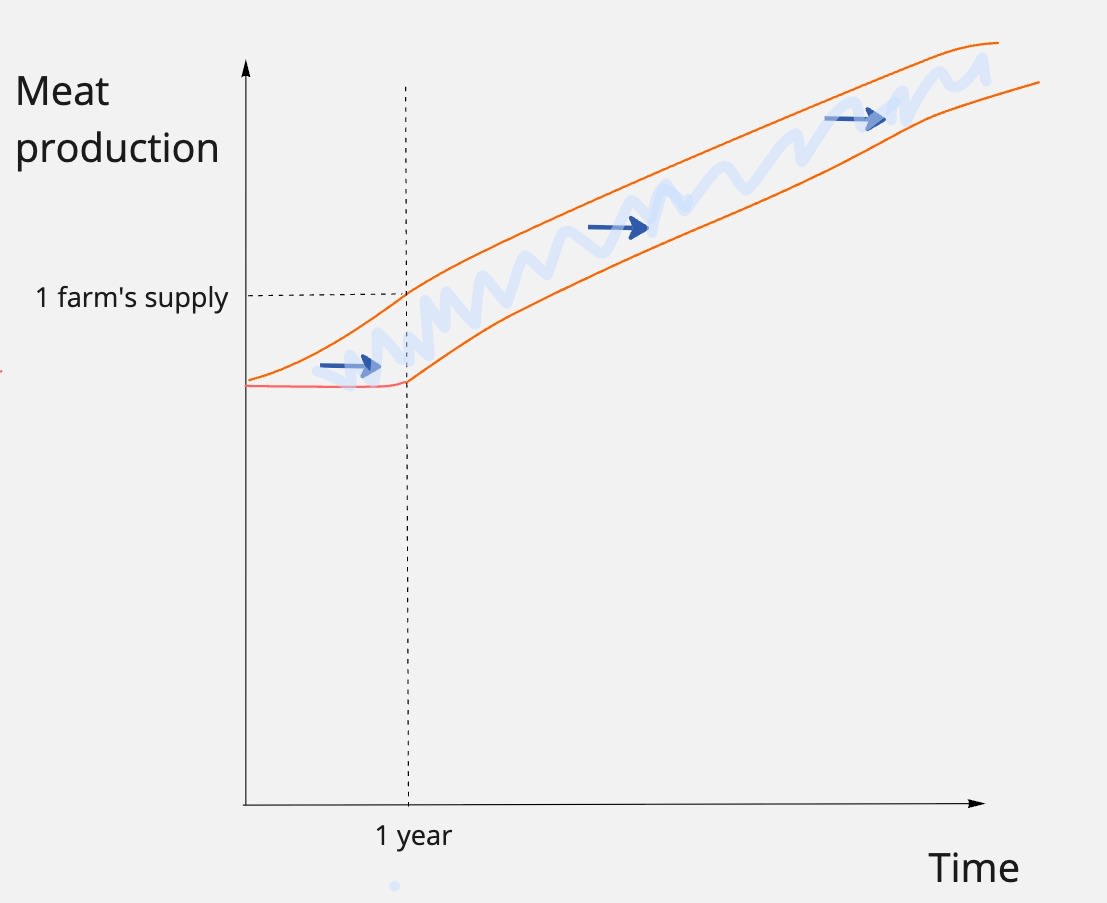
Specifically, you note that you estimate that this will delay farms by, on average, around approx. 7 months. I'll just assume this is 1 year for the sake of simplicity so this may look like this:
To describe what I'm thinking: the production of meat is essentially shifted to the right by 1 year, but follows a pretty similar upward trajectory (although I don't think the trajectory matters too much). Therefore the difference in animal suffering (assuming that's the same as meat production) is the difference in areas under the curve, shown by the beautifully scribbled light blue area.
However, I think this only holds if you think that there will come a time in the future when meat production will start going down. If you think it will have the same total peak and trajectory in both cases, then all you are doing is having a very similar amount of meat production/animal suffering, just delayed by a year. As seen by the small light blue area below, it makes sense there would be some small impact on animals.
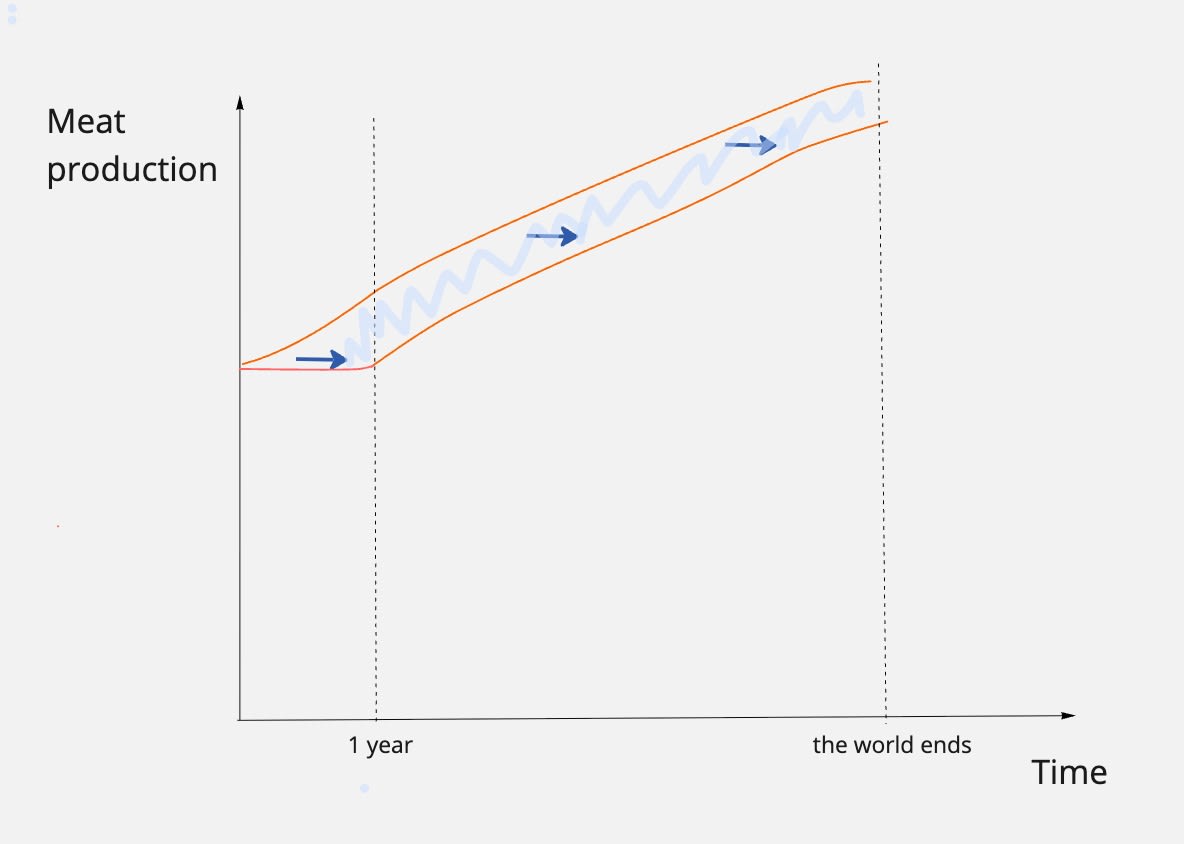
But, for example, if you think the world is going to end or there will be some factor (e.g. very tasty and cheap cultivated meat) that causes meat production to decrease in a given year, then this will have counterfactually reduced animal suffering by reducing the height of the meat production peak, as seen below.
Is this roughly how you're also thinking about this? I would be curious for an economist to weigh in also / look into this further as I'm sure there are a bunch of other relevant factors besides the duration of the delay that would affect overall meat / animal suffering averted e.g.:
If most farms are operating below max capacity and can fairly easily ramp up supply without building new facilities (which would make all of this moot)
How easily manufacturers/processors can find new suppliers
If there are any price impacts and how significant they might be for demand
shown by the beautifully scribbled light blue area
The scribble is indeed very beautiful.
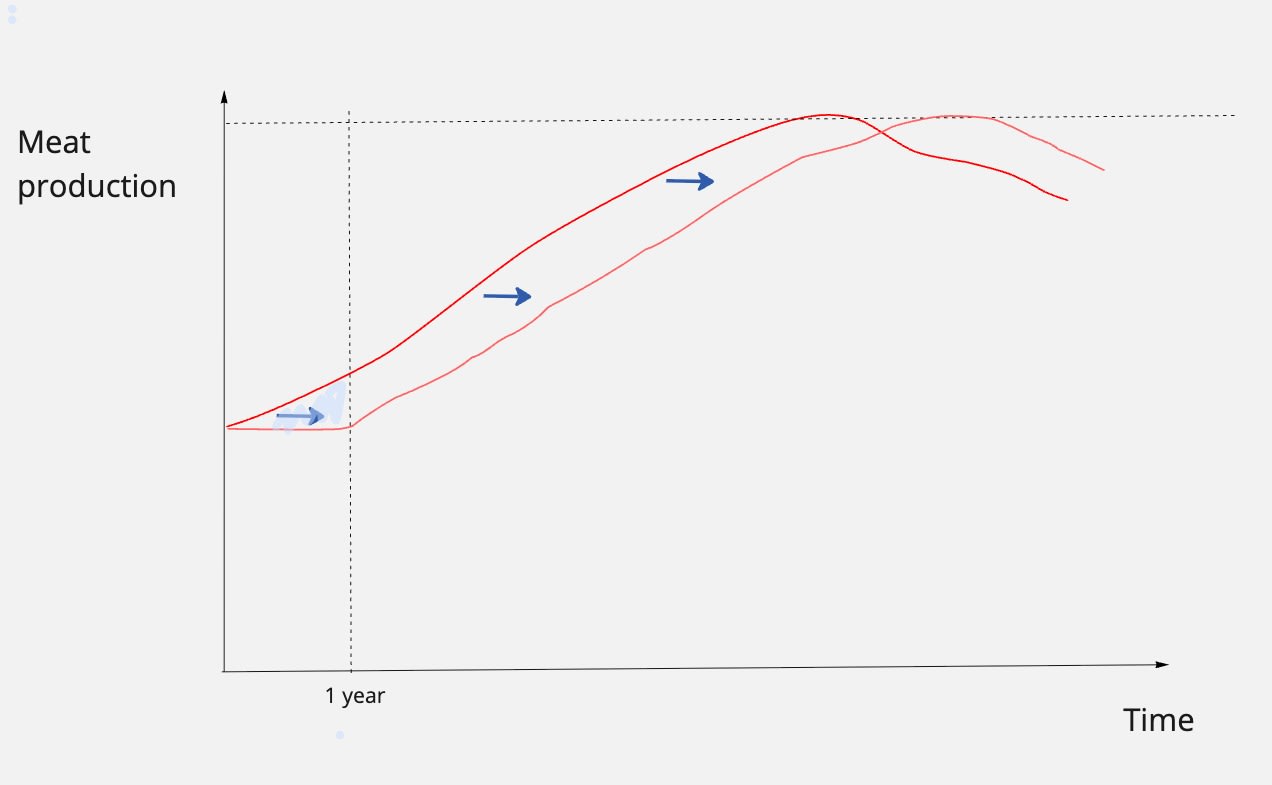
In your graph above, it looks like impact for a lot more than one year. I assume it's something like this:
The red line here is what would've happened without Stop The Farms campaign, and blue line shows that it's different for a little while with the campaign. But I assume that the market soon (like within a year) returns back to the same growth trajectory, and it's as if we never did anything, except that maybe farms are build in a different country. Chicken production is growing and I don't think this will change in the relevant timeframe of few years.
When local residents successfully protest against a planned chicken farm, production will likely increase elsewhere to meet demand—but how quickly? I found no clear methodology to estimate this and received no definitive answers when I asked on an economics forum. As far as I know, it could take anywhere from a week to 20 years, and the choice massively impacts cost-effectiveness.
I agree a farm being blocked can decrease anything from a 1 farm-week to 20 farm-years. Gemini says random broiler farms in Poland have an expected lifespan of 31.2 years, which I see as an upper bound for the reduction in farm-years. I also believe the lower bound is very low because the industry could more applications to build farms such that the expected number of accepted ones changes very little.
Your estimates imply the Shrimp Welfare Project's (SWP) Humane Slaughter Initiative has been 38.6 (= 25*10^3/648) times as cost-effective as the future work of Animal International Poland. This suggests someone working here who is 10 % more cost-effective than the 2nd best candidate for their role, and donates 10 % more of their gross salary to SWP has 38.6 times as much impact through donations than through work. This illustrates why I think donating more and better is the best strategy to maximise impact for the vast majority of people working in impact-focussed organisations (such as Animal International Poland).
For your assumption that disabling pain is 60.0 (= 1/0.01667) times as intense as hurtful pain, and my guesses that this is as intense as fully health life, and that fully healthy life in chickens is 33.2 % as intense as in humans (given Rethink Priorities' (RP's) median welfare range of chickens of 0.332), 1 day of disabling pain in chickens (1 DCDE) is as bad as 0.0545 DALYs (= 60.0*0.332/365.25). So I would say your estimate for the future cost-effectiveness of Anima International Poland is, based on your own pain intensities, equivalent to averting 35.3 DALYs per $ (= 648*0.0545), 3.55 k (= 35.3/0.00994) times as cost-effective as GiveWell's top charities (neglecting theireffectson animals). I estimated cage-free campaigns are 462 times as cost-effective as GiveWell's top charities.
I tried estimating years of impact using graphs like this:
[...]
The yellow line accounts for the possibility that commitments will stop being relevant due to things like x-risks, global catastrophic risks, societal collapse, cultured meat taking over, animals bred not to suffer, black swans, etc. [...]
[...]
Finally, we estimate the expected proportion of hens used by companies that will be cage-free each year as follows: (blue - red) ✕ yellow. And then we add up the result for all years to calculate years of impact.
I would estimate the number of layer-years improved in expectation in year Y from "expected population of layers in year Y"*("expected population of layers in cages in year Y without the intervention as a fraction of all of them in year Y" - "expected population of layers in cages in year Y with the intervention as a fraction of all of them in year Y") = P(Y)*(f_control(Y) - f_intervention(Y)), which is correct by definition. I would then calculate the total number of layer-years improved adding the effects from the year in which the intervention started on. I believe the annual effects should eventually go to 0, such that there is no need to add the effects of all the years until infinity. It is enough to consider the years accounting for the vast majority of the total number of layer-years improved.
P, f_control, and f_intervention relate to your yellow, red, and blue lines, but their meaning is more intuitive. In addition, the yellow line in your formula should not be strictly seen as a probability for it to work in all cases. A probability describes effects that would make the fraction of hens in cages the same with and without the intervention, which applies to, for example, human extinction. However, there are non-binary gradual effects like the raise of alternative proteins which make the fraction of hens in cages with and without the intervention more similar in expectation, but without all the effect coming from the possibility of the fraction with and without the intervention becoming the same.
I should say though that based on my conversations at the time, it seemed unlikely that alt proteins will make a big difference.
Interesting. I think changes in diet, not global catastrophes, are the driver of reductions in the number of farmed animals. I guess alternative proteins will have a negligible effect over the next 10 years, but that their effect may well be the most important one in 100 years.
I would estimate the number of layer-years improved in expectation in year Y from "expected population of layers in year Y"*("expected population of layers in cages in year Y without the intervention as a fraction of all of them in year Y" - "expected population of layers in cages in year Y with the intervention as a fraction of all of them in year Y") = P(Y)*(f_control(Y) - f_intervention(Y)), which is correct by definition.
Cost-effectiveness analyses (CEAs) of interventions accelerating animal welfare reforms usually estimate the increase in the welfare of the target animals (for example, hens in cages) based on the acceleration in years of the full implementation of the reform. This makes sense if each level of implementation of the reform is accelerated as much as its full implementation.
However, there are many cases where the acceleration of the full implementation of the reform is not enough to determine the number of animals helped, or animal-years improved. I discuss some below.
Hi @saulius. I am tagging you because I updated this comment. @Michael St Jules 🔸, you may also be interested in the update.
Stop the farms
When local residents successfully protest against a planned chicken farm, production will likely increase elsewhere to meet demand—but how quickly? I found no clear methodology to estimate this and received no definitive answers when I asked on an economics forum. As far as I know, it could take anywhere from a week to 20 years, and the choice massively impacts cost-effectiveness.
Have you looked into the price elasticity of the supply of and demand for poultry meat in Poland? I did not find "elasticit" in the post or sheet. For E_D = "price elasticity of demand" (negative because demand decreases with price), and E_S = "price elasticity of supply" (positive because supply increases with price), the reduction in supply/demand as a fraction of a leftwards shift in the demand curve is "cumulative elasticity factor (CEF)" = E_S/(E_S - E_D). Swapping _D and _S, the reduction in supply/demand as a fraction of a leftwards shift in the supply curve is E_D/(E_D - E_S) = -E_D/(E_S - E_D) = 1 - CEF[1].
CEF is 76 % for chicken meat according to Figure 8.2 of Norwood and Lusk (2011). I do not know the time horizon to which this refers to, and would not be surprised if it generalised badly to stopping farms in Poland. However, if it did, shifting the supply curve of chicken leftwards by 1 kg would decrease its demand/supply by 0.24 kg (= 1*(1 - 0.76)). Did you account for this when coming up with your guesses for the years of impact? I would explicitly include the cumulative elasticity factor in the estimation of the reduction in demand/supply, and then guess the leftwards shift in the supply curve caused by blocking and delaying the construction of farms.
It makes sense that "reduction in supply/demand for a leftwards shift in the supply curve as a fraction of the shift" = 1 - CEF = 1 - "reduction in supply/demand for a leftwards shift in the demand curve as a fraction of the shift". For small shifts in the demand and supply curves, the change in supply/demand is CEF*"shift in demand" + k*"shift in supply". If the shift in demand matches the shift in supply, the change in supply/demand is equal to the shift. In this case, "shift" = CEF*"shift" + k*"shift", which means k = 1 - CEF.
CEF is 76 % for chicken meat according to Figure 8.2 of Norwood and Lusk (2011). I do not know the time horizon to which this refers to, and would not be surprised if it generalised badly to stopping farms in Poland. However, if it did, shifting the supply curve of chicken leftwards by 1 kg would decrease its demand/supply by 0.24 kg (= 1*(1 - 0.76)). Did you account for this when coming up with your guesses for the years of impact?
To clarify my question above, are these estimates supposed to account for adjustments broiler producers can make to expand output along the existing supply curve (with the same farms and technology):
Higher stocking density – place more chicks per m² of barn space (within legal or contractual limits).
Increase batch frequency – shorten downtime between flocks (reduce cleaning/resting days).
Longer grow-out period – delay slaughter so birds reach heavier weights.
Optimized feed formulation – shift to higher-energy or higher-protein rations if the higher output value outweighs feed costs.
Reduced mortality through management tweaks – e.g. stricter biosecurity, better litter quality, ventilation adjustments.
Use of feed additives or growth promoters (where legal) – probiotics, enzymes, coccidiostats to improve feed conversion.
Labor allocation – more intensive monitoring of flocks to reduce disease losses and increase uniformity.
Energy use adjustments – e.g. heating/cooling more aggressively to maintain optimal bird growth conditions.
Extending usable facilities – keep older barns in service longer or run temporary housing (e.g. tents, converted sheds) to squeeze a bit more capacity.
Tightening contract terms with integrators – e.g. accepting higher chick placements per house if integrators provide them.
My understanding is that your estimates are just supposed to account for the decrease in the number of broiler farms, not the above. If so, I think the impact of Stop the Farms is 24 % (= 1 - 0.76) as large as you estimated based on the cumulative elasticity factor for chicken meat of 76 % presented in Figure 8.2 of Norwood and Lusk (2011).
No, I did not think about the effects you listed when choosing these numbers, at least not explicitly. I don’t remember what exactly went through my head when I imputed these numbers. I think I was just trying to imagine what a chicken production graph would look like with or without campaign. Naively thinking, blocking a farm would postpone the production by at least 1-2 years, because that’s how long it probably takes to get planning permits and build a farm. But 1-2 years felt like too optimistic though, so I was conservative, but probably not conservative enough.
Either way, those figures of years of impact are guesses in the spirit ofIf It's Worth Doing, It's Worth Doing With Made-Up Statistics, not estimates. I was supposed to finish the project and had no idea how to estimate these things, so I entered somewhat random numbers. Please don't take them seriously. I think you would be much better off ignoring them, and coming up with a new estimate from scratch. Clearly you are thinking about this much more deeply than I was.
Btw, another effect to consider is anticipation. Investors in Poland already know that new farms face a high risk of being blocked or delayed by protests. Given this, they may (a) decide not to build farms at all (but someone else might build them instead), (b) shift their plans to other countries where protests are less likely, or (c) submit more applications than they really need, expecting some to be blocked. Since the campaign has been active for years, it’s possible the market has already adapted to the reality that building new farms in Poland is unusually difficult, and has found alternative ways to meet the demand.
It might not be a genuine supply shift, if the same business/company would just want to set up elsewhere. You could model the probability that they wouldn't, so there would be a supply shift, and then use elasticities for that.
Thanks, Michael. I meant "[expected] leftwards shift in the supply curve" = "probability of a farm being built by the target company elsewhere (p)"*"leftwards shift if a farm is built by the target company elsewhere (R1)" + (1 - p)*"leftwards shift if no farm is built by the target company elsewhere (R2)". You are saying that R1 is 0, but I do not think this has to be the case. The farm would tend to start operations later if it had to be built elsewhere, and therefore there would be a temporary shift in the supply curve.
Thanks Vasco. I still don’t see how such a multiplier would solve the core issue for me. Say a chicken costs $1 and 1,000 of them are produced and sold. Market is at equilibrium. We close down a farm, and now 900 are produced and sold, and the price goes up. The real question for me is how quickly the market adjusts back—how soon someone else builds another farm to fill that gap. I have no idea. I’ve never seen an economic metric that directly measures that speed of recovery. If an economist were to estimate it, I imagine elasticities would be part of the picture, but I don’t know how that estimate would actually look. So at this point, I’d rather not introduce a multiplier that might confuse me and readers without solving the problem I’m trying to get at.
I saw cumulative elasticity factor being used for impact estimations of veganism. I get it: if some people stop buying chicken, and now only 900 are sold at $1, the price might drop to $0.9. Then the question of how much production contracts is where elasticities come in. But with production shifts it feels different, messier. If we assumed that vegans would start eating chicken again once the price falls, then even the veganism case would be just as confusing.
Thanks, @saulius. I am tagging you because I updated the comment.
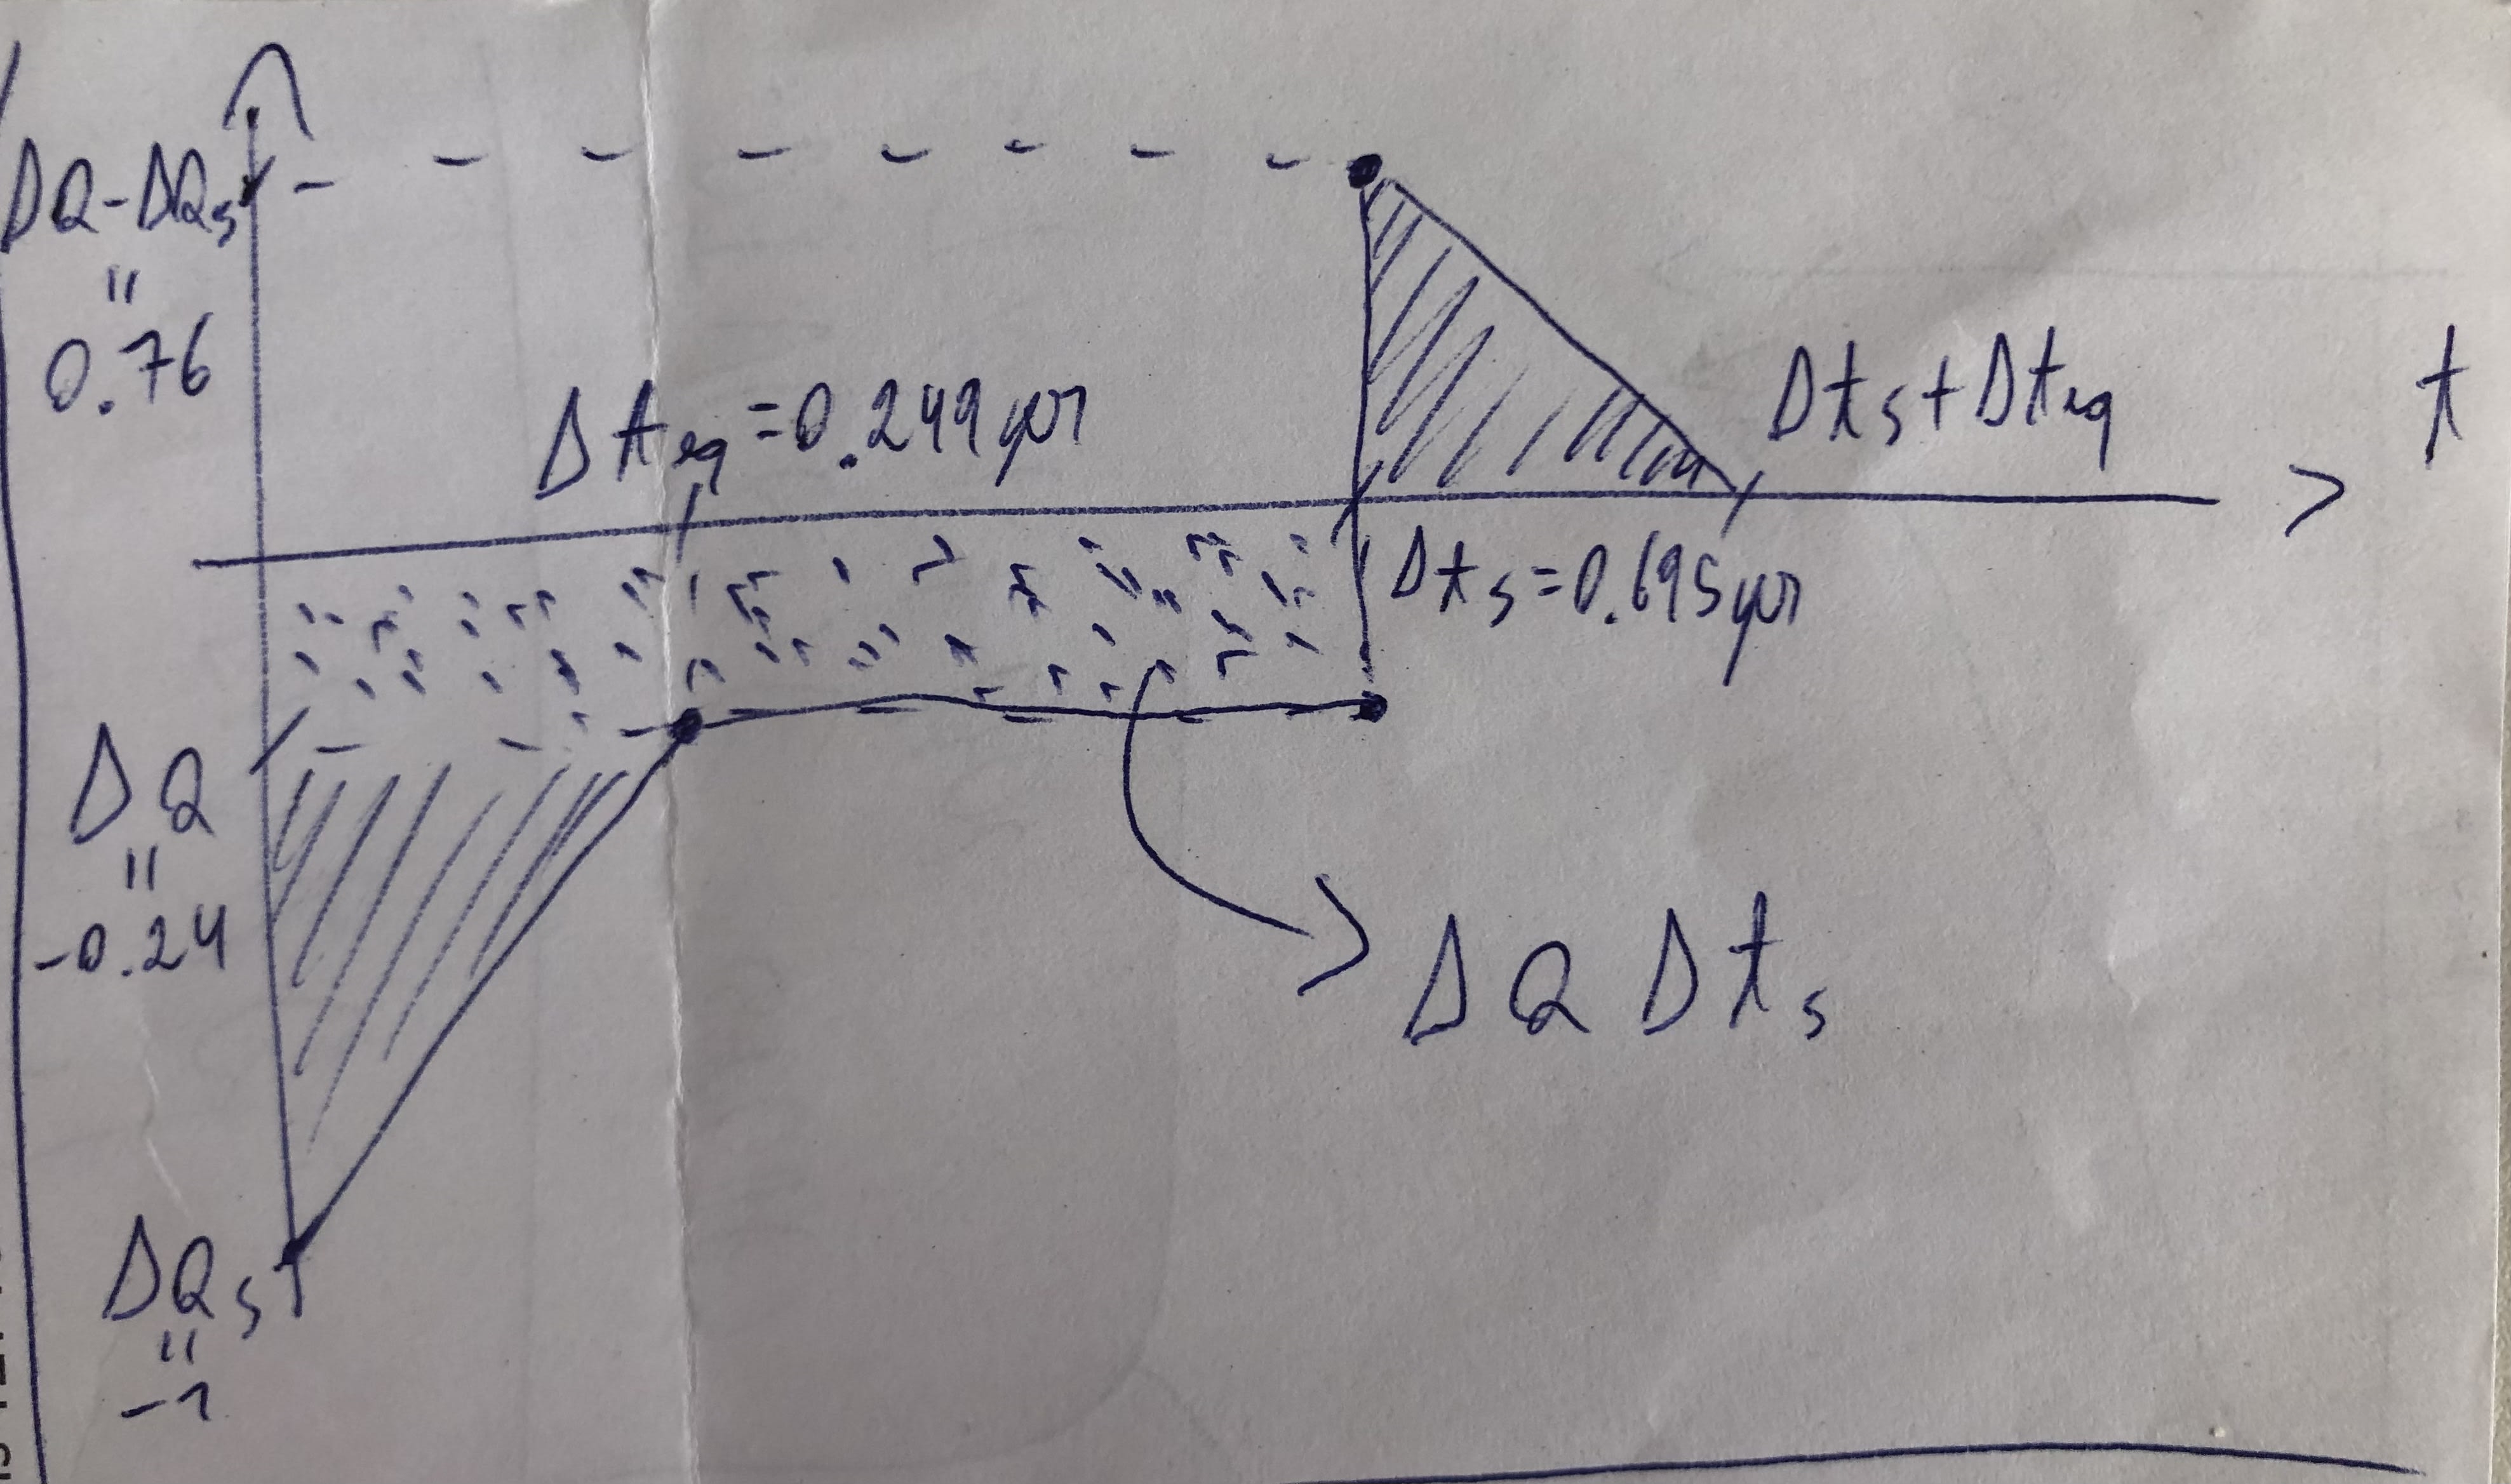
Below is a sketch of how I am imagining the change in demand/supply would evolve over time. It would initially be equal to the shift in supply Delta_Q_S (negative of the annual production of the affected farm), then increase to Delta_Q at equilibrium after Delta_t_eq (where Delta_Q = (1 - CEF)*Delta_Q_S), then remain at Delta_Q until Delta_t_S after the initial shift (where Delta_t_S is the duration of the shift in the supply curve), then increase by -Delta_Q_S to Delta_Q - Delta_Q_S (as a result of a new farm starting operations), and then decrease to 0 over Delta_t_eq. The total change in demand/supply is the integral of the line below over time. The shaded areas are equal, so the total change in demand/supply is Delta_Q*Delta_t_S = (1 - CEF)*Delta_Q_S*Delta_t_S. This directly depends on CEF = E_S/(E_S - E_D), so I would say the elasticities very much matter.
I would estimate Delta_t_S from "probability of i) farm being built in the original place"*"delay of the start of the farm's operations given i)" + "probability of ii) farm being built elsewhere"*"delay of the start of the farm's operations given given ii)" + "probability of iii) farm not being built"*"lifetime of the farm". It looks like your estimates for the years of impact refer to Delta_t_S. If so, for CEF equal to 76 % (as in Figure 8.2 of Norwood and Lusk (2011)), I believe the impact is 24 % (= 1 - CEF) as large as you estimated.
For CEF equal to 76 %, and Delta_t_S equal to 0.695 years (= (20.9*1.0 + 67.5*0.6)/(20.9 + 67.5)), which is your estimate for the years of impact weighted by the number of broilers affected, the reduction in the demand/supply of chicken meat is 16.7 % (= (1 - 0.76)*0.695) of the annual production of the targeted farms.
I am taking a break from research and I won't try to understand what you wrote here because it's currently over my head and that's not the type of thing I want to focus on right now in life. You can talk with Jakub Stencel if you are interested on improving my estimates, he would tell you whether it's worth it (he is on the forum you can just tag him). But you might also need to talk to someone who say works on the stop the farms campaign for some context. They say that there will be protests against new farms no matter where they are built within Poland because of the network Anima created, but in most other countries it's not happening. To me the bigger question is if the campaign is even net-positive, because it might just shift production to countries where it's more difficult to improve conditions for farmed animals.
Some random thoughts about your message: * I did look into elasticities during my project and other elasticities of chicken can be found in this very old ACE spreadsheet and in this paper which analyzes elasticity some years ago in Turkey and says “According to the supply and demand functions for chicken meat, supply elasticity is 0.377 and demand elasticity is 0.030”. I remember comparing the two and getting wildly different numbers. * I will say that tI still don't understand what you mean that "the reduction in the demand/supply of chicken meat is 16.7 % (= (1 - 0.76)*0.695) of the annual production of the targeted farms." I mean, if we say closed a farm of a million broilers, in the very short term at least, surely the reduction of the number of broilers farmed in the world is one million. It's not like those other chickens instantly appear somewhere else. So to me the question is still how quickly market goes back to equilibrium. Your variable Delta_t_S and my guess of 0.695 years of impact seem like two different things by the way. Maybe the reduction in production for a closed farm is 16.7% × "the lifetime of a farm"? Plus a bit more because it would take the market some time to adjust?
Thanks, Saulius. I was looking into this because I started working with Animal International 2 weeks ago, but I like public conversations (as long as confidential information is not shared).
this paper which analyzes elasticity some years ago in Turkey and says “According to the supply and demand functions for chicken meat, supply elasticity is 0.377 and demand elasticity is 0.030”. I remember comparing the two and getting wildly different numbers.
These elasticities imply a cumulative elasticity factor of CEF = 92.6 % (= 0.377/(0.377 + 0.030)). In this case, 1 - CEF = 7.4 %, which is 30.8 % (= 0.074/0.24) of the value implied by Figure 8.2 of Norwood and Lusk (2011).
I will say that tI still don't understand what you mean that "the reduction in the demand/supply of chicken meat is 16.7 % (= (1 - 0.76)*0.695) of the annual production of the targeted farms."
If the operations of a farm are delayed by Delta_t_S years, I would estimate the integral of the reduction in demand/supply over all time to be Delta_Q*Delta_t_S = (1 - CEF)*Delta_Q_S*Delta_t_S = (1 - 0.76)*"annual production of the delayed farm"*Delta_t_S.
I mean, if we say closed a farm of a million broilers, in the very short term at least, surely the reduction of the number of broilers farmed in the world is one million. It's not like those other chickens instantly appear somewhere else.
I agree. This is represented in my drawing by the change in demand/supply starting at -1.
So to me the question is still how quickly market goes back to equilibrium. Your variable Delta_t_S and my guess of 0.695 years of impact seem like two different things by the way. Maybe the reduction in production for a closed farm is 16.7% × "the lifetime of a farm"? Plus a bit more because it would take the market some time to adjust?
Here is a description of my graph which may help:
At t = 0, there is a leftwards shift in the supply curve (less supply for the same price) because the operations of a new farm were supposed to start then, but they are delayed due to Stop the Farms.
From t = 0 to t = Delta_t_eq, the market adjusts, with other farms (not necessarily in Poland) producing more, and stocks (not necessarily in Poland) being spent to offset the reduced supply.
At t = Delta_t_eq, the market reaches the new equilibrium.
From t = Delta_t_eq to t = Delta_t_S, the market stays at the new equilibrium.
At t = Delta_t_S, there is a rightwards shift in the supply curve (greater supply for the same price) because the operations of a new farm start then (not necessarily in Poland).
From t = Delta_t_S to t = Delta_t_S + Delta_t_eq, the market adjusts, with other farms (not necessarily in Poland) producing less, and stocks (not necessarily in Poland) being saved to offset the increased supply.
My understanding isthat your estimates for the years of impact refer to Delta_t_S, which is the expected duration of the delay of the start of the operations of a new farm. So it seems to me that the impact should be 24 % (= 1 - CEF) of what you estimated for CEF = 76 %.
Executive summary: This exploratory cost-effectiveness analysis of Anima International’s animal advocacy programs in Poland finds that several interventions—particularly the “Stop the Farms” campaign and cage-free reforms—appear highly cost-effective in reducing farmed animal suffering, though the results are highly uncertain due to reliance on subjective estimates, especially around years of impact, pain intensity, and counterfactual scenarios.
Key points:
All programs analyzed were estimated to help multiple animals per dollar spent, with “Stop the Farms” and broiler reforms showing particularly high cost-effectiveness under certain metrics, though future estimates are more speculative than past ones.
Two welfare metrics—DCDE (Disabling Chicken Day Equivalent) and SAD (Suffering-Adjusted Days)—produce different rankings of interventions, revealing that cost-effectiveness assessments hinge on how different pain intensities are weighted; cage-free reforms appear far more effective under SADs, while broiler reforms dominate under DCDEs.
Uncertainty is a central theme throughout the analysis, with many inputs based on the intuitions of campaign staff, subjective probabilities (e.g., chances of policy success), and debatable pain intensity weightings derived from small informal surveys.
Some interventions might have counterproductive effects, such as displacing animal farming to countries with lower welfare standards or increasing wild animal suffering via reduced animal agriculture.
Despite uncertainty, Anima International’s programs compare favorably to those evaluated by ACE and AIM, especially under the SAD metric, suggesting they may be a strong candidate for funding—especially for donors comfortable with hits-based giving.
The author introduces a novel method for estimating ‘years of impact’ and pain conversion metrics, but emphasizes that further research is needed to validate these approaches and develop more objective frameworks for animal welfare cost-effectiveness analysis.
This comment was auto-generated by the EA Forum Team. Feel free to point out issues with this summary by replying to the comment, and contact us if you have feedback.
I have looked into the impact of Stop the Farms (SF) on soil animals. For your result that it decreases 55 broiler-years per $, I estimate it causes 662 billion deaths of soil animals per $ due to decreasing the agricultural land needed to feed broilers. The vast majority of the deaths from soil animals are from soil nematodes, and some of these seem very painful. For a spending on SF of 35 k$/employee-year, it causes 23.2 quadrillion deaths of soil animals per employee-year.
This is a crosspost from the new Animal Welfare Alignment Newsletter by Anima International. You can subscribe on Substack if you are interested in following these efforts. Audio reading also available on Substack.
The goals of this post are to:
1. Raise a question I see as crucially important to the goal of aligning AI to animal welfare...
Hello! I'm Justin Portela. I got hired by GWWC to make YouTube videos after AI in Context did such a kickass job.
My channel is using that same cinematic, high-production value beauty to talk about everything in the EA universe that isn't AI.
...
“How long have you been v*g*n?”
This is one of the most common icebreakers at animal protection events. It’s a baseline assumption, and it mostly holds true: if you’re out advocating for animals not to be tortured or abused, realistically these days you are v**n, or close. And it makes for good conversation. It seems fairly safe to assume when you meet strangers.
But this assumption is hurting the movement in a way which we don’t always notice: someone new comes into the sp...
In this article, I estimate the cost-effectiveness of five Anima International programs in Poland: improving cage-free and broiler welfare, blocking new factory farms, banning fur farming, and encouraging retailers to sell more plant-based protein. I estimate that together, these programs help roughly 136 animals—or 32 years of farmed animal life—per dollar spent. Animal years affected per dollar spent was within an order of magnitude for all five evaluated interventions.
I also tried to estimate how much suffering each program alleviates. Using SADs (Suffering-Adjusted Days)—a metric developed by Ambitious Impact (AIM) that accounts for species differences and pain intensity—Anima’s programs appear highly cost-effective, even compared to charities recommended by Animal Charity Evaluators.
However, I also ran a small informal survey to understand how people intuitively weigh different categories of pain defined by the Welfare Footprint Institute. The results suggested that SADs may heavily underweight brief but intense suffering. Based on those findings, I created my own metric DCDE (Disabling Chicken Day Equivalent) with different weightings. Under this approach, interventions focused on humane slaughter look more promising, while cage-free campaigns appear less impactful. These results are highly uncertain but show how sensitive conclusions are to how we value different kinds of suffering.
My estimates are highly speculative, often relying on subjective judgments from Anima International staff regarding factors such as the likelihood of success for various interventions. This introduces potential bias. Another major source of uncertainty is how long the effects of reforms will last if achieved. To address this, I developed a methodology to estimate impact duration for chicken welfare campaigns. However, I’m essentially guessing when it comes to how long the impact of farm-blocking or fur bans might last—there’s just too much uncertainty.
Background
In 2024, Anima International contracted Nuño Sempere and I (Saulius Šimčikas) to assess their cost-effectiveness in Poland, partly to inform internal decisions. Both me and Nuño were compensated for the evaluation. However, I didn’t feel pressure to reach positive conclusions. Anima International communicated to us that they would like to publish the results no matter the results for transparency and accountability.
Results
You can see the estimates in this spreadsheet. I will not go through all the estimates in this article because they are presented in the spreadsheet. Here are the results:
Program
Farmed animals helped per USD spent
Farmed animal years impacted per USD spent
Budget, USD (based on 2024)
Past
Future
Past
Future
Cage-free
193
53
225
62
352K
Broiler
0
253
0
28
299K
Stop the farms
504
504
55
55
167K
Fur Farms
3
11
2
6.3
498K
Retailer plant-based commitments
32
15
53K
Average weighted by budget
117
136
68
32
In this article, K stands for one thousand (1,000), M stands for one million (1,000,000), and B stands for one billion (1,000,000,000).
In the table above, we can see that all interventions help multiple animals per dollar spent. Also, the number of farmed animal years impacted per dollar spent in the future (the bolded column) is within one order of magnitude for all evaluated interventions. To me, this was very surprising. It weakly suggests that there are multiple cost-effective approaches in animal advocacy.
To account for factors in intensity of suffering and sentience, I translated these results into my own metric, DCDE (Disabling Chicken Day Equivalent). I also converted some results into the SAD (Suffering-Adjusted Days) metric introduced by AIM, which puts a lot less weight on short but more intense suffering. As you can see in the table below, the relative impact of cage-free and broiler campaigns depends a lot on which metric is used.
Program
Future impact per USD
Budget, USD, based on 2024
DCDEs
SADs
Cage-free
50
540
352K
Broiler
622
241
299K
Stop the farms
1,732
1,222
167K
Fur Farms
309
498K
Retailer plant-based commitments
121
53K
Average weighted by budget
477
570
Later in this article, I show that Anima International programs in Poland seem cost-effective compared to those evaluated by ACE and AIM, when using SADs as the metric. For example, during AIM’s most recent research round, their cost-effectiveness threshold was 30 SADs per dollar—equivalent to their estimate for cage-free work in the Middle East, one of the programs they aim to launch.
However, if we measure cost-effectiveness in DCDEs, which puts much more weight on short but intense suffering, then things like humane slaughter reforms look a lot more cost-effective. For example, based on Grilo (2024), but using my own pain intensities, the cost-effectiveness of Shrimp Welfare Project’s Humane Slaughter Initiative would be 25,000 DCDE per USD - over fifty times higher than the estimated future cost-effectiveness of evaluated programs of Anima International in Poland.
Explanations of the programs
Cage-free commitments: This program works to eliminate cages for egg-laying hens by securing and enforcing corporate commitments to switch to cage-free systems. Current and future cage-free work is about ensuring that companies keep their commitments.
Broiler commitments: This campaign seeks corporate pledges to improve the welfare of chickens farmed for meat (broilers). Only a few commitments have been secured in Poland so far, and none have been implemented yet. Almost all of the expected future impact in my estimates comes from an assumed 3% chance that slow-growing broilers will eventually become the industry standard in Poland.
Stop the Farms: This program supports local communities in opposing the construction of new chicken and pig farms, highlighting negative effects on nearby residents. It is mostly run by one staff member. Poland is especially suited to this strategy due to the scarcity of locations far from residential areas.
Fur farms: This campaign aims to ban fur farming in Poland, where around 3.4 million minks are currently farmed. Past impact comes from possibly preventing some mink farms from being built by making it a more risky investment. A small part of the work is also focused on the EU ban of fur farming and fur imports, but I didn’t include the impact of EU policy work in my estimates.
Retailer plant-based commitments: Part of Anima International’s food transformation program, this campaign encourages retailers to commit to increase plant-based protein sales to at least 20% of their total protein sales. The campaign is only launching now. Hence my estimates depend on the intuitions of Anima International staff about how successful it will be. The campaign is expected to require less than one full-time equivalent.
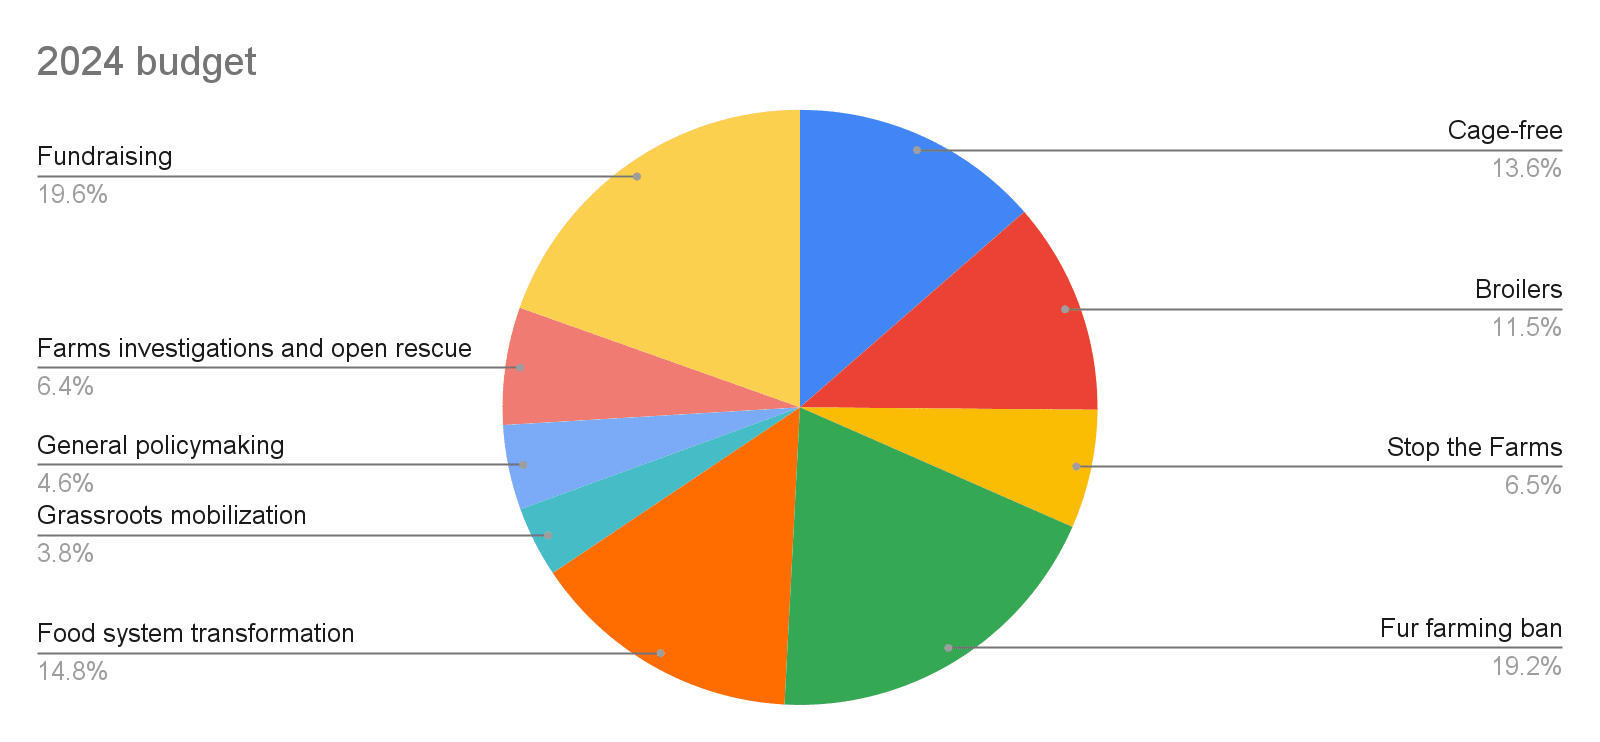
For context, here is the 2024 budget for Anima International in Poland:
Notes about the graph above:
Overhead costs (leadership, management, HR, admin, IT) are allocated to each program in proportion to its share of the overall budget. All estimates in this article are based on costs that already include a proportional share of these overheads.
Food system transformation includes retailer plant-based commitments and advocating for the government, as well as the private sector, to do things like support alternative proteins.
Expenses for chicken farm investigations are included under the broiler and cage-free program budgets, as they directly support those campaigns.
Why these estimates are very uncertain
I worry that people will interpret these estimates as much more certain than they are. My estimates largely rely on subjective opinions as there isn’t enough objective data to inform all parameters. Many of these judgments are based on the intuitions of Anima International staff members, especially those of Pawel Rawicki, the CEO of the Polish branch. As far as I could tell, Pawel and the other staff members I consulted made a genuine effort to remain objective, and the organisation has a culture that encourages open-minded discussion.
However, relying on staff opinions inevitably introduces some degree of bias. Those working on these issues are often the most optimistic about their impact, which can stem from several factors:
Selection bias: People skeptical about an intervention’s effectiveness are less likely to work on it, leaving those with more favorable views to provide assessments.
Motivated reasoning: Staff may naturally want to see their work as meaningful and impactful, both for personal satisfaction and external credibility.
Echo chamber effects: Working in a like-minded team can reinforce shared optimism, making critical perspectives less prominent.
Avoiding such biases would be very difficult as it would be very difficult for a researcher to independently assess all the parameters involved. I still think it is useful to see if a campaign looks competitively cost-effective even if some of the inputs are based on intuitions of people working on the campaign. Many programs might look ineffective no matter what intuitions we enter.
I divided estimates into past and future. When estimating the impact of past work, I assumed that all the work stopped at the end of 2024.[2] The estimates of past efforts cover all past years. For the cage-free program, this starts with 2015. If I were to redo the estimates, I would focus on more recent years, which would reduce the cost-effectiveness of past cage-free campaigns.[3]
Stop the Farms estimate is only based on the year 2021 because collecting data for all the years would’ve been very time-consuming for the staff. I was told that it was a typical year.[4] There was disagreement between staff members of Anima International about whether the campaign will increase or decrease in cost-effectiveness in the future, so I assumed that the cost-effectiveness will remain the same.
Future estimates of all programs are very uncertain. They show the expected value of the number of animals helped. For example, all the future impact of the fur farm campaign comes from the possibility of a fur farming ban. People working on this ban predicted that there is a 35% chance that such a ban will be achieved by the end of 2027. I think that estimates for broiler and retailer plant-based campaigns are even more subjective and uncertain. These campaigns might end up having very little impact, or be very impactful - we just don’t know yet. Hence, donating to these campaigns could be considered as hits-based giving.
It’s also not even certain that some of these programs do more good than harm to animals.
Stop The Farms campaign could be just moving animal production to countries where improving animal welfare could be even more challenging. If a chicken farm is blocked in Poland, another farm might be built in, say, Romania to meet the same demand—potentially with even lower welfare for chickens. A similar argument can be made about efforts to ban fur farms in Poland, though I think it’s slightly less convincing because fur farming is steeply declining worldwide.[5]
Stop The Farms program might also be making it more difficult to build new high welfare farms, making welfare improvements more difficult, even though they don’t campaign against the building of farms that are known to be high-welfare.
Retailer plant-based commitments campaign tries to reduce animal production, which could increase wild animal suffering, and hence overall animal suffering.
I listed many ways chicken welfare reforms could have a negative impact here.
My estimates focus only on direct, quantifiable effects, excluding potentially significant indirect impacts such as:
These could plausibly outweigh the direct impacts but are too uncertain to quantify.
I also don’t analyse room for more funding. I estimate the total impact per dollar spent. The value of a marginal dollar donated to the organisation could be very different.
Animal welfare metric
As mentioned, I created a metric called “Disabling Chicken Day Equivalent” (DCDE). One DCDE is as bad as a chicken spending one day in disabling pain. Disabling pain here means the same thing as it means when used by The Welfare Footprint Institute. It is defined as follows:
Pain at this level takes priority over most bids for behavioral execution and prevents all forms of enjoyment or positive welfare. Pain is continuously distressing. Individuals affected by harms in this category often change their activity levels drastically (the degree of disruption in the ability of an organism to function optimally should not be confused with the overt expression of pain behaviors, which is less likely in prey species). Inattention and unresponsiveness to milder forms of pain or other ongoing stimuli and surroundings is likely to be observed. Relief often requires higher drug dosages or more powerful drugs. The term Disabling refers to the disability caused by ‘pain’, not to any structural disability.
Where possible, my estimates used the conclusions from The Welfare Footprint Institute. They have four categories of pain: annoying, hurtful, disabling, and excruciating. They don’t provide how to weigh these different categories of pain against each other. To determine what these weights should be, I made three very similar small informal surveys, asking people to trade-off different types of pain against each other. In total, I got 43 responses that I deemed to be usable. You can see one of the survey designs here, and the survey results and analysis here.
Here are the results using the DCDE metric:
Program
Impact in DCDE
DCDE per USD
Past
Future
Past
Future
Past & Future
Cage-free
181M
86M
182
50
99
Broiler
1.4B
0
622
466
Stop the farms
1,732
1,732
1,732
Fur Farms
143M
205M
98
309
163
Retailer plant-based commitments
39M
121
121
Converting results to DCDE required making some very speculative guesses about the suffering of animals that were not evaluated by The Welfare Footprint Institute. For example, I assumed that one day of mink farming is 1.5 times as bad as one day of fast-growing broiler farming. This is only based on intuitions of a few people I talked to about this. However, this is just a placeholder, because if we estimate the value of preventing a mink from being farmed in DCDEs, then it is very sensitive to how much intense pain minks experience, which is something I know nothing about.
I also used ChatGPT to guess consumption, lifespan, and welfare of all animals consumed for food in order to guesstimate DCDEs for retailer plant-based commitments. This guesstimate is also very uncertain.
Comparison to SADs
After inventing my own metric of DCDEs, I found that in 2024, AIM introduced an analogous metric they use for their charity evaluations called SADs. I converted my weightings into SADs below:
Program
SAD multiplier
Future impact per USD
DCDEs
SADs
Cage-free
10.7
50
540
Broiler
0.4
622
241
Stop the farms
0.7
1732
1,222
As you can see, the results look very different. Cage-free campaigns look relatively much more cost-effective. This is because AIM puts a lot less weight on more intense types of pain. Tables below show what amounts of time each metric assumes to be equivalent to one second of excruciating pain, and one day of disabling pain, respectively.
Annoying
Hurtful
Disabling
Excruciating
SAD
6 minutes
57 seconds
12 seconds
1 second
DCDE
300 days
2.5 days
1 hour
1 second
Annoying
Hurtful
Disabling
Excruciating
SADs
32 days
5 days
1 day
2 hours
DCDEs
20 years
60 days
1 day
24 seconds
Even though my choices are probably based on less research than the ones by AIM, it’s noteworthy that different researchers came to such different conclusions about what these weights should be. There was a lot of disagreement about how to weigh different types of pain amongst the 43 respondents to my surveys as well. For example, one of the questions was “Imagine you have to choose between one second of excruciating pain and a period of annoying pain. How long would the annoying pain need to last for you to feel indifferent between the two options?” Answers included “like 10 minutes,” “10,000 years,” and “an indefinite period of time”.[6] However, the SAD metric assumes that it’s 6 minutes, which is less than the answer of any respondent to my surveys.
I based the trade-offs used in the DCDE metric on the median values of survey responses. This approach minimized the influence of outlier responses from people who assigned extremely high priority to avoiding excruciating pain, like the ones mentioned above. Some other ways to interpret the survey would’ve led to excruciating pain being valued many times more than the DCDE metric does.[7] But judging interventions solely on their ability to reduce extreme pain would misrepresent the effectiveness of programs designed with broader goals in mind.
I haven’t reviewed the literature on what weights are reasonable but Gómez-Emilsson (2019) argues that worse pains are many orders of magnitude worse than mild pains. I think that the question of how to weight different pain intensities used by the Welfare Footprint Institute deserves more research, and I imagine it could be researched in many different ways.
Comparison to other charities
Comparisons of SADs estimates
Converting my estimates into SADs also allows comparisons with interventions evaluated by ACE and AIM in 2024:
In the table above, we can see that Anima International compares favourably with other evaluated interventions. In this table, all the ACE estimates are from ACE-recommended charities, and both AIM estimates are for charities they aim to launch. Older ACE and AIM estimates don’t use SADs. I haven’t found other estimates I could compare to. Also, methodologies are different which make comparisons less fair.
Note that in the early years, cage-free campaigns in Poland relied on people working for very little or no money, which was likely unsustainable. This inflates the cost-effectiveness per dollar spent of past cage-free campaigns.[8]
Comparisons of cage-free estimates
Both AIM’s and ACEs estimates are significantly more conservative. Hence, below I change some estimates to match my intuitions, so that they would be more comparable with my estimates of Anima International programs.
ACE’s cage-free estimate for Kafessiz Türkiye assumes that commitments were brought forward by 20.5 years, and also applies a yearly discount of 4%. This can be translated to years of impact estimate of 14.3. Based on a conversation with the director of Kafessiz Türkiye, I would’ve chosen a much higher value here. Perhaps 40 years because I see no way of cage-free changes happening in Turkey by themselves (you can see how I think about years of impact in the next section). This would increase the estimate for Kafessiz Türkiye to 150 SADs per USD. ACE doesn’t calculate the cost-effectiveness of implementation work. If Kafessiz Türkiye pursues such work, it would increase their cost-effectiveness further.
AIM estimate for cage-free campaigns in the Middle East doesn’t have a value equivalent to years of impact. But we can see that for Saudi Arabia, they expect 25,137,885 chickens to be impacted per year, and 220,991,111 chickens in total. Hence, we can calculate that they expect the impact to last for 220,991,111 / 25,137,885 = 8.8 years. I get the same number for other countries as well. I would choose a much higher number but I would also probably be much more pessimistic about the chances of success. Perhaps these two differences in opinion counteract each other.
If we use DCDEs instead of SADs, cage-free campaigns in the Middle East and Turkey appear much more cost-effective. These regions still use battery cages, which, according to the Welfare Footprint Institute, cause significantly more disabling pain—mainly due to nesting deprivation. In contrast, EU countries use furnished cages, which alleviate most of this suffering. Hence, the Welfare Footprint Institute’s estimates suggest that the switch from furnished cage to cage-free doesn’t reduce a lot of intense pain, which makes it look less effective when using to the DCDE metric.
Impact per hen in DCDEs
Impact per hen in SADs
Move from battery cage to furnished cage
13.7
7.4
Move from battery cage to cage-free
14.6
17.5
Move from furnished cage to cage-free
0.94
10.1
For how many years do reforms have an impact?
One of the most uncertain parameter in all estimates is “years of impact”. We might have a solid estimate about how many animals are helped per year by a given reform. But it’s tricky to evaluate for how many years this effect might persist, especially now because the future seems so uncertain. Sometimes people choose a somewhat random (and usually very conservative) value like 5 years. Often, a very different value like 50 years might be just as reasonable of a choice, and that would make the estimated cost-effectiveness ten times as large.
For chicken welfare reforms, I attempted to develop a methodology for estimating years of impact but it’s still very much based on subjective intuitions. I am at a loss regarding how to think about years of impact for Stop The Farms and Fur Farming ban, and my choices here feel random.
Cage-free
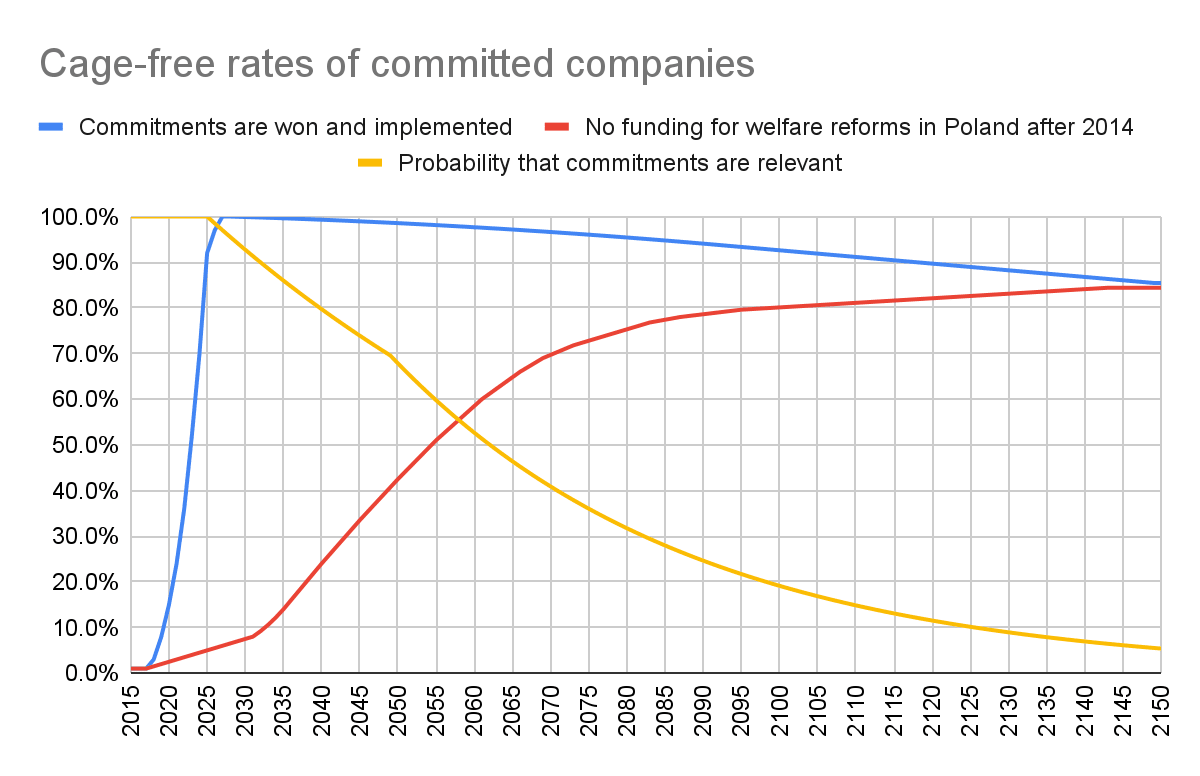
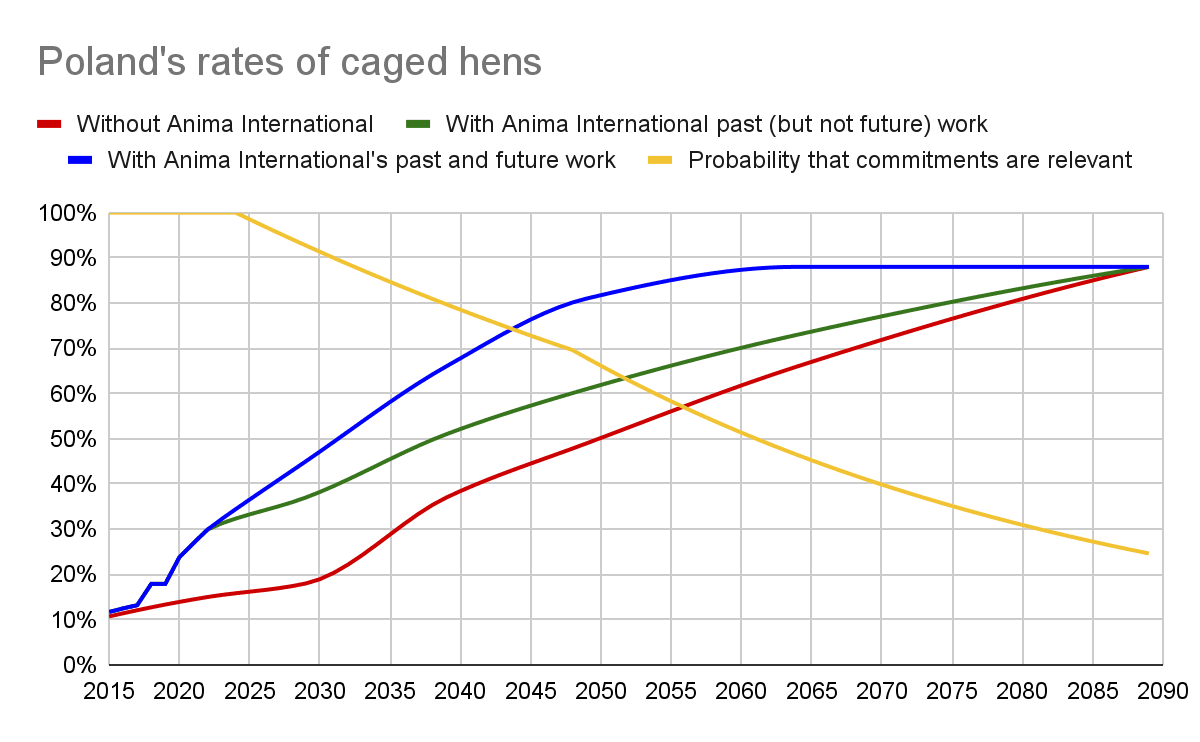
I tried estimating years of impact using graphs like this:
A typical cage-free commitment in Poland might be won in 2018, with a deadline in 2025. Red and blue lines in the graph above represent cage-free rates of a given committed company under various scenarios. The blue line models cage-free rates of committed companies if they fulfil the commitment. The probability that companies might not fulfil their commitments is accounted for separately. The blue line goes down slowly to account for possibilities like:
economic or sustainability pressures to go back to more efficient farming systems, especially during crises or wars
companies dissolving or merging without maintaining the commitment,
companies ignoring or forgetting commitments made decades ago
The red line models cage-free rates of committed companies in the hypothetical world where there was never any professional direct work on cage-free advocacy in Poland. In other words, it models the counterfactual scenario. In this case, the red line goes up mostly because of the possibility of a legislative EU cage ban some time in the future. It also goes up because of possibilities like:
Campaigns run by unpaid volunteers
Consumer demand for higher welfare products
Influence of books, documentaries, videos, and social media on companies, governments, and voters.
Demand for higher animal welfare could rise significantly if transformative AI leads to much higher incomes. However, even in wealthy countries, there's probably no progress on the welfare of farmed species that lack focused advocacy — like ducks, sheep, and others.
The yellow line accounts for the possibility that commitments will stop being relevant due to things like x-risks, global catastrophic risks, societal collapse, cultured meat taking over, animals bred not to suffer, black swans, etc. I guess that yearly probabilities of one of these things happening are:
1.5% per year in 2025-2049
2.5% per year in 2050-2150
1% per year after 2150
These values are partly based on my own intuitions, and partly forecasts to this metaculus question. The question is about broilers but I imagine that predictions about egg-laying hens would be somewhat similar. The values of red and blue lines are based on my intuitions after talking about the question with multiple animal advocates. But they are also by no means authoritative. Please comment if you think these values should be different.
Finally, we estimate the expected proportion of hens used by companies that will be cage-free each year as follows: (blue - red) ✕ yellow. And then we add up the result for all years to calculate years of impact. In this case it’s 26 years.
Here is some reasoning that would lead to a similar conclusion. An average corporate commitment might be implemented in 2025. The EU cage ban for hens might be passed with a deadline of around 2055 (based on people's answers, that would be roughly the median guess). So about 30 years. A chance that commitments might no longer be relevant due to x-risks and other reasons would make it less than 30 years. The chance that an EU cage ban might never happen would make it more than 30 years. Perhaps these two effects cancel each other out, somewhat.
I also created an alternative estimate based on Pawel Rawicki’s (Anima International CEO) intuitions and a different counterfactual, which is better suited for estimating the years of impact for future work:
The result for future work was almost the same, but for the past work it was two times lower.
Animals helped per USD
Past
Future
Main cage-free estimate
193
53
Alternative cage-free estimate
107
58
Broilers
Based on my conversations, most of the impact from broiler campaigns seem to come from a small probability that slow-growing broilers will become the default in the country, as you can see in the table below. If only a few companies implement the commitment, the changes might not persist for long.
Very optimistic
Optimistic
Pessimistic
No impact
Probability of this scenario
3%
12%
40%
45%
% of broilers consumed in Poland covered by commitments that will be implement a slow growing breed
90%
20%
5%
0%
Years of impact if successful
25
8
4
0
Broilers impacted
13.4B
966.9M
120.9M
0K
FTEs
300
100
60
40
Note that almost all the impact comes from just a 3% chance of these campaigns majorly succeeding. Pessimistic scenarios require fewer FTEs (Full Time Equivalents) because if campaigns don’t seem promising, they are more likely to be stopped.
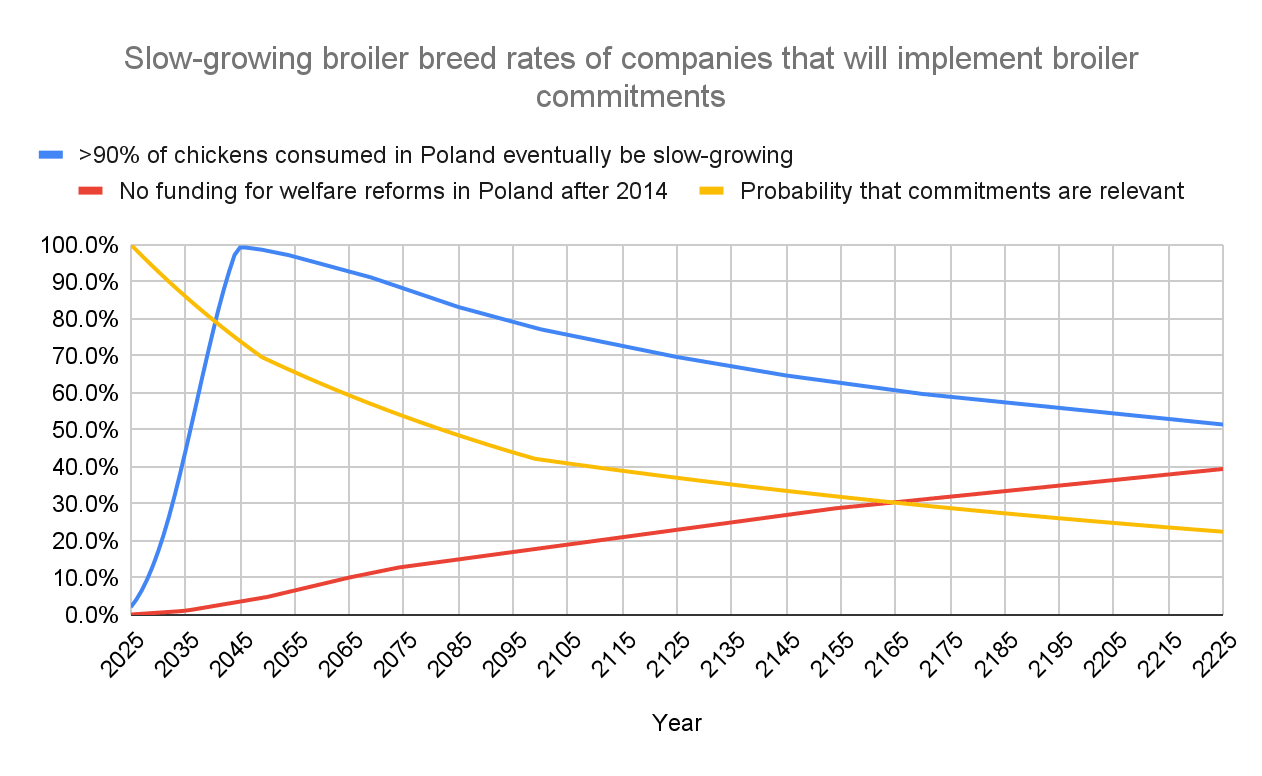
I used the graph below to estimate what should be the years of impact value for the very optimistic scenario in the table above.
The graph suggests 28 years of impact. However, when extrapolating this far into the future, the methodology fails to account for the possibility that reforms might eventually happen with much less advocacy effort, due to a more favorable political or socio-economic climate. To reflect this, I subjectively reduce the years of impact in the optimistic scenario by 3 years, resulting in an estimate of 25 years.
Stop the farms
When local residents successfully protest against a planned chicken farm, production will likely increase elsewhere to meet demand—but how quickly? I found no clear methodology to estimate this and received no definitive answers when I asked on an economics forum. As far as I know, it could take anywhere from a week to 20 years, and the choice massively impacts cost-effectiveness.
I guess there’s a 45% chance that blocking a farm delays production by just one month, as the market might adjust quickly to meet demand elsewhere. I guess there’s a 50% chance of a one-year delay. And I guess there’s a 5% chance that stopping a farm leads to 10 fewer years of chicken farming—on the assumption that, in some cases, limiting supply can reduce long-term demand rather than simply shifting production. These assumptions yield an expected delay of one year, though this is highly uncertain.
The program also delays some farms, rather than blocks them. The average delay for that particular farm is about two years. But there is also the possibility that a different farm will be built (perhaps in another country) to fill the demand quicker. Hence, I guess the years of impact value of 0.6 years.
Note that it takes multiple years to get permits and to build a farm. Also, there are likely to be protests against new farms if they are built anywhere in Poland, so the increase in production would likely have to come from other countries.
This is the weakest part of my cost-effectiveness model. If anyone knows how to tackle this question, please comment.
Fur farms
Estimating the years of impact for a fur farming ban is similarly challenging due to uncertainty about how long the effects would last and the extent of production relocation. However, unlike broiler farming, the fur industry is in a steep long-term global decline. According to FIFUR, global mink pelt production fell from 52.2 million in 2019 to 12.3 million in 2023, and fox pelts from 13.7 million to 2.4 million. It's possible that in this might be a case where to some degree, supply creates demand: as long as farms exist, they’ll likely find markets, but if they're shut down, new ones are unlikely to open. Even if that is true, banning fur farms in Poland might still prolong the existence of fur farms in other countries as they might be able to find enough demand for longer. And it’s also very possible that new farms will be built elsewhere to meet the demand. In fact, it is my understanding that some fur production shifted to Poland after fur farming was banned in other countries. But even if that would happen, such shifts take time. Therefore, I guess the years of impact to be 6 years. It is very much a guess.
Thank you to
Nuño Sempere for developing some of the estimates together. You can see his writeups here and here, and our last estimates together here. Perhaps 20% of work here has been done by Nuño or based on his ideas.
Paweł Rawicki, Jakub Stencel, Bartosz Zając, Ilona Rabizo, and other staff members of Anima International for providing data and opinions about the programs.
Vasco Grilo, Katarzyna Streich, Paweł Rawicki, Nuño Sempere, and Jakub Stencel for reviewing the article. All mistakes are my own.
My estimates suggest that if the impact of wild-caught fish consumption was included, then the number of animals helped by retailer plant-based commitments might jump very roughly from 32 to 150 animals helped per dollar spent. I assume that these commitments will equally reduce the consumption of all animal products and even minor consumption of small fish like sprat and herring increases the numbers of animals consumed a lot. The number would significantly increase further if wild fish caught to feed farmed animals and bycatch were included (see this estimate as an example).
For example, even though ECC commitments covering about 20 million broilers were achieved, it seems very unlikely that they would be implemented without further work on broiler welfare in Poland. Hence, my estimates assume that the past broiler work has no impact. That is, my estimates ignore the fact that past work makes achievements in the future easier. It assumes that all work on the program stops at the end of 2024. Past impact could be estimated more generously by assuming that winning the commitment is say 30% of the work. However, this would still fail to capture most of the impact of the past work, and estimates might be more difficult to interpret.
The lead on Stop The Farms program stated that 2021 was a typical year. He estimated that impact in 2023 and 2024 was likely somewhat higher and could remain elevated if larger farms continue to be built. However, we also need to account for atypical years like 2020 (COVID) and 2022 (invasion of Ukraine), when impact was lower. These factors seem to roughly balance out, making 2021 a reasonable baseline for estimating future cost-effectiveness.
Some may argue that banning fur farming in Poland could simply shift production to other countries, limiting the net impact on animal suffering. While this concern is valid, I believe the risk is smaller in this case. Fur farming is already in steep decline—according to FIFUR, global mink pelt production fell from 52.2 million in 2019 to 12.3 million in 2023, and fox pelts from 13.7 million to 2.4 million. My intuition is that this is a case where supply creates demand: as long as farms exist, they’ll likely find markets, but if they're shut down, new ones are unlikely to open. That said, banning fur farms in Poland might still prolong operations elsewhere, like in China.
Another example: one of the questions was “If you had to choose between one second of excruciating pain or a longer period of disabling pain, how long would the disabling pain need to last to feel equally bad overall?” Answers ranged from “5 seconds” to “more than 1 year.”
I also considered other choices. I couldn’t use simple arithmetic mean because a few outlier answers like “more than 1 year” would end up inflating the weights a lot. Hence, I calculated a 30% Winsorized mean which replaces all values above the 85th percentile with the 85th percentile value, before calculating the arithmetic mean of the modified dataset. I thought that this would be the fairest way to interpret the survey results. However, the resulting conclusions were too extreme for mathematical reasons that are different to explain verbally. For example, future broiler reforms ended up being about 3,700 times more cost-effective than future cage-free reforms, despite cage-free reforms affecting more years of chicken life per dollar spent. Also, 88% of the impact from broiler reforms came from an estimated 25 second reduction in excruciating pain per broiler affected.
If we compare the cost-effectiveness of Anima International’s past and future cage-free campaigns in Poland per FTE (Full Time Equivalent) rather than per dollar spent, then my estimates suggest that past campaigns are only about 34% more cost effective than future campaigns.


In 2023, Adam Shriver and I ran a workshop to try to figure out how to best address this question empirically. The event summary is here, but my overall updates based on that event were: