Comments
Cheers Rory, really interesting read.
Cross-posted from my Substack.
Epistemic status: I’ve puzzled over this for a long time but I’m not sure I came to the right answers. I'm sharing this partly because it might help others work on resource allocation, but mostly because some smarter reader might tell me how to do it better.
TL;DR:
When I was about 10, I started to learn algebra in school. Clearly a future EA, I had a brainwave on my way home one day: I can use this new math to become really good at Goldeneye, an N64 shooting game. I got increasingly excited as I walked downhill home, imagining myself briefly pausing the game, whipping out my notebook, firing off some calculations, and then, BAM, quick console controller movements would finish off my nemeses with the precision only numbers could provide.
So I got home, opened my notebook, and wrote “x = height of opposing player”.
I paused.
I paused longer.
"Eugh"
I closed my notebook and gave up.
I hadn’t been entirely wrong to try. In principle, there are optimal moves at any given moment that can maximize your chances of winning any game, and those can indeed be identified mathematically. But my 10-year-old brain realized the absurdity of computing all of my actions on paper, while constantly updating the calculations as the game progressed.
But this post isn’t about Nintendo, it’s about doing as much good as possible with limited resources.
A few years ago I helped set up a private foundation aiming to spend a few hundred million dollars over the coming years on global development. There is a staggering responsibility to spend that money effectively. As we planned our first year (a few $10ms in grants), I thought a lot about how to allocate funding to very different organizations under quite a bit of uncertainty on grantee potential. I didn’t solve it, but I ended up getting to a place that was good enough to begin. Maybe it’s useful, especially if you are working out how to spend sums that your field is not currently ready to absorb.
These metrics allowed for a neat division of labor. The cost-effectiveness estimate would be fully owned by the research team, while the % success estimates would be owned by the programs team.
Setting metrics was the easy part, the hard part was working out how to turn those numbers into a neat “Give Org A $3m this year” output.
Hold on, you might say, can’t you just copy the funding allocation model of [one of the famous big EA grant makers]. Surprisingly, at least a few years ago, no org I spoke to had a formula that says how much to allocate to a given opportunity. More common is to see if the opportunity passes your funding bar and fund it if it does, but there is no formula that says “we ideally would give this org $xM”, with the grant sizing generally left to the grantee to request.
Our case was also unique in that we had more money to spend than grantees in our field could currently absorb, and so we were in the position of building our field rather than just allocating to the opportunities that existed in front of us. We had the ability to support the most promising grantees to grow to absorb more, meaning we didn't need to simply "rank everyone by cost-effectiveness and give them as much money as they can take, starting at the top". We wanted to answer "how much would this grantee ideally take?".
So I turned to the VC/hedge fund world for inspiration. But I gradually realized that there are some fundamental differences between for-profit investment and grant-making that prevented us from simply copy-pasting from a hedge fund.
Non-profit funders are not penalized for missing amazing start-ups: A for-profit investor will be penalized for missing a great start-up by paying much more for the same share later on e.g. an investor buying shares in Uber in 2020 will really wish she had invested in Uber in 2010.
Grant-making doesn’t work this way: if I'm faced with a high-risk/reward non-profit, I can give them a small grant, learn if they do a good job with it, and then donate more, later, once my confidence is higher. All else equal, I don't take a hit on impact from waiting, but I do reduce my risk.
Non-profits don’t have to optimize for keeping their pot of money: A failed for-profit investment is more damaging than the immediate loss: if I lose a $100k investment, not only have I lost $100k, I’ve lost the compounding profits that that $100k could have made if I hadn’t lost it and been able to invest in future opportunities. What's more, a total failure will lead to going bankrupt and entirely prevent future investments. This dynamic will lead to rational for-profit investors being somewhat risk averse: you don’t want to risk losing your money and not longer being able to play the game, which typically results in investments being spread around opportunities of varying risk/reward rather than betting on just one amazing opportunity.
But a successful $100k grant costs a grant-maker just as much as an unsuccessful $100k: it costs $100k. All things equal, this makes it easier to take risks with grants that you might not want to take with for-profit investments
Note that the 2 dynamics above are somewhat at odds with each other. The former points to being less aggressive with high risk/reward opportunities since you can just wait until you have better information. The latter points to being more risk tolerant since you aren’t trying to maintain your pot of funding. The later sections will talk more about how we tried to balance these dynamics.[1]
We wanted to generally maximize impact, but with some risk aversion and spreading of bets, both because we could adjust our funding over time as our confidence levels changed but also because this was our first year of grant-making, and if we totally failed to generate impact, our donors might just drop us.
If we wanted to present that mathematically, we could model the implied utility function (roughly, "How excited are we by a particular grant") as a linear combination of:
We could then bring this all together into a single utility function, like AX + B ln(X + C) -D f- Df^2, where X is the funding allocated, f is risk, and A is cost-effectiveness, and B, C, and D would be constants that we could all align on through internal conversations and talking to our funders, based on how we valued risk.
Except… this all felt a lot like 10-year-old me writing “x= height of opposing player”. What numbers could we possibly substitute for B, C, and D that had any meaningful bearing on reality? That wouldn’t change as soon as we made our first grants and started learning about just how wide our error bars had always been?
So, and I will not pretend to have had a grand strategy behind this, we simply tried out a bunch of different methods for allocating funding using our key metrics, to see if we could tell if any “felt” more right than the others.
Here are toy examples based on our real grantees. If you want to play along, I suggest taking a look at these first and thinking through how you might allocate $30m:
| Org | Impact/$ | Probability of success |
|---|---|---|
| Org A | 1.5 | 42% |
| Org B | 3.4 | 38% |
| Org C | 1.3 | 28% |
| Org D | 1.0 | 58% |
| Org E | 1.5 | 57% |
| Org F | 1.3 | 75% |
| Org G | 2.5 | 70% |
| Org H | 3.4 | 72% |
| Org I | 1.8 | 82% |
| Org J | 2.8 | 60% |
| Org K | 1.7 | 20% |
Below, I’ll walk through the different allocation strategies we considered for our first $30m in grants, along with the gut reactions from colleagues and internal discussions.
Straightforward enough. Multiply the cost-effectiveness by probability of success, get an expected return, allocate proportionally. Here’s how that would look for some example grantees:
Org | Impact/$ | Probability of success | Expected CE (Impact/$) | $ allocation: proportional to expected CE |
| Org A | 1.5 | 42% | 0.6 | $1,200,000 |
| Org B | 3.4 | 38% | 1.3 | $2,500,000 |
| Org C | 1.3 | 28% | 0.4 | $700,000 |
| Org D | 1.0 | 58% | 0.6 | $1,100,000 |
| Org E | 1.5 | 57% | 0.9 | $1,600,000 |
| Org F | 1.3 | 75% | 1.0 | $1,900,000 |
| Org G | 2.5 | 70% | 1.8 | $3,400,000 |
| Org H | 3.4 | 72% | 2.4 | $4,700,000 |
| Org I | 1.8 | 82% | 1.5 | $2,800,000 |
| Org J | 2.8 | 60% | 1.7 | $3,200,000 |
| Org K | 1.7 | 20% | 0.3 | $700,000 |
“Impact” here is just put into generic units, you could imagine something like “lives saved”, “DALYs averted”, etc
This approach felt wrong. It pushed us to spend large sums on orgs that felt quite high risk, when we knew that with a smaller grant we could learn more about their chances of success and choose to go bigger next year– it actually wasn’t optimal to go big immediately if we could gain more confidence in our higher risk investments first.
The Risk Buckets idea was a reaction to the above. With Risk Buckets allocate funds into different buckets based on risk levels, then optimize within each bucket for cost-effectiveness. This would enable us to avoid going big on higher-risk grants by learning first with a smaller grant.
We tried something like this:
Confidence level | Funding range |
| <20% | $0–200k |
| 20–40% | $200k–1m |
| 40–60% | $1–2m |
| 60–80% | $2–4m |
| 80%+ | $4m+ |
… which would lead to funding allocation like this:
Org | Impact/$ | Probability of success | Funding range for confidence level | $ allocation prioritising Impact/$ |
| Org A | 1.5 | 42% | $1–2m | $1,000,000 |
| Org B | 3.4 | 38% | $200k–1m | $900,000 |
| Org C | 1.3 | 28% | $200k–1m | $300,000 |
| Org D | 1.0 | 58% | $1–2m | $1,000,000 |
| Org E | 1.5 | 57% | $1–2m | $1,000,000 |
| Org F | 1.3 | 75% | $2–4m | $2,300,000 |
| Org G | 2.5 | 70% | $2–4m | $3,200,000 |
| Org H | 3.4 | 72% | $2–4m | $3,800,000 |
| Org I | 1.8 | 82% | $4m+ | $4,500,000 |
| Org J | 2.8 | 60% | $2–4m | $3,400,000 |
| Org K | 1.7 | 20% | $200k–1m | $300,000 |
We didn’t love it. We were left with the opposite problem from our first approach: we were allocating a lot of money to things we didn't think would deliver lots of impact, just because they were safe.
Originating in finance, Kelly tells you the optimal fraction of your funds to bet on opportunities based on risk and reward. I first encountered it through Michael Lewis's book on Sam Bankman-Fried, who notably rejected Kelly as too conservative.
Kelly’s formula: optimal allocation (%) = success rate (%) - [(failure rate %) / (return per dollar)]. On paper, it looked ideal, directly optimizing risk vs. reward trade-offs. Also it came from finance, and finance is cool.
Here’s what a Kelly-optimized grant portfolio would look like for us:
Org | Impact/$ | Probability of success | $ allocation following Kelly |
| Org A | 1.5 | 42% | $100,000 |
| Org B | 3.4 | 38% | $1,100,000 |
| Org C | 1.3 | 28% | $0 |
| Org D | 1.0 | 58% | $900,000 |
| Org E | 1.5 | 57% | $1,500,000 |
| Org F | 1.3 | 75% | $3,000,000 |
| Org G | 2.5 | 70% | $3,100,000 |
| Org H | 3.4 | 72% | $3,400,000 |
| Org I | 1.8 | 82% | $3,800,000 |
| Org J | 2.8 | 60% | $2,400,000 |
| Org K | 1.7 | 20% | $0 |
But Kelly has a crucial assumption: you’re growing an investment portfolio where losses directly reduce your available capital, your ability to keep playing the game. In grant-making, if a grant fails or succeeds, you lose the grant money either way, as discussed earlier. This causes Kelly to be overly cautious for grantmaking, pushing too much toward low-risk, low-return bets. For example, something like Org F (high success chance (75%) but modest cost-effectiveness) still received outsized allocations ($3m). Kelly optimized for "not going broke," a constraint that people giving money away for free don’t have.
The Sharpe ratio is another concept from the finance world. It allows for a risk-adjusted estimate of the value of an opportunity and is calculated by taking the expected return, minus a risk-free return (like government bonds), all divided by the standard deviation of the portfolio's excess returns (vs risk-free). The idea of meaningfully estimating the standard deviation of excess returns of a bunch of nonprofits with varying data quality seemed pretty unrealistic. We did not pursue the Sharpe ratio further.
Finally, through Nate Silver's book "On the Edge," I encountered "edge," a poker player's heuristic defined as the return to success divided by odds of failure. This is very similar to Kelly, but because it uses odds rather than percentages, it subtly nudges towards higher-risk, higher-reward opportunities.
Here’s how paying grants in proportion to edge looked for us:
Org | Impact/$ | Probability of success | Edge | Grant proportional to edge |
| Org A | 1.5 | 42% | 1.1 | $500,000 |
| Org B | 3.4 | 38% | 2.1 | $1,000,000 |
| Org C | 1.3 | 28% | 0.5 | $0 |
| Org D | 1.0 | 58% | 1.4 | $700,000 |
| Org E | 1.5 | 57% | 2.0 | $900,000 |
| Org F | 1.3 | 75% | 3.9 | $1,900,000 |
| Org G | 2.5 | 70% | 5.8 | $2,800,000 |
| Org H | 3.4 | 72% | 8.6 | $4,100,000 |
| Org I | 1.8 | 82% | 8.0 | $3,800,000 |
| Org J | 2.8 | 60% | 4.2 | $2,000,000 |
| Org K | 1.7 | 20% | 0.4 | $250,000 |
The initial consensus of colleagues? This feels right! By funding in proportion to edge, we had a straightforward way of being cautious with high-risk investments but ambitious with promising investments. Importantly, none of the recommended grants felt very off, though some recommendations came off as useful challenges (“Huh, the edge is high and I guess we could go bigger with those guys”).
Here’s how all of the strategies look together:
Org | Impact/$ | Probability of success | $ allocation: proportional to expected CE | $ allocation: Risk Buckets | $ allocation following Kelly | 1st grant proportional to edge |
| Org A | 1.5 | 42% | $1,200,000 | $1,000,000 | $100,000 | $500,000 |
| Org B | 3.4 | 38% | $2,500,000 | $900,000 | $1,100,000 | $1,000,000 |
| Org C | 1.3 | 28% | $700,000 | $300,000 | $0 | $0 |
| Org D | 1.0 | 58% | $1,100,000 | $1,000,000 | $900,000 | $700,000 |
| Org E | 1.5 | 57% | $1,600,000 | $1,000,000 | $1,500,000 | $900,000 |
| Org F | 1.3 | 75% | $1,900,000 | $2,300,000 | $3,000,000 | $1,900,000 |
| Org G | 2.5 | 70% | $3,400,000 | $3,200,000 | $3,100,000 | $2,800,000 |
| Org H | 3.4 | 72% | $4,700,000 | $3,800,000 | $3,400,000 | $4,100,000 |
| Org I | 1.8 | 82% | $2,800,000 | $4,500,000 | $3,800,000 | $3,800,000 |
| Org J | 2.8 | 60% | $3,200,000 | $3,400,000 | $2,400,000 | $2,000,000 |
| Org K | 1.7 | 20% | $700,000 | $300,000 | $0 | $250,000 |
We really liked the use of edge to generate an initial grant recommendation, subject to occasional adjustment based on “gut”, but adjustment wasn’t common.
Surprisingly, the biggest benefit was psychological. The concept of edge generated a useful tool for our program officers as they engaged (potential) grantees, focusing conversations around estimating and increasing our "edge". Seeking opportunities to boost and balance cost-effectiveness and probability of success.
I left the org (Prevail Fund) a few years ago and from catching up with colleagues, the concept of edge ended up most useful for our early years of grants and less relevant to our longer term state, which was more of a "repeatable game" with clearer data on each grantee.
A quick, skippable, willdy-under-explained detour into some of the math, for the curious.
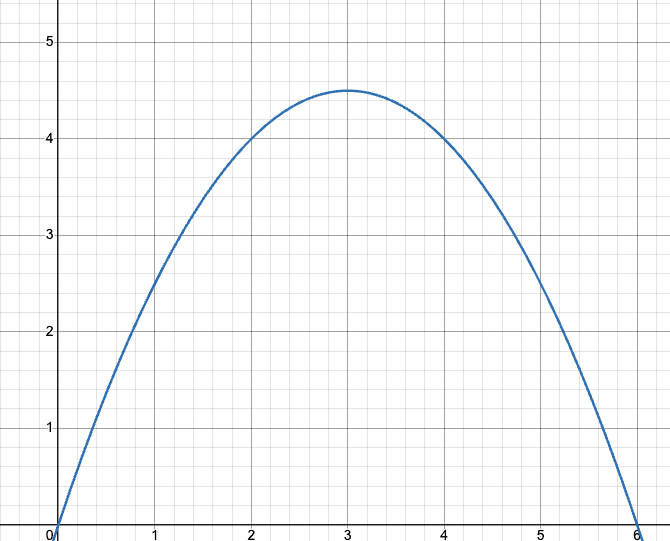
You could reasonably point out that the approach we took of trying out different methods until we found one that “felt” right was really just a trial-and-error way of identifying our underlying utility function, which is fundamentally still a mathematical object. And you’d be right! In fact, you can write out the “edge” formula and integrate it to identify the implied utility function that it maximes. I gave this a go and graphed it, it looks like this:
The y-axis here is utility, the x-axis is the grant allocated, shown for a fixed org risk. The units on each axis are arbitrary, I just threw in numbers to generate the shape of the graph. One way to interpret the graph is "how excited am I by this opportunity as I spend more money on it?": you'll see that the more we spend on a grantee at first, the better, but the gains diminish with further funding and eventually peak, where it gets worse to spend more. I 100% acknowledge I'm not properly justifying this section but decide to just "ship the damn post".
The utility function behaves exactly as we wanted it to, somewhat linear at low allocations (i.e. spending $200k on an org is about twice as promising as spending $100k), getting more log-ish (risk averse) as more funding goes to the opportunity, peaking at a point (in fact, the point where the grant allocated is in proportion to the org's edge), and rapidly falling off after that point (since we can just wait a year before giving much more).
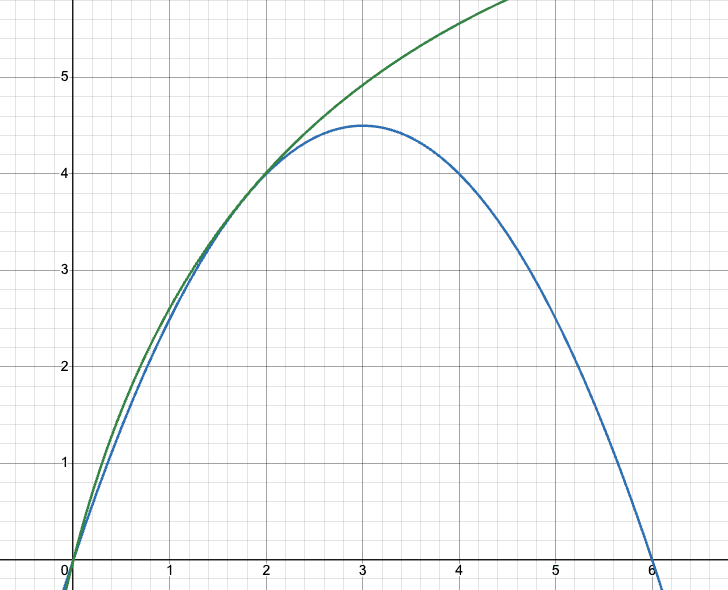
Remember my “in principle, optimal” allocation formula of Ax + B ln(X + C) -D f- Df^2? It is actually possible to fit a combination of those functions to this graph, playing with different values of B, C and D, producing a good fit up until just about where the “edge” point is reached:
The green line above shows a version of the Ax + B ln(X + C) -D f- Df^2 formula fit to overlap with the edge graph: they more or less do overlap, up until the point where the org's funding is proportional to its edge
So our final selection of “edge”, chosen based on what “felt” right based on various constraints, did indeed look close to the theoretical optimal, but the simpler formula of edge didn't require our programs team to do a load of calculus on every field visit.
The Goldeneye story is cute but it wouldn't be fair to say the moral of the grantmaking story is “don’t use math”. We did use math, lots! But we found our way to our final fund allocation approach by setting initial principles and then trial and error. Much smarter people than me have noted that we should be wary of trusting individual numbers when we are dealing with high uncertainty.
Although I can’t claim that it was all a masterplan, I feel quite good about the approach we ended up taking:
We got half of the way through math, half of the way through our guts, and I’m pretty happy where we ended up.
But if we missed something… I’d love to hear suggestions and takes (on philanthropy or Goldeneye, I'm still figuring out both).
I’m not detailing specifics of what the grants were for or what the impact metric actually was, partly because it doesn’t really matter to the conclusions and also they might not want people trying to game their system. That said, “the secret is to be really cost-effective and reliable” is definitely a wholesome way to game a system…

Thanks for writing this up! It's rare to get an inside look at how funders handle the practical challenges of allocation, and I think you had a lot of interesting ideas.
However, the various approaches you discussed seem odd to me in that they all involve taking the cost-effectiveness of the intervention and probability of its successful implementation and converting them into some kind of score, then allocating funding proportionately to that score. That approach seems like it misses something fundamental, which is that an EV-maximizing grant portfolio should be one that equalizes the marginal cost-effectiveness (including value of information) of the last dollar given to each recipient (note that there's some further complexity if you have flexibility in how much funding to give this year vs. hold onto for future years, since one should also want to equalize the marginal cost-effectiveness of grant dollars over time). Starting from that goal, it seems clear that it would be worth scoring organizations on how quickly cost-effectiveness would be likely to fall off, based on total addressable problem size, management capacity etc. That's not to say that one can in practice compute exact marginal cost-effectiveness curves and perfectly solve this optimization problem, but I do think it's worth bringing that marginal mindset to evaluating each grant.
I'd expect the portfolio that resulted from thinking hard about equalizing marginal cost-effectiveness to look something like:
This looks a decent amount like edge, but it's skewed somewhat away from the middle tier. For example, I'm skeptical that edge's $1.9m grant to F makes a lot of sense, given that F's EV is much lower than the top tier of organizations and the information value if it works is still low. I'd expect the recommendations to differ more from edge in cases where organizations had very different capacities to absorb funds, which this example doesn't really capture.
This is really great engagement, thank you!
I agree that the ideal would like like cost-effectiveness of each marginal dollar. We sort of tried to account for that through the "probability of success" metric, which was defined as something like "probability that this grant exceeds our funding bar", and considerations like "this funding would really stretch the grantee and could be spend less well than their previous funds" could get included in that, but not in a formal way.
I like the bulleted principles you outlined, that's cool that it syncs up somewhat with the Edge results.
For the Org F funding, I also had that reaction when I re-checked. I think part of it might be that our funding bar was 1 impact unit/$, so even org F was actualy pretty good (and lots of other orgs fell below the bar). I don't know if that changes things for you though, just what jumped out when I read the table again.