Comments
This is quite impressive and also useful. Thanks for doing this.
This is quite impressive and also useful. Thanks for doing this.

TL;DR: airegulationmap.org is an interactive map of AI governance across 196 countries, scored on five dimensions plus a composite index, refreshed monthly by an automated research pipeline. The application is fully open source, and all the data is open and version-controlled.
Hi!! I'm Ria, a software engineer based in Chile. This started as my final project for ML4Good Brazil 2024, then sat untouched until I picked it back up this year. I’d love to get feedback on the website, see if it’s useful, and what can be improved. I come from the software world and don’t have experience in policy, so the scoring methodology is where I'd most value feedback.
If you want to know how a country approaches AI regulation, you have to scour hundreds of sources, many in different languages, while also trying to understand the technicalities of each region. There isn't an easy way to see the status of each country, to compare them, or to see how they've changed over time. I tried to fill that gap by gathering these sources once a month and presenting them in a clear, intuitive way.
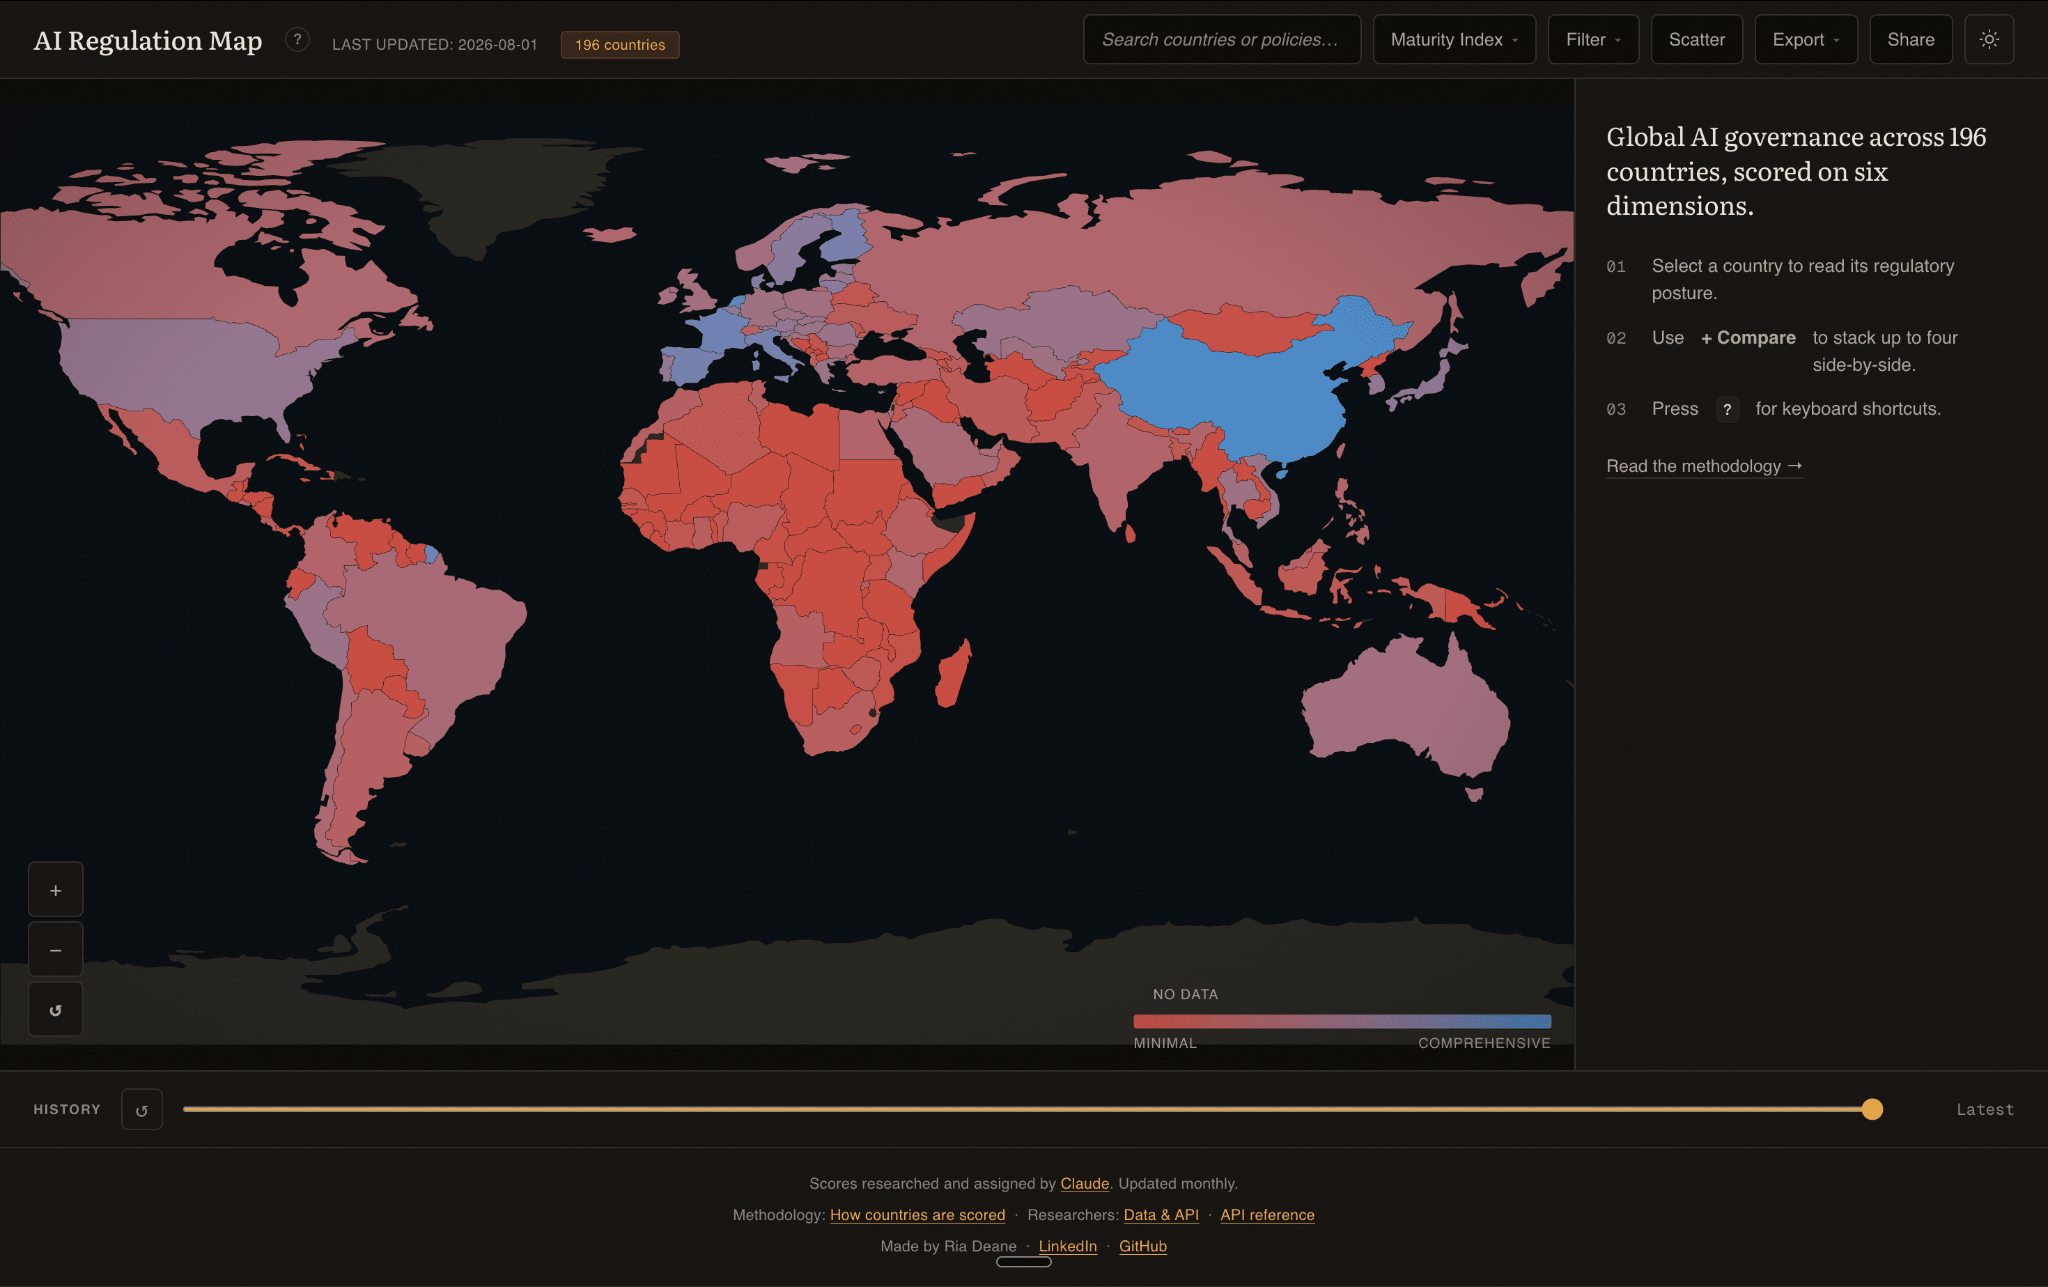
Every country is scored 1 to 5 on five dimensions. A 5 means the global frontier at the time of scoring, it’s set by the two or three most advanced jurisdictions. So if a country's score drops from one month to the next without any law changing, it's most likely because the frontier advanced.
The first three average into a maturity index. The last two are left out because they're descriptive: they capture how a country governs, not how well. They still sit on a 1-5 scale because it's easier to visualize them that way, but I plan to reshape them into a new "Democratic Accountability" dimension and fold that into the maturity index.
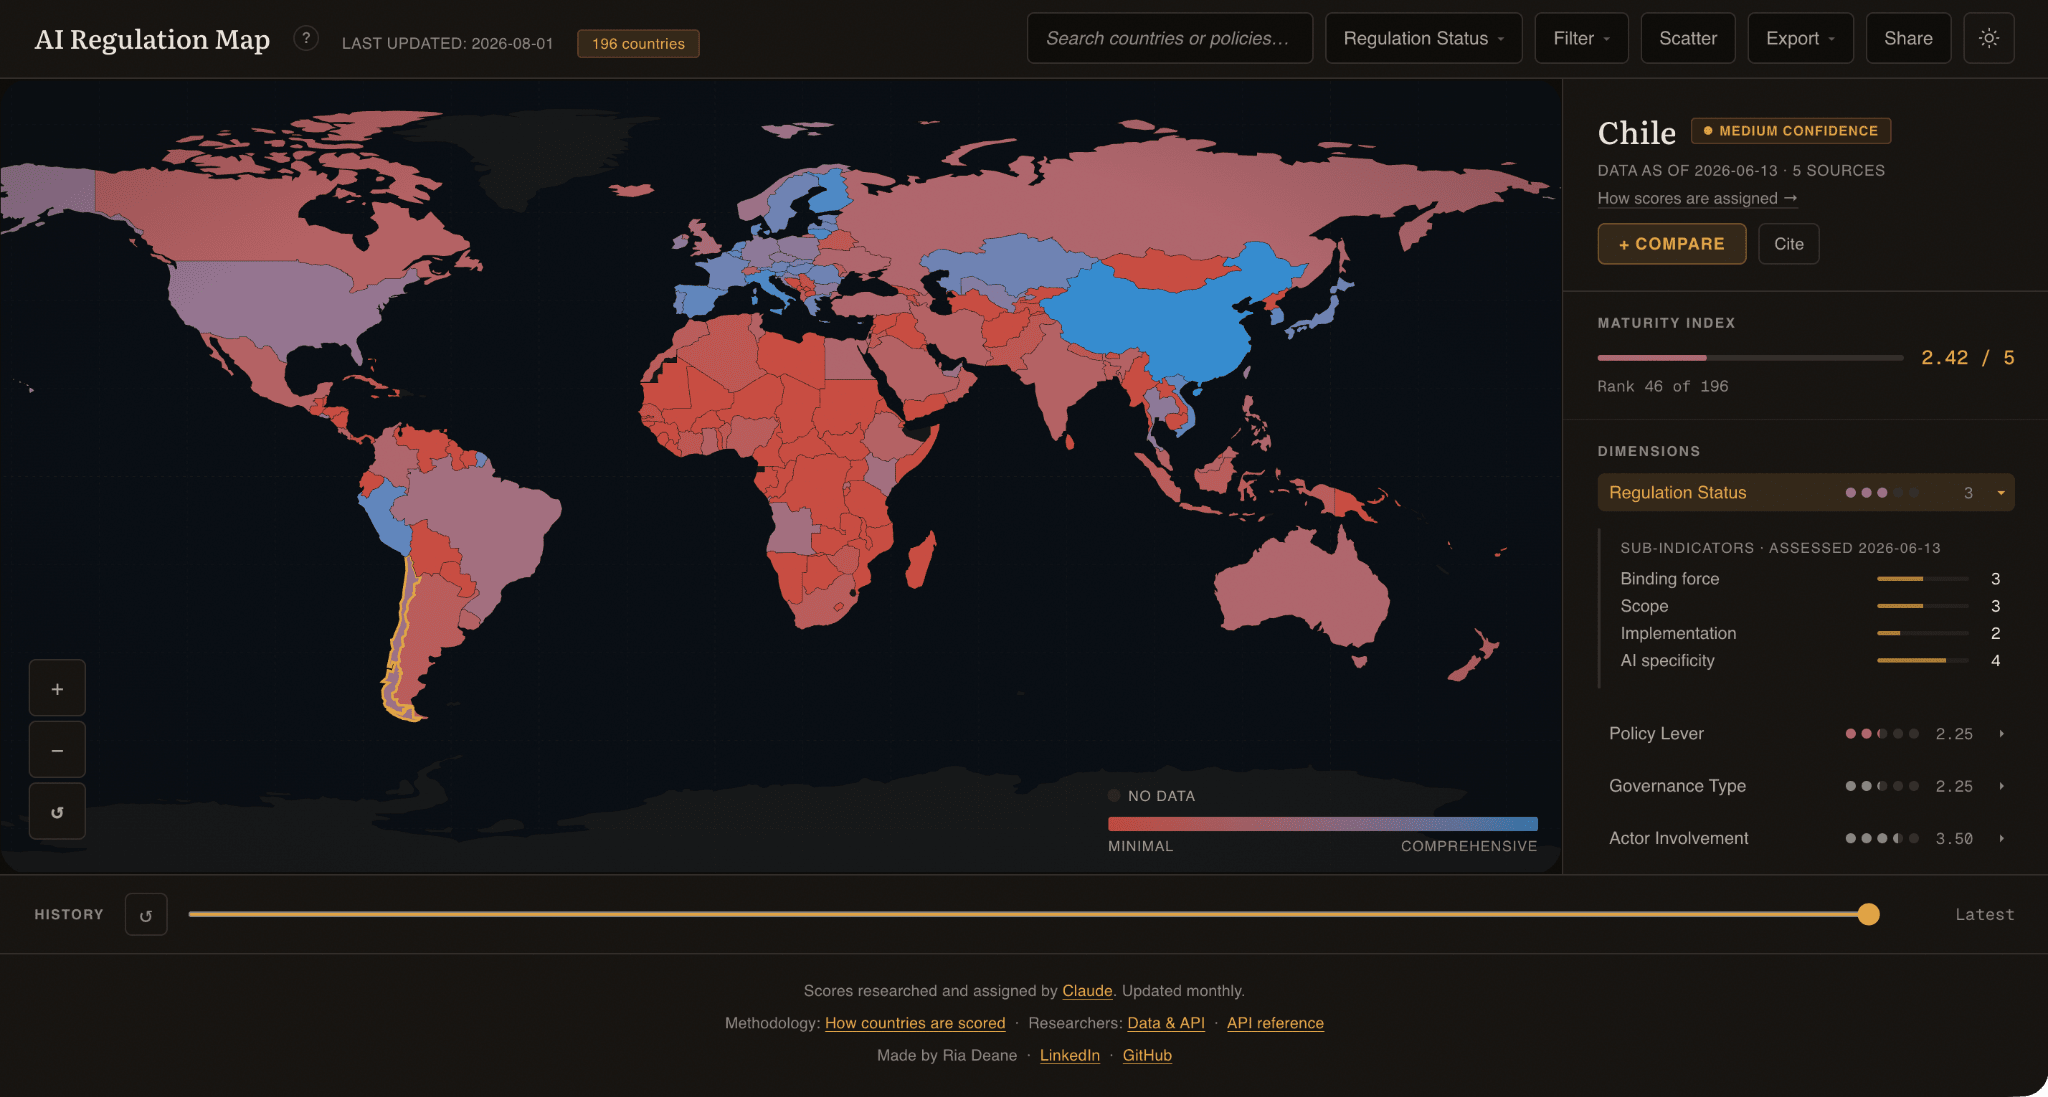
By clicking on a country you can see the scores, the reasoning behind them, key legislation, sources, and policy records.
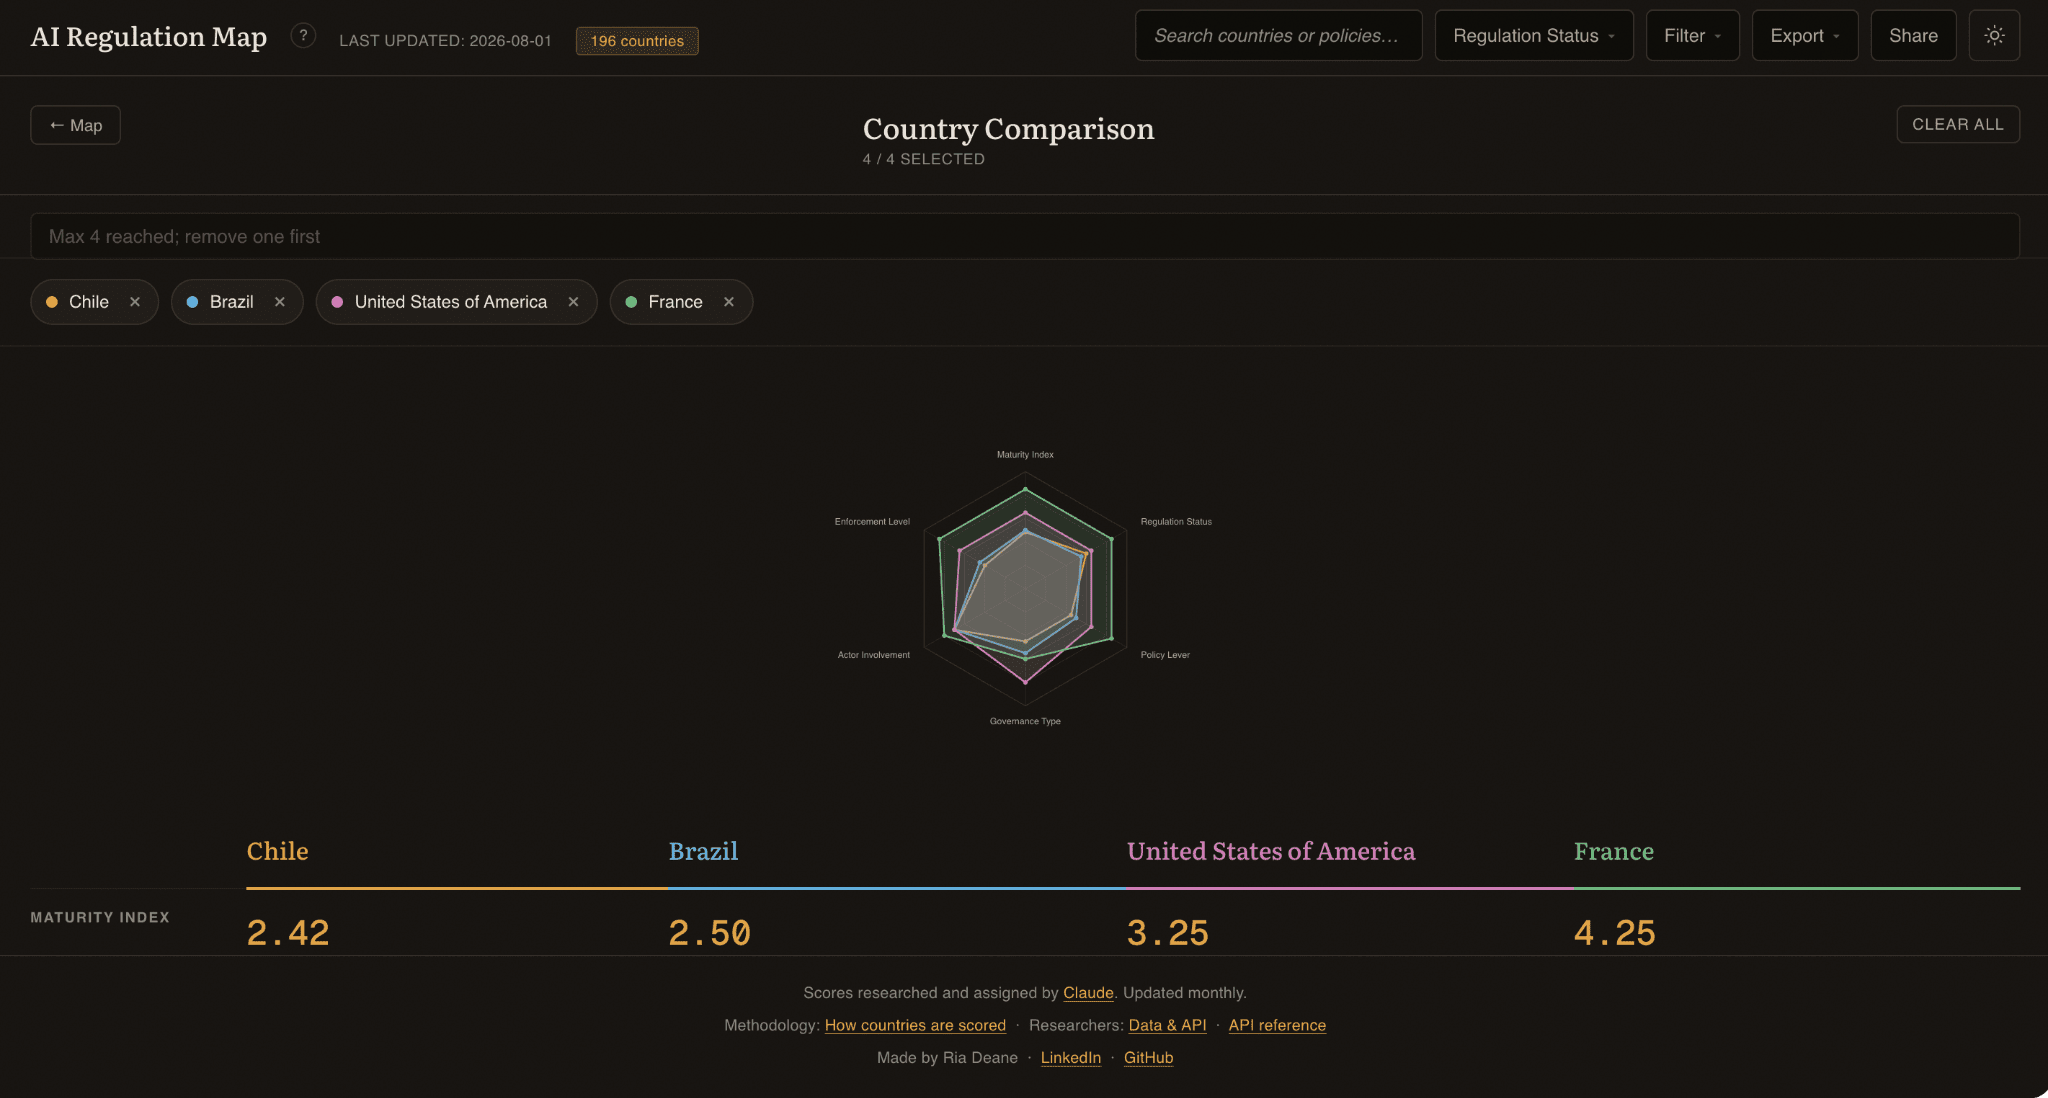
You can also compare up to four countries side by side!
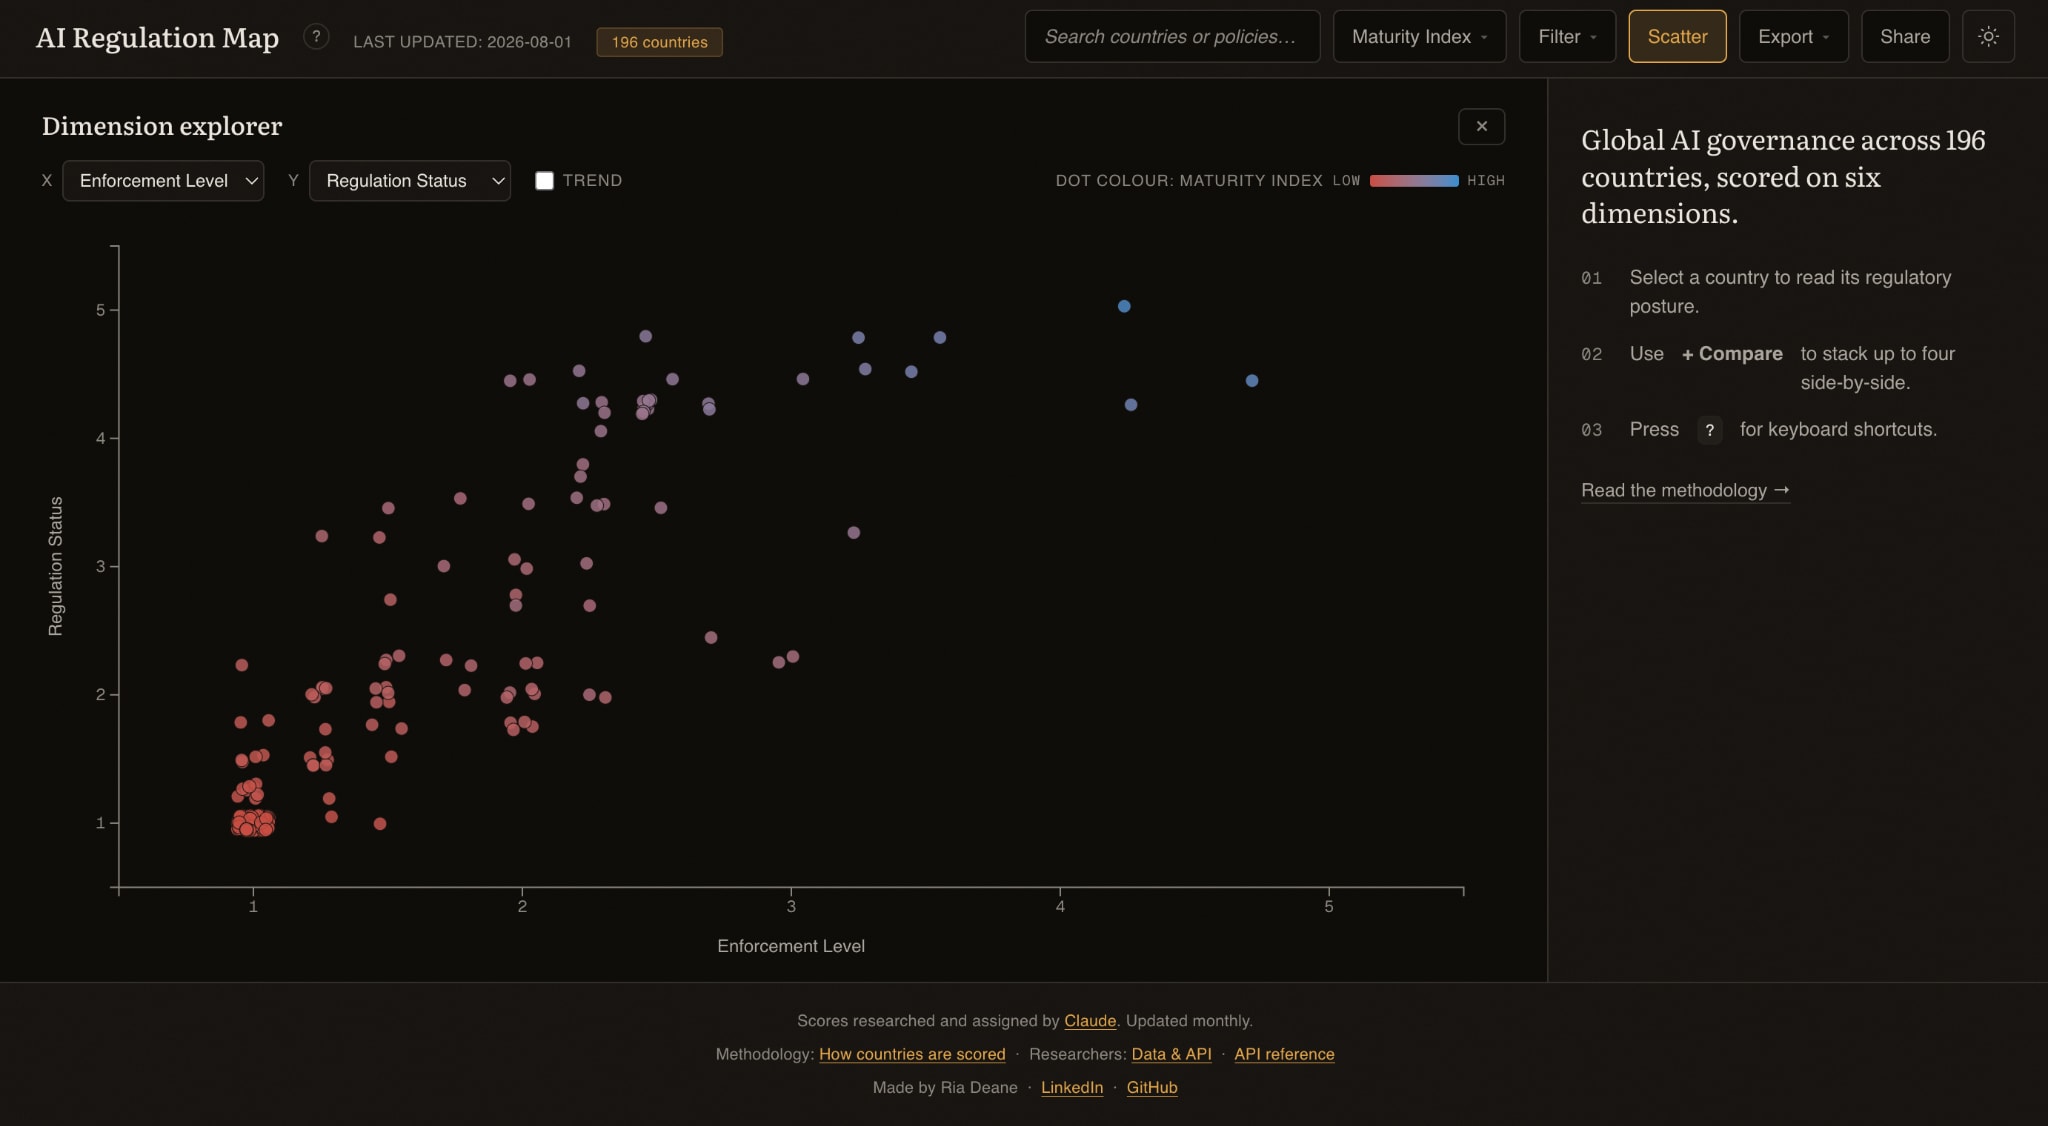
I also created a scatter view. For example, you can plot enforcement level against regulation status, so countries with laws on paper but little enforcement capacity stand out
The original idea came when I read this post: AI Governance Tracker. All the data has been re-researched from scratch since, but when I saw it I immediately thought that being able to visualize the information on a map would be incredibly useful.
Each dimension score is the mean of four sub-indicators, each rated 1 to 5 against a written definition. Every country also carries a confidence label: low confidence means there wasn't much public information to go on. You can filter the map to high-confidence or official-sources-only views.
The research itself is done by Claude. A GitHub Action runs on the 1st of each month (I do want to do this more frequently!) and re-researches any country whose record is stale or low-confidence.[1] If the OECD.AI Policy Observatory[2] has data for a given country, the model scores against those records instead of relying on search and recall, which I hope reduces hallucination. Staleness detection is an aspect I want to improve, since right now it's based on how long ago I scanned the data, but countries like the US and China can change a lot in one month.
Scoring this way is what makes a monthly refresh of 196 countries feasible for a one-person team. It is also unaudited, and the model can misread or miss things entirely, especially in multilingual contexts.
The research prompt is public in prompt.py, and I’ve documented the software architecture in two files: backend and frontend.
All the data is in plain CSV and JSON files you can download or load directly:
import pandas as pd
scores = pd.read_csv("https://airegulationmap.org/scores.csv")Let me know what you think!!
These tools can drive conscious decisions, kudos! There is still a challenge up front and it is leveraging this valuable info into the rooms where they can be more useful. Before anyone wants to reinvent the wheel (or more sensibly, not using one at all), they should be consulting this map, so lets all contribute to this happening!