Comments
Previously: GiveWell raised less than its 10th percentile forecast in 2023 · GiveWell fundraising up 17% in 2024
GiveWell has published its 2025 metrics, together with a metrics report and a public spreadsheet. As in previous years, I focus on how much was raised and who gave it. This year I also look at how concentrated GiveWell's donor base is.
Truth be told I kinda phoned it in on this one, the full Claude version with better charts is here
Summary
- Returning donors gave $443.6M (up 77%). New donors gave $37.1M (up 112%), which is still below their 2020–2022 levels.
- 39 donors giving $1M or more contributed $359.7M. That is 75% of identified donations through GiveWell and 90% of the year's increase. Every smaller size band also grew, by 13–27%.
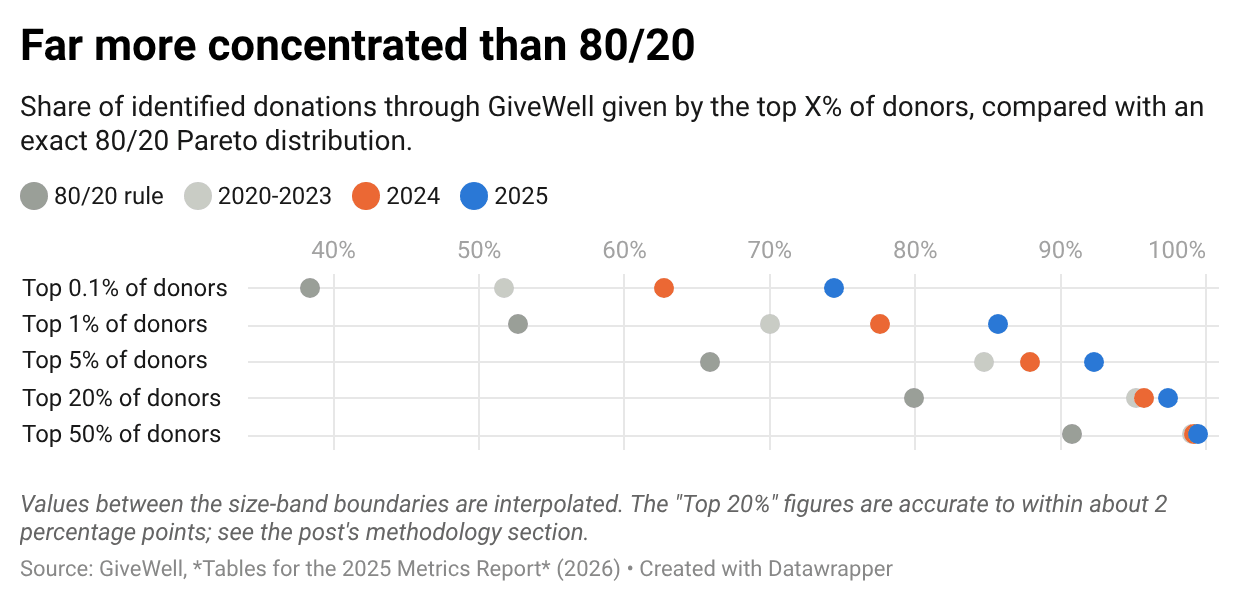
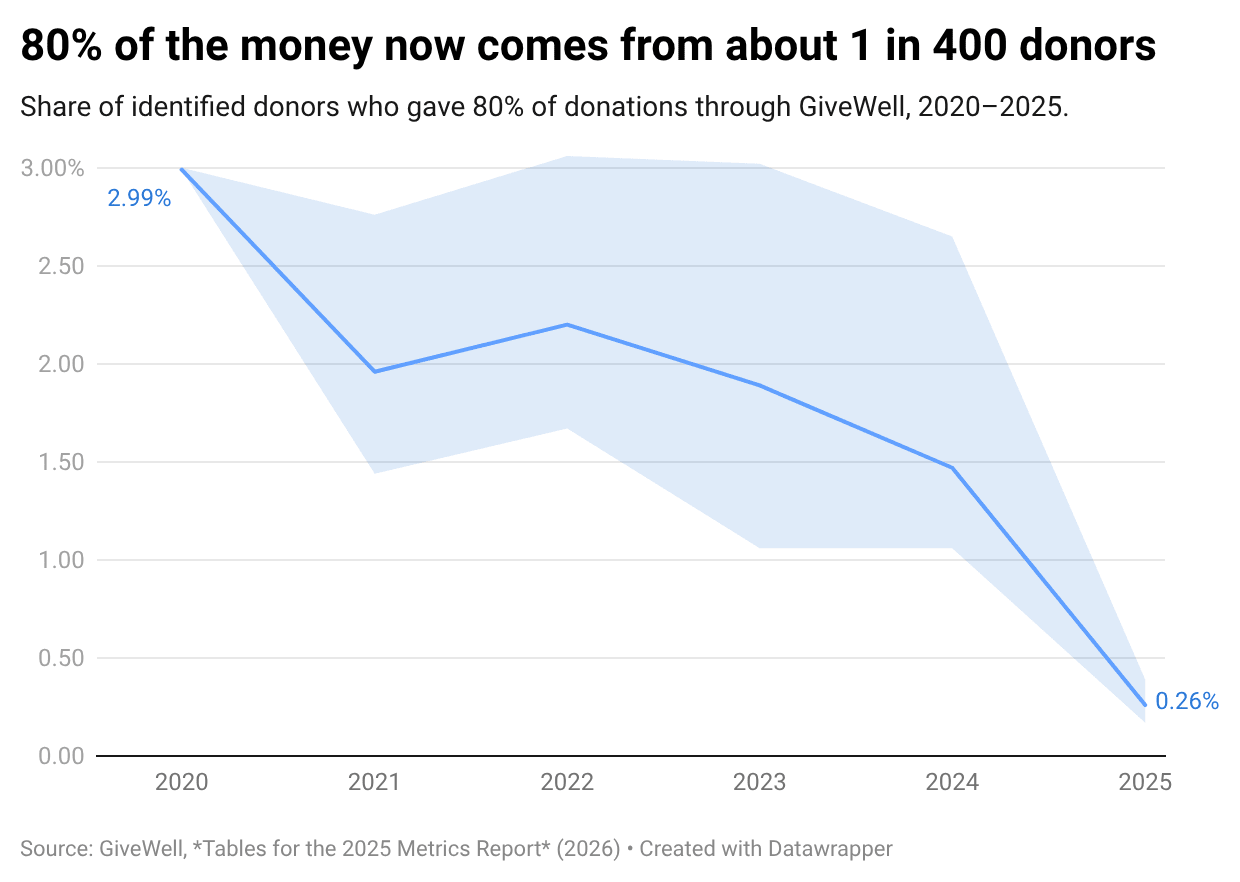
- The donor base is far more concentrated than an 80/20 rule. The top 20% of donors gave about 97% of the money, and about 0.26% of donors (roughly 90) gave 80%. Asking the question again within the top group (the top 20% of the top 20%, and so on) gives 94%, 93% and 92%, rather than 80% each time.
Returning donors drove the increase
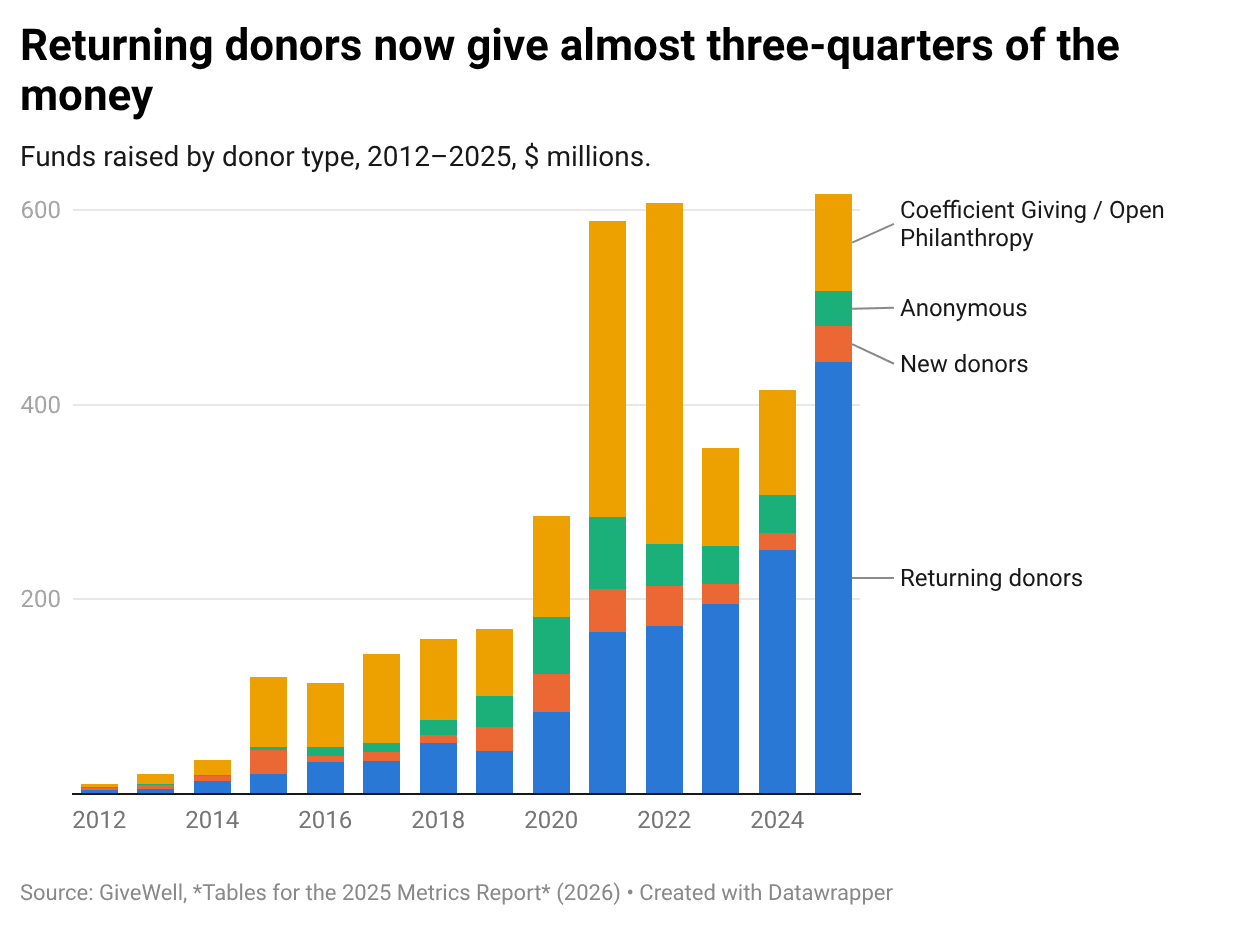
Returning donors gave $443.6M, up 77% on 2024. That is 72% of all funds raised and 86% of the money from donors other than Coefficient Giving, both the highest shares in the series. The average returning donor gave about $20,800, against $12,300 in 2024.
New donors gave $37.1M, up 112%. This reverses three years of decline ($41.2M in 2022, $20.5M in 2023, $17.5M in 2024), but it remains below 2020–2022 levels. Anonymous giving fell 7% to $35.6M.
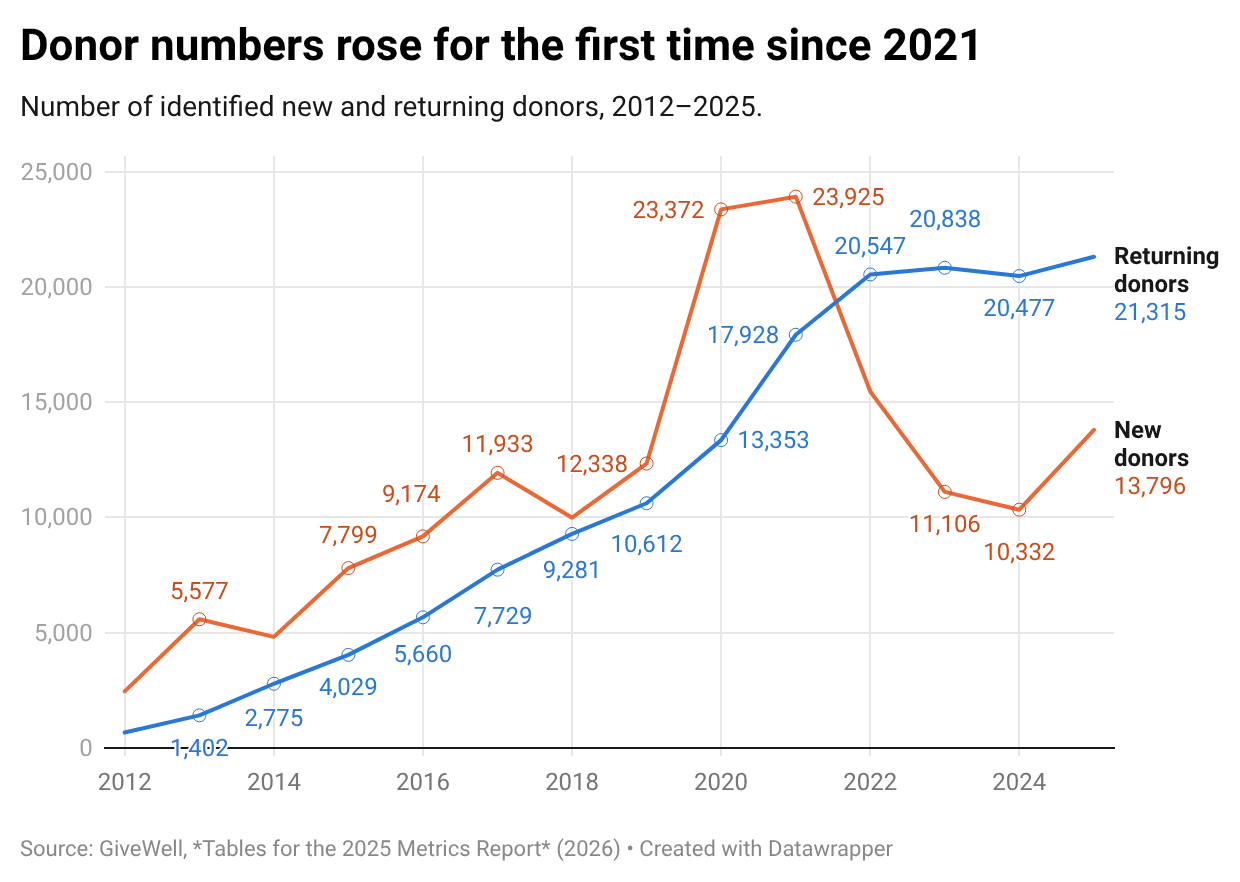
The number of donors rose for the first time since 2021. There were 13,796 new donors (up 34%) and 21,315 returning donors, a record. Together that makes 35,111 identified donors, up 14%, but still below the 2021 peak of about 41,900.
The increase was driven overwhelmingly by $1M+ donations
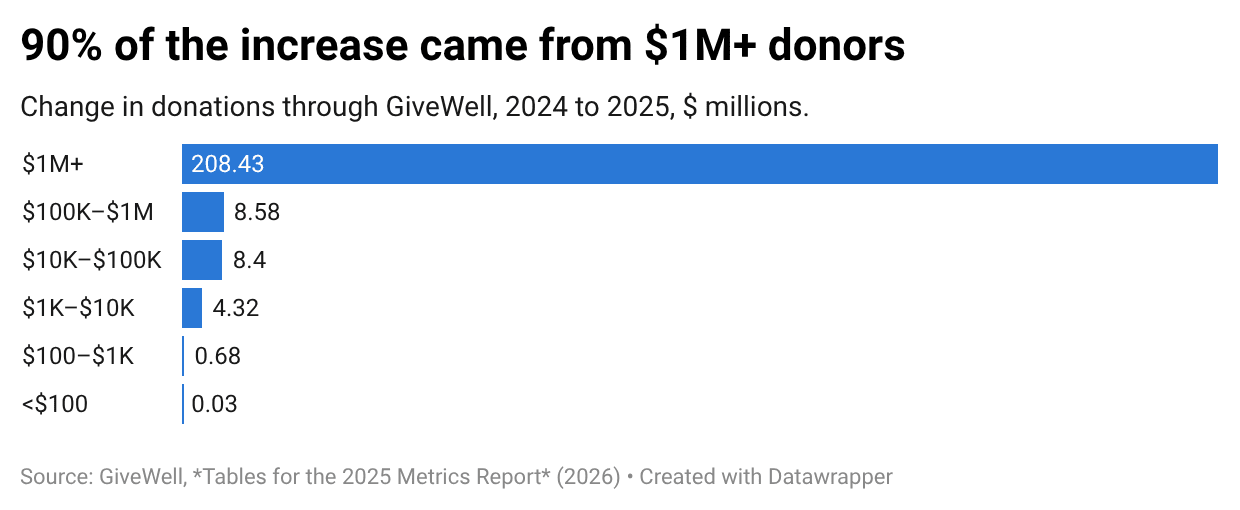
GiveWell reports donations that pass through its own accounts by donor size, with each donor placed in a band by their total gifts in the year. On this measure, identified donations rose by $230.4M, from $246.7M to $477.1M.
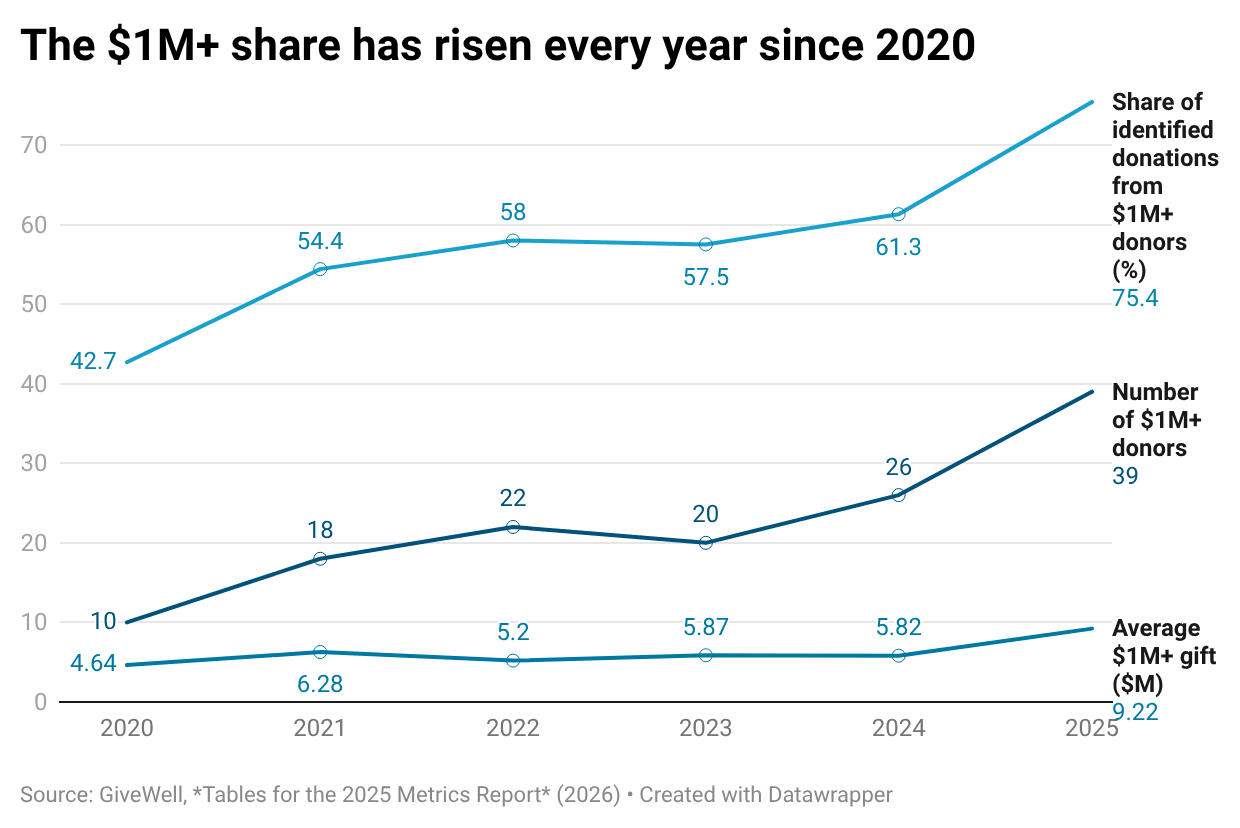
- $1M+ donors: 39 (up from 26) gave $359.7M, up 138%. That accounts for $208.4M, or 90%, of the increase. The average gift in this band rose from $5.8M to $9.2M, so the growth came both from more very large donors and from larger gifts.
- Every smaller band also grew: $100K–$1M by 27%, $10K–$100K by 23%, $1K–$10K by 19%, $100–$1K by 14% and under $100 by 13%. Giving below $1M rose 23% in total, against 10% in 2024, so growth was broader than last year even though the top band dominated it.
- The $1M+ share of identified donations through GiveWell rose from 43% in 2020 to 61% in 2024 and 75% in 2025.
| Donor size | 2024 | 2025 | Change | Growth | Donors 2024 | Donors 2025 | Average gift 2025 |
|---|---|---|---|---|---|---|---|
| $1M+ | $151.3M | $359.7M | +$208.4M | +138% | 26 | 39 | $9.22M |
| $100K–$1M | $31.3M | $39.8M | +$8.6M | +27% | 152 | 176 | $226,000 |
| $10K–$100K | $36.7M | $45.1M | +$8.4M | +23% | 1,581 | 1,927 | $23,400 |
| $1K–$10K | $22.2M | $26.5M | +$4.3M | +19% | 8,219 | 9,703 | $2,730 |
| $100–$1K | $5.0M | $5.7M | +$0.7M | +14% | 14,141 | 16,187 | $352 |
| Under $100 | $0.23M | $0.26M | +$0.03M | +13% | 6,658 | 7,066 | $37 |
| All identified donors | $246.7M | $477.1M | +$230.4M | +93% | 30,777 | 35,098 | $13,600 |
Is GiveWell's funding 80/20? No: it is far more concentrated
An 80/20 rule means the top 20% of donors give 80% of the money. If donations followed a Pareto distribution with that property, the pattern would repeat at every scale. The top 20% of the top 20% (4% of donors) would give 80% of that group's money, which is 64% of the total. The next level down (0.8% of donors) would give 51% of the total, and so on.
The size bands give exact figures only at their boundaries ($100, $1K, $10K, $100K and $1M). I interpolated between them (see the methodology section) and report ranges where the data leave room for doubt. For 2025:
- The top 20% of donors (about 7,000) gave about 97% of the money (range 96.0–97.7%).
- About 0.26% of donors, roughly 90 people or entities, gave 80% of the money (range 61–136 donors). In 2020–2024 the equivalent figure was 1.5–3.0% of donors.
- The 39 donors giving $1M+, 0.11% of donors, gave 75%. This figure is exact.
Pareto within Pareto
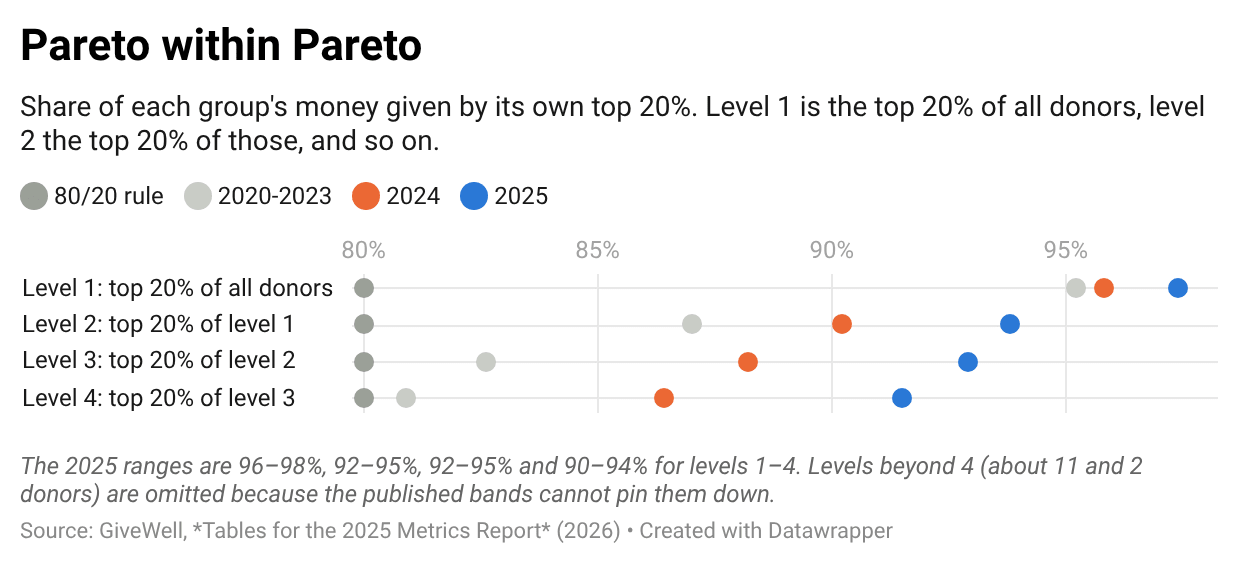
Next, I asked the question again within each successive top group. At each level, what share of the group's money did the top 20% of that group give?
| Level | Group | Donors (2025) | Share of the group's money from its top 20% (2025) | Range | 2024 | 2020 | 80/20 rule |
|---|---|---|---|---|---|---|---|
| 1 | Top 20% of all donors | ≈7,020 | 97.4% | 96–98% | 95.8% | 95.2% | 80% |
| 2 | Top 4% | ≈1,404 | 93.8% | 92–95% | 90.2% | 87.0% | 80% |
| 3 | Top 0.8% | ≈281 | 92.9% | 92–95% | 88.2% | 82.6% | 80% |
| 4 | Top 0.16% | ≈56 | 91.5% | 90–94% | 86.4% | 80.9% | 80% |
At every level the data can resolve, 2025 is well above 80%, and even the conservative end of each range is about 90%. Concentration has also risen over time. In 2020 the fourth level was almost exactly 80/20 (80.9%); in 2025 it was 91.5%. Beyond level 4 (about 11 donors, then about 2) the published bands cannot distinguish between very different distributions, so I do not report those levels.
Among the very largest donors, the distribution is close to a textbook 80/20. If the $1M+ band follows a Pareto tail, its average gift of $9.2M implies a tail index of α ≈ 1.12. An exact 80/20 rule corresponds to α ≈ 1.16. The largest donors are therefore slightly more concentrated than 80/20 among themselves. In earlier years α was about 1.19–1.28, slightly less concentrated than 80/20. The overall figure is so extreme because more than 30,000 donors give under $10K each, and together they account for under 7% of the money.
The figures above exclude Coefficient Giving. If its $100M is counted as a single additional donor, 80% of the combined money came from about 0.12% of donors (about 42). The nested shares rise to 98%, 95%, 94% and 93%.
Methodology and caveats
- Data. The concentration analysis uses the spreadsheet's "Donations through GiveWell by Donor Size" tables, which give amounts and donor counts for identified donors. In 2025 these cover 35,098 donors and $477.1M. They exclude anonymous gifts ($18.9M through GiveWell), direct-to-charity gifts (for which no donor counts are published) and Coefficient Giving's $100M, which went directly to charities.
- Interpolation. Within each band I assumed a truncated power-law distribution matched to the band's average gift. For the $1M+ band I assumed a Pareto tail with α = mean ÷ (mean − $1M). The ranges are the lowest and highest values consistent with the band counts and totals alone, with no distributional assumption.
- What counts as a donor. The report does not say how foundations, donor-advised funds or effective-giving organisations are counted. If some $1M+ "donors" are intermediaries passing on many individuals' gifts, concentration among individuals is overstated. I would welcome clarification from GiveWell.
- 2024 comparability. In the spreadsheet, 2024 donations through GiveWell ($255.8M) are about $8.2M more than non-Open Philanthropy giving minus direct-to-charity gifts. The 2024 size bands therefore appear to include about $8.2M of Open Philanthropy money, most likely in the $1M+ band. The 2025 bands include $39,625 from Coefficient Giving.
- Metrics year. GiveWell's metrics year runs from 1 February to 31 January, so "2025" means 1 February 2025 to 31 January 2026.
Sources
- GiveWell, GiveWell's 2025 Metrics and Impact (31 August 2026)
- GiveWell, Metrics Report 2025 and Tables for the 2025 Metrics Report
- GiveWell, Metrics Report 2024
- GiveWell, How much funding does GiveWell expect to raise through 2025? (10 April 2023)
- GiveWell, Coefficient Giving Commits $175 Million to GiveWell Opportunities (18 December 2025)
- GiveWell, Scaling Our Impact, with Support from a $1 Billion Commitment (23 July 2026)
66