I wonder if the power required by brains is proportional to the number of neurons across very different species. It seems to be so among mammals. From Herculano-Houzel (2011):
Based on glucose and oxygen metabolic rates in awake animals and their recently determined numbers of neurons, here I show that, contrary to the expected, the estimated glucose use per neuron is remarkably constant, varying only by 40% across the six species of rodents and primates (including humans).
I actually don't have anything substantive to say. But since I often read your posts and not comment or say thank you (but I usually upvoted), so for once I would like to say thank you for your interesting, stimulating, and often important work!
Thank you so much for the acknowledgement, Vasco! As you know, I'm a huge fan of your work, so it's great to know our chats have been productive for you. 🤗
I think that the method of calculation of the set of animals that are most important for any point within an unknown measurement of welfare is a good method to have.
I also think you've done really well in pointing out that the welfare ranges would seem to imply a capacity to experience suffering that drops off far less than the neuron count does, and that does have issues.
I suspect that there exists a belief that below a certain threshold there is no consciousness or capacity for welfare - a discontinuity - and thus animals such as nematodes are out of scope. I, at least, have no trouble saying that 1 neuron would not have capacity for welfare - that welfare capacity arises through the linkages, and not through things internal to the cell. And 302 really is quite small. I feel if you could get welfare capacity off linkages in a system of that size, we'd have found digital consciousness by now.
I suspect that there exists a belief that below a certain threshold there is no consciousness or capacity for welfare - a discontinuity - and thus animals such as nematodes are out of scope.
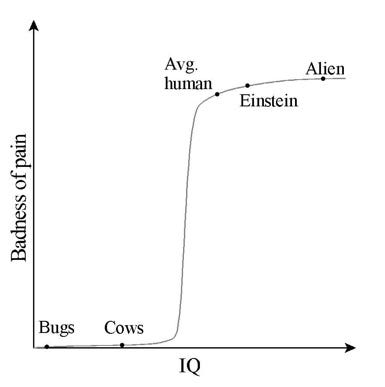
Note many people rule out animals way more cognitively sophisticated than nematodes postulating such a discontinuity. Bryan Caplan said the graph below "nicely summarizes my [Bryan's] broader view".
I would not be surprised if the absolute value of the welfare per animal-year decreased much faster than exponentially with the number of neurons for a sufficiently low number of neurons. However, I assume an exponential decrease up to the number of neurons of nematodes given the large uncertainty about whether there is such a transition, and the number of neurons for which it would happen. I believe there should be some models according to which the welfare per animal-year does not abruptly go to 0, and the expected welfare per animal-year will be determine by such models.
Given the determinate development of their nervous systems, 30-some years ago it was taken as given that C. elegans are too simple to learn. However, once researchers turned to examine learning and memory in these tiny animals, they found an incredible amount of flexible behavior and sensitivity to experience. C. elegans have short-term and long-term memory, they can learn through habituation (Rankin et al., 1990), association (Wen et al., 1997), and imprinting (Remy & Hobert, 2005). They pass associative learning tasks using a variety of sensory modalities, including taste, smell, sensitivity to temperature, and sensitivity to oxygen (Ardiel & Rankin, 2010). They also integrate information from different sensory modalities, and respond differently to different levels of intoxicating substances, “support[ing] the view that worms can associate a physiological state with a specific experience” (Rankin, 2004, p. R618). There is also behavioral evidence that C. elegans engage in motivational trade-offs. These worms will flexibly choose to head through a noxious environment to gain access to a nutritious substance when hungry enough (Ghosh et al., 2016)—though Birch and colleagues are not convinced this behavior satisfies the marker of motivational trade-offs because it appears that one reflex is merely inhibiting another (Birch et al., 2021, p. 31).
C. elegans are a model organism for the study of nociceptors, and much of what we now know about the mechanisms of nociception comes from studies on this species (Smith & Lewin, 2009). Behavioral responses to noxious stimuli are modulated by opiates, as demonstrated by a study finding that administration of morphine has a dose-dependent effect on the latency of response to heat (Pryor et al., 2007). And, perhaps surprisingly, when the nerve ring that comprises the C. elegans brain was recently mapped, researchers found that different regions of the brain support different circuits that route sensory information to another location where they are integrated, leading to action (Brittin et al., 2021).
Even if we grant the author's low confidence in nematodes' having marker five (motivational trade-offs), current science provides ample confidence that nematodes have markers one (nociceptors), two (integrated brain regions), four (responsiveness to analgesics), and seven (sophisticated associative learning). Given high confidence that nematodes have even three of these markers, the report's methodology [Birch et al. (2021)] would have us conclude that there is “substantial evidence” of sentience in nematodes.
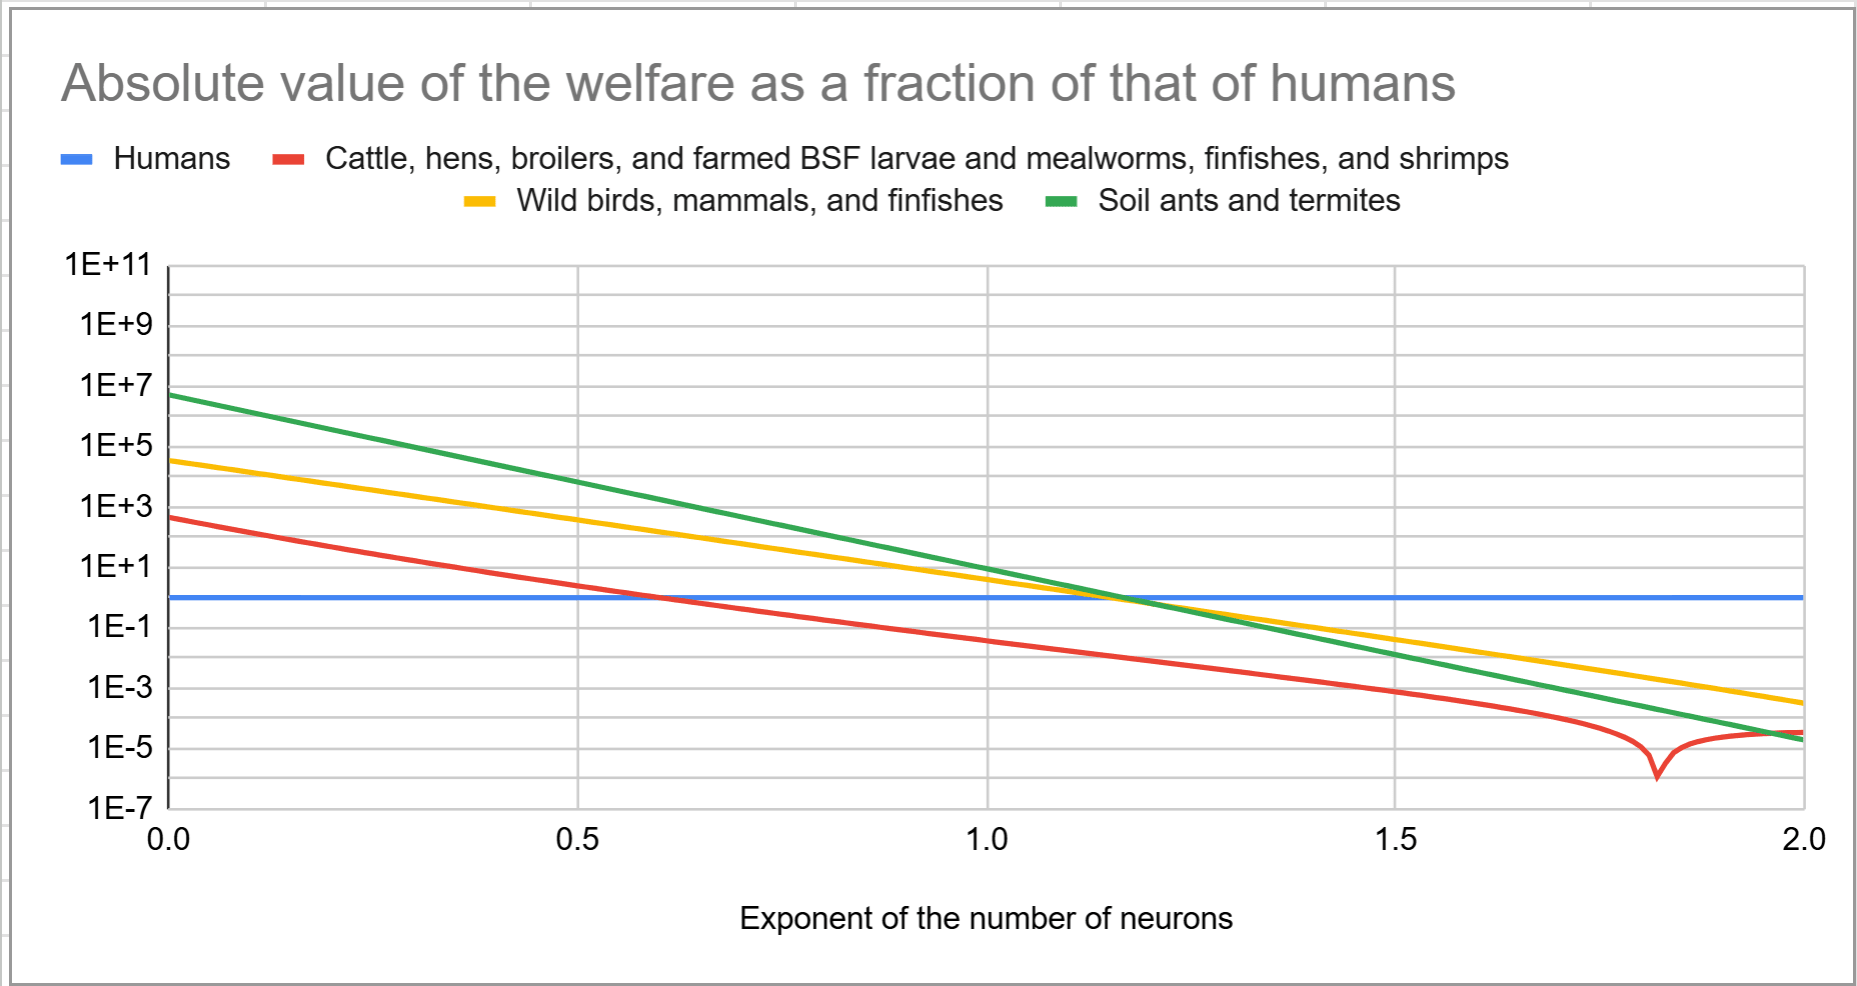
Furthermore, the welfare of soil animals would still dominate even if all animals with fewer neurons than shrimps, which are the ones with the least neurons covered in Bob's book, had a welfare per animal-year of exactly 0. This would imply a total welfare of exactly 0 for farmed BSF larvae and mealworms, and soil springtails, mites, and nematodes. Yet, soil ants and termites would still be considered. I calculate they have 2.91 and 1.16 times as many neurons as shrimps. Below is a graph comparing the welfare of soil ants and termites with that of other animal populations. I have not set the welfare of farmed BSF and mealworms to 0, but doing this would only slightly reinforce my point.
To clarify: I think soil animals should be an area of focus. I'm unconvinced on nematodes specifically - but I think there's good arguments for assessment of the life experiences of higher-neuron soil species being a very important thing.
Thanks for clarifying, Kestrel. I would be curious to know what makes you unconvinced about nematodes in light of Andrews (2024) and Becerra at al. (2023).
After the post above, I recommended research informing how to increase the welfare of soil animals (for example, my top recommendation quoted above) over pursuing whatever land use change interventions naively seem to achieve that the most cost-effectively. I have little idea about whether funding HIPF (as recommended in the 1st sentence quoted above), or any other way of changing land use increases or decreases welfare. I am very uncertain about what increases or decreases soil-animal-years, and whether soil animals have positive or negative lives.
I currently recommend decreasing the uncertainty about how the (expectedhedonistic) welfare per unit time of different organisms and digital systems compares with that of humans. I am now more pessimistic about research informing how to increase the welfare of soil animals. I have very little idea about whether existing interventions which robustly increase the welfare of humans or non-soil animals increase or decrease animal welfare due to potentially dominant uncertain effects on soil animals. Likewise, I do not know whether hypothetical interventions which robustly increased the welfare of soil animals would increase or decrease welfare due to potentially dominant uncertain effects on soil microorganisms.
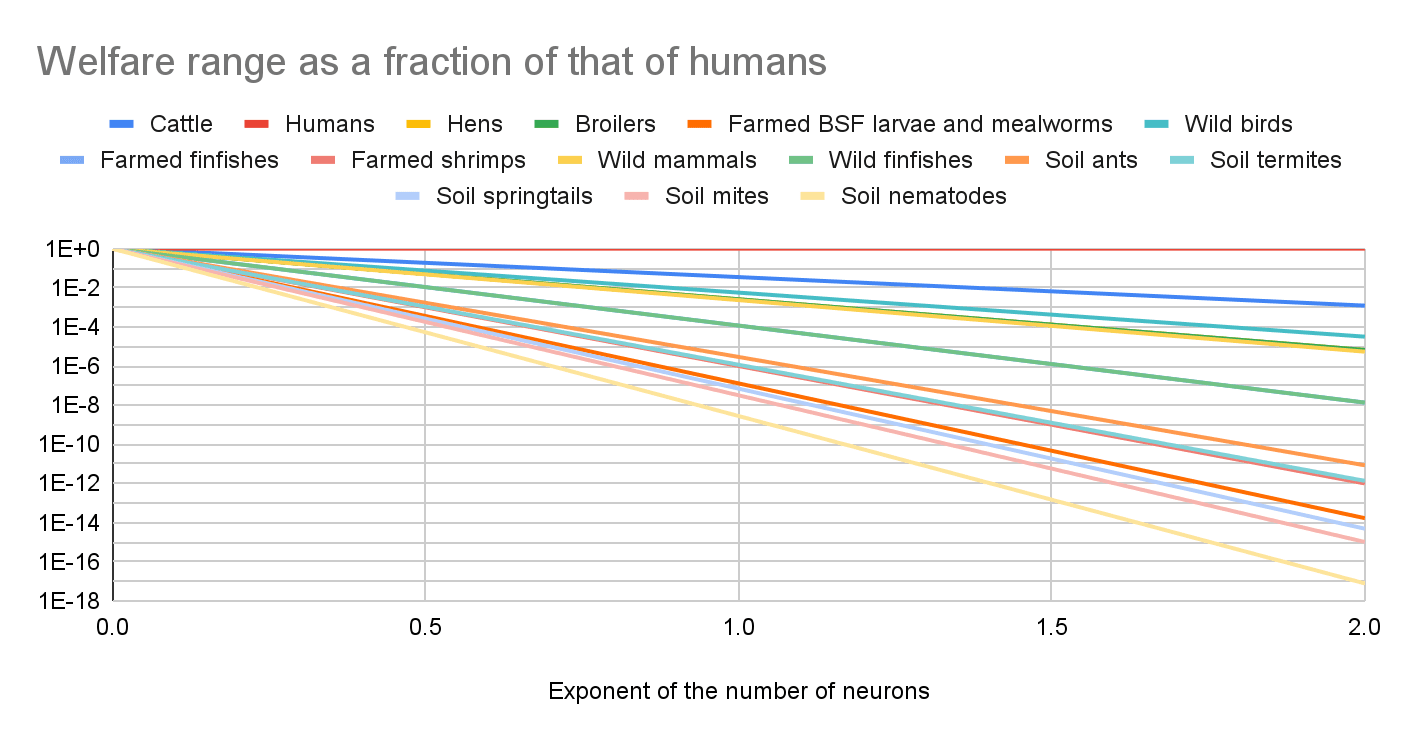
I set the welfare range as a fraction of that of humans to “number of neurons as a fraction of that of humans”^“exponent of the number of neurons”
The results for this can be used for proxies besides the number of neurons (for example, number of neurons in the forebrain). If one thinks the welfare range as a fraction of that of humans is w = "proxy as a fraction of that of humans"^"exponent of the proxy", and that "proxy as a fraction of that of humans" = "number of neurons as a fraction of that of humans"^k, w = "number of neurons as a fraction of that of humans"^(k*"exponent of the proxy"). So the results based on the new proxy for "exponent of the proxy" would be the same as my results based on the number of neurons for "exponent of the number of neurons" = k*"exponent of the proxy".
My estimate that the annual welfare of cattle, hens, broilers, and farmed BSF larvae and mealworms, finfishes, and shrimps is -2.48 times that of humans (for my preferred exponent of the number of neurons of 0.5), and assumption that humans have a welfare of 0.885 QALY/human-year imply the welfare of the farmed animals is -2.19 QALY/human-year (= -2.48*0.885). I calculate the Shrimp Welfare Project’s (SWP’s) Humane Slaughter Initiative (HSI) has increased the welfare of shrimps by 20.6 QALY/$. HSI is the intervention I am aware of which most cost-effectively increases the welfare of farmed animals. I estimate it increases the welfare of shrimps 29.4 (= 20.6/0.701) times as cost-effectively as cage-free corporate campaigns increase the welfare of chickens. Assuming donating to SWP is as cost-effective as HSI has been, donating 0.106 $ (= 2.19/20.6) to it offsets the effects on the farmed animals of 1 human-year. This is 0.0384 % (= 0.106/276) of the 276 $ estimated by FarmKind, @Aidan Alexander.
Here is an alternative estimate based on results from Animal Charity Evaluators (ACE). They estimate 0.126suffering-adjusted days (SADs) per meal in the United States (US), and assume 3 meals per person-day, which implies effects on farmed animals from food consumption in the US of 138 SAD/person-year (= 0.126*3*365.25). ACE estimatesThe Humane League's (THL's) cage-free and better chicken commitment (BCC) accountability work avert 88 and 30 SAD/$, whose mean is 59.0 SAD/$ (= (88 + 30)/2). So I conclude donating 2.34 $/person-year (= 138/59.0) to THL offsets the effects on farmed animals of (random) people in the US, 0.848 % (= 2.34/276) of FarmKind's estimate.
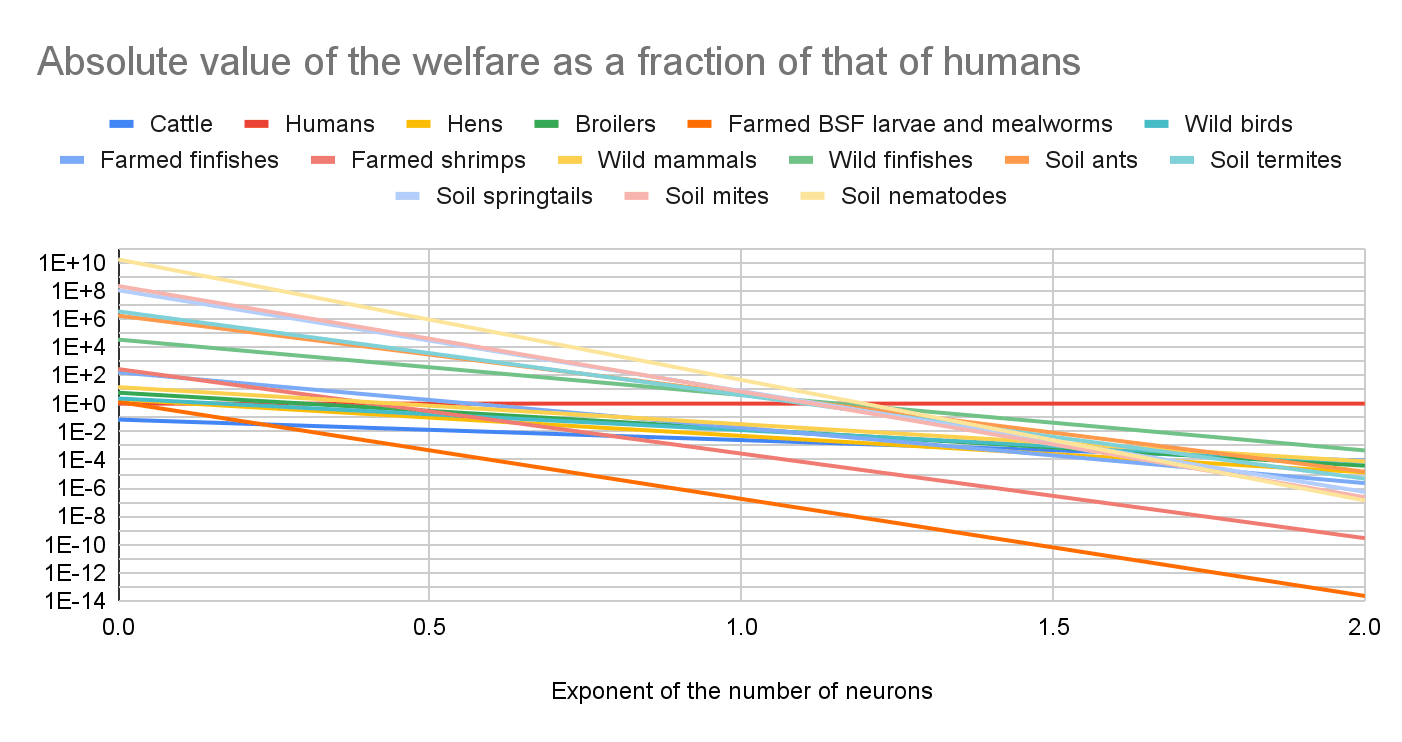
I estimate the annual welfare in QALY/year of cattle, humans, hens, broilers, farmed black soldier fly (BSF) larvae and mealworms, wild birds, farmed finfishes and shrimps, wild mammals and finfishes, and soil ants, termites, springtails, mites, and nematodes. I calculate that multiplying:
Population.
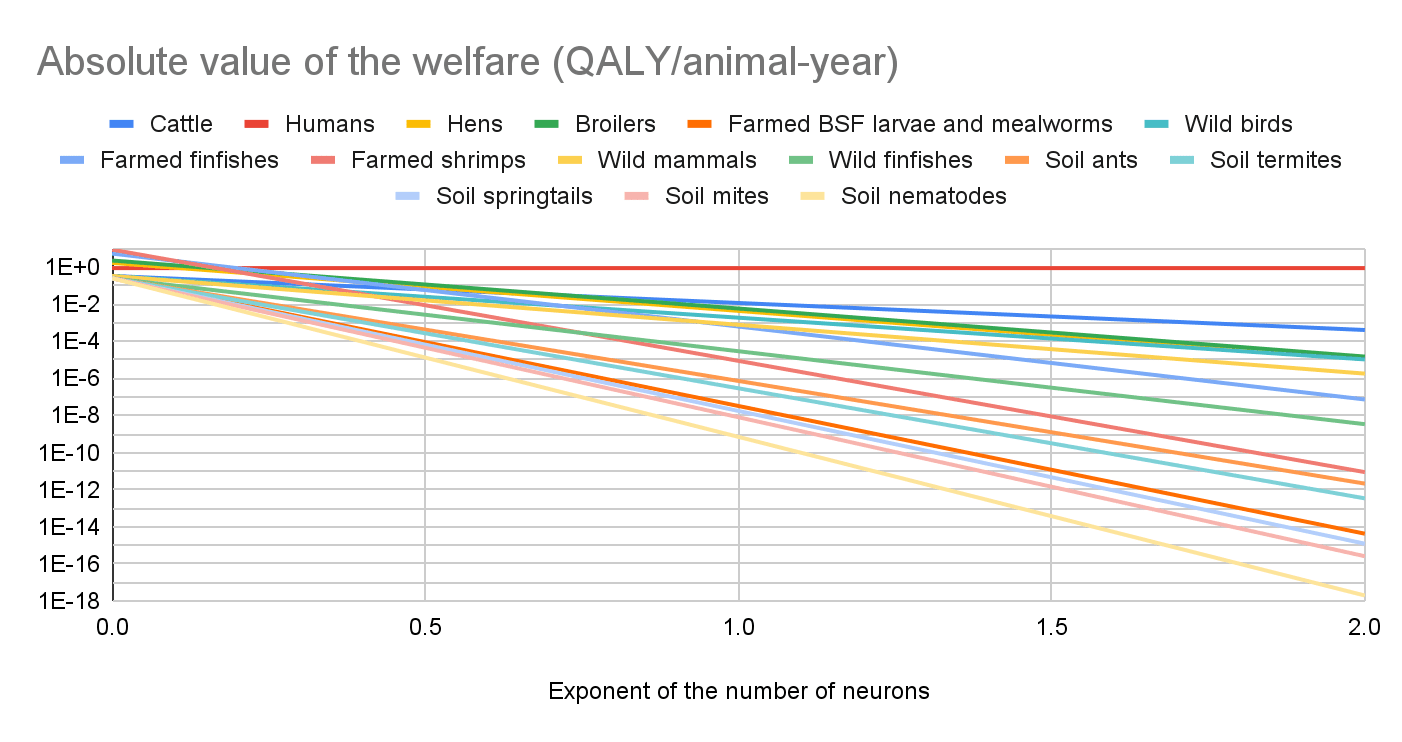
Welfare range (difference between the maximum and minimum expected hedonistic welfare per unit time) as a fraction of that of humans. This is the factor enabling comparisons between the welfare of different species. It is 1 for humans, and would be 0 for animals with a probability of sentience of 0.
Welfare per animal-year as a fraction of the welfare per fully-happy-animal-year. This describes the quality of the living conditions. It is 1 for fully happy animals, and 0 for animals with neutral lives.
I set the welfare range as a fraction of that of humans to “number of neurons as a fraction of that of humans”^“exponent of the number of neurons”, with the exponent ranging from 0 to 2. For an exponent of the number of neurons of:
0, all animals have the welfare range of humans.
0.188:
The welfare ranges are pretty similar to the estimates in Bob Fischer’s book about comparing animal welfare across species, which contains what Rethink Priorities (RP) stands behind now. An exponent of 0.188 explains78.6 % of their variance.
The number of neurons has to become 209 k (= 10^(1/0.188)) times as large for the welfare range to become 10 times as large.
0.5:
I get my best guesses for the welfare ranges.
The number of neurons has to become 100 (= 10^(1/0.5)) times as large for the welfare range to become 10 times as large.
1:
The welfare ranges are proportional to the number of neurons.
The number of neurons has to become 10 times as large for the welfare range to become 10 times as large.
2, the number of neurons has to become 3.16 (= 10^(1/2)) times as large for the welfare range to become 10 times as large.
Cattle, hens, broilers, and farmed BSF larvae and mealworms, finfishes, and shrimps have 0.0187 times as many neurons as humans, and -52.9 and -2.48 times as much welfare for exponents of the number of neurons of 0.19 and 0.5.
Wild birds, mammals, and finfishes have 14.5 times as many neurons as humans, and -6.24 k and -376 times as much welfare for exponents of the number of neurons of 0.19 and 0.5.
Soil ants, termites, mites, springtails, and nematodes have 253 times as many neurons as humans, and -418 M and -977 k times as much welfare for exponents of the number of neurons of 0.19 and 0.5.
My results suggest prioritising increasing the welfare of soil animals. Yet, what matters is increasing welfare as much as possible per $, and this need not imply prioritising increasing the welfare of the animals accounting for the vast majority of total welfare in absolute terms. However, I analysed the cost-effectiveness of interventions targeting humans and farmed animals accounting for soil animals, and concluded the most cost-effective ways of saving human lives increase animal welfare much more cost-effectively than interventions targeting farmed animals for any exponent of the number of neurons. I continue to recommend funding the Centre for Exploratory Altruism Research’s (CEARCH’s) High Impact Philanthropy Fund (HIPF), which I estimate decreases 5.07 billion soil-animal-years per $. I recommend even more investigating whether soil nematodes have positive or negative lives.
Methods
Overview
I estimate the annual welfare in QALY/year of cattle, humans, hens, broilers, farmed BSF larvae and mealworms, wild birds, farmed finfishes and shrimps, wild mammals and finfishes, and soil ants, termites, springtails, mites, and nematodes. I calculate that multiplying:
Population.
Welfare range (difference between the maximum and minimum expected hedonistic welfare per unit time) as a fraction of that of humans. This is the factor enabling comparisons between the welfare of different species. It is 1 for humans, and would be 0 for animals with a probability of sentience of 0.
Welfare per animal-year as a fraction of the welfare per fully-happy-animal-year. This describes the quality of the living conditions. It is 1 for fully happy animals, and 0 for animals with neutral lives.
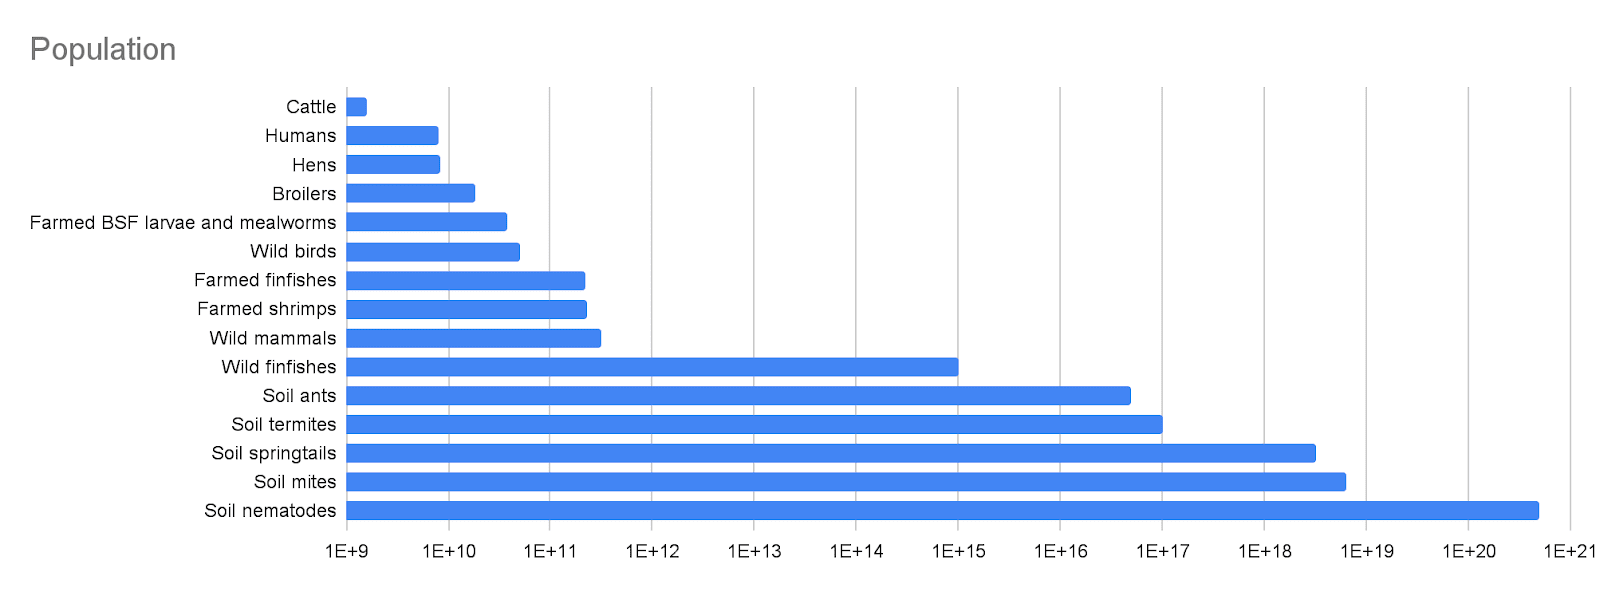
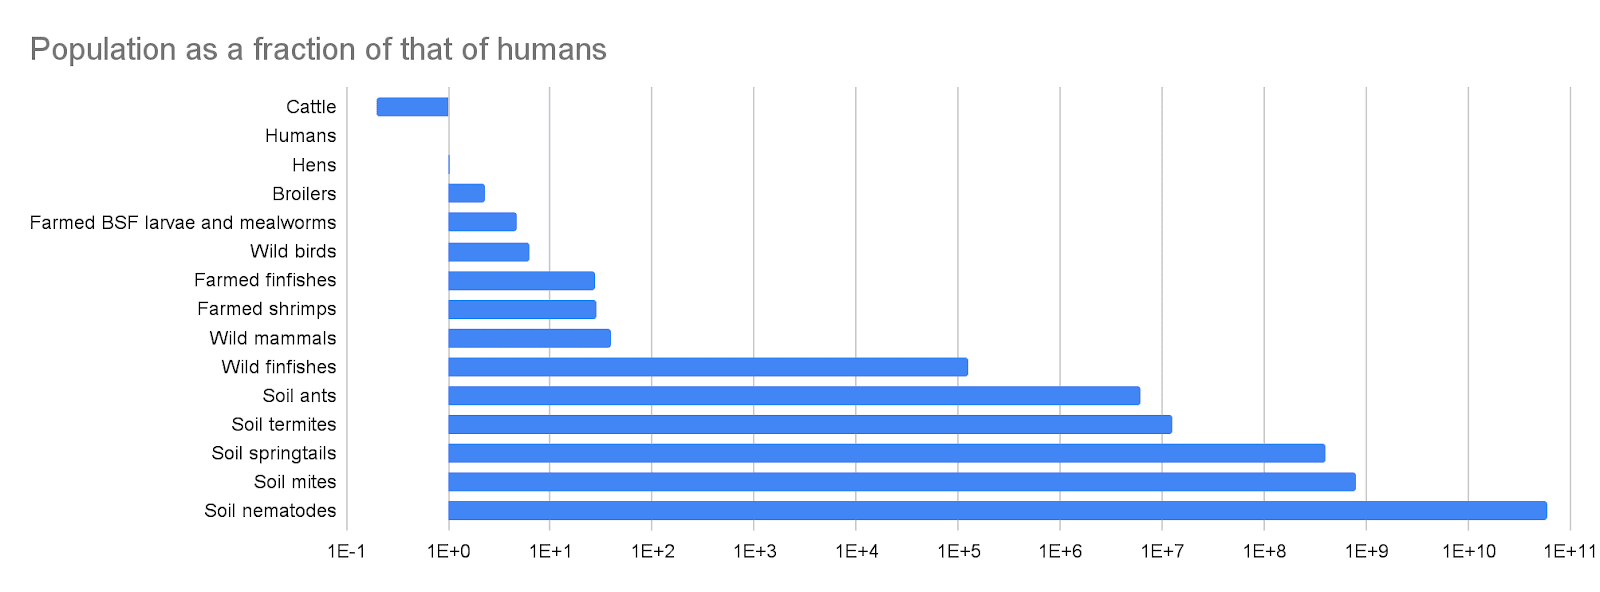
Here are my values for the population, from the smallest to largest:
1.58 billion cattle, as reported by the Food and Agriculture Organization (FAO) for 2023.
8.09 billion humans, as estimated by the United Nations (UN) for 2023.
18.8 billion broilers, which is the difference between the 27.2 billion chickens and 8.44 billion hens reported by FAO for 2023. This difference includes the breeders of laying hens, but I guess excluding this would barely decrease the number of broilers.
38.2 billion farmed black soldier fly (BSF) larvae and mealworms, as estimated by Hannah and Sagar for 2022.
50 billion wild birds, in agreement with Callaghan et al. (2021). “By aggregating the species-level estimates, we find that there are ∼50 billion individual birds in the world at present”.
223 billion farmed finfish, as estimated by Hannah McKay and Sagar Shah for 2022.
230 billion farmed shrimps, as estimated by Hannah and Sagar for 2020.
316 billion wild mammals, which is the geometric mean of the lower and upper bound estimated by Brian Tomasik of 100 billion and 1 trillion.
5*10^16 soil ants, in agreement with Rosenberg et al. (2023). “Our estimated global population of nonarboreal ants, considered as part of the soil and plant litter habitat, is 5 × 10^16 (uncertainty range, 1 × 10^16 to 9 × 10^16) individuals”.
10^17 soil termites, as shared by Yuval Rosenberg, the 1st author of Rosenberg et al. (2023). “We estimate their population to be about 10^17 with a 2-fold uncertainty”.
3.17*10^18 soil springtails. This is the product between:
10^19 soil arthropods from Rosenberg et al. (2023). “there are ≈1 × 10^19 (twofold uncertainty range) soil arthropods on Earth”.
95 % of soil springtails and mites among soil arthropods from Rosenberg et al. (2023). “there are ≈1 × 10^19 (twofold uncertainty range) soil arthropods on Earth, ≈95% of which are soil mites and springtails”.
1/3 (= 1 - 2/3) of soil springtails among soil springtails and mites from Rosenberg et al. (2023). “The [soil] microarthropods, mites and springtails, account for >95% of the total population of soil arthropods, with about two-thirds of these being mites". I confirmed with the 1st author “>95%” is supposed to mean “≈95%”, which is what is mentioned in the abstract”.
6.33*10^18 soil mites. This is the product between:
10^19 soil arthropods from Rosenberg et al. (2023).
95 % of soil springtails and mites among soil arthropods from Rosenberg et al. (2023).
2/3 of soil mites among soil springtails and mites from Rosenberg et al. (2023).
4.89*10^20 soil nematodes. This is the ratio between:
4.4*10^20 soil nematodes from van den Hoogen et al. (2019). “The resulting maps show that 4.4 ± 0.64 × 10²⁰ nematodes (with a total biomass of approximately 0.3 gigatonnes) inhabit surface soils across the world”. They “focus on the top 15 cm of soil, which is the most biologically active zone of soils”, and Stefan Geisen, the 2nd author, clarified they focussed on the most active layer, which was sometimes more or less than 15 cm.
90 % of nematodes in the top 15 cm of soil among soil nematodes, which is a guess from Stefan.
Welfare range
I set the welfare range as a fraction of that of humans to “number of neurons as a fraction of that of humans”^“exponent of the number of neurons”, with the exponent ranging from 0 to 2. For an exponent of the number of neurons of:
0, all animals have the welfare range of humans.
0.188:
The welfare ranges are pretty similar to the estimates in Bob’s book about comparing animal welfare across species, which contains what RP stands behind now. An exponent of 0.188 explains78.6 % of their variance.
The number of neurons has to become 209 k (= 10^(1/0.188)) times as large for the welfare range to become 10 times as large.
0.5:
I get my best guesses for the welfare ranges.
The number of neurons has to become 100 (= 10^(1/0.5)) times as large for the welfare range to become 10 times as large.
1:
The welfare ranges are proportional to the number of neurons.
The number of neurons has to become 10 times as large for the welfare range to become 10 times as large.
2, the number of neurons has to become 3.16 (= 10^(1/2)) times as large for the welfare range to become 10 times as large.
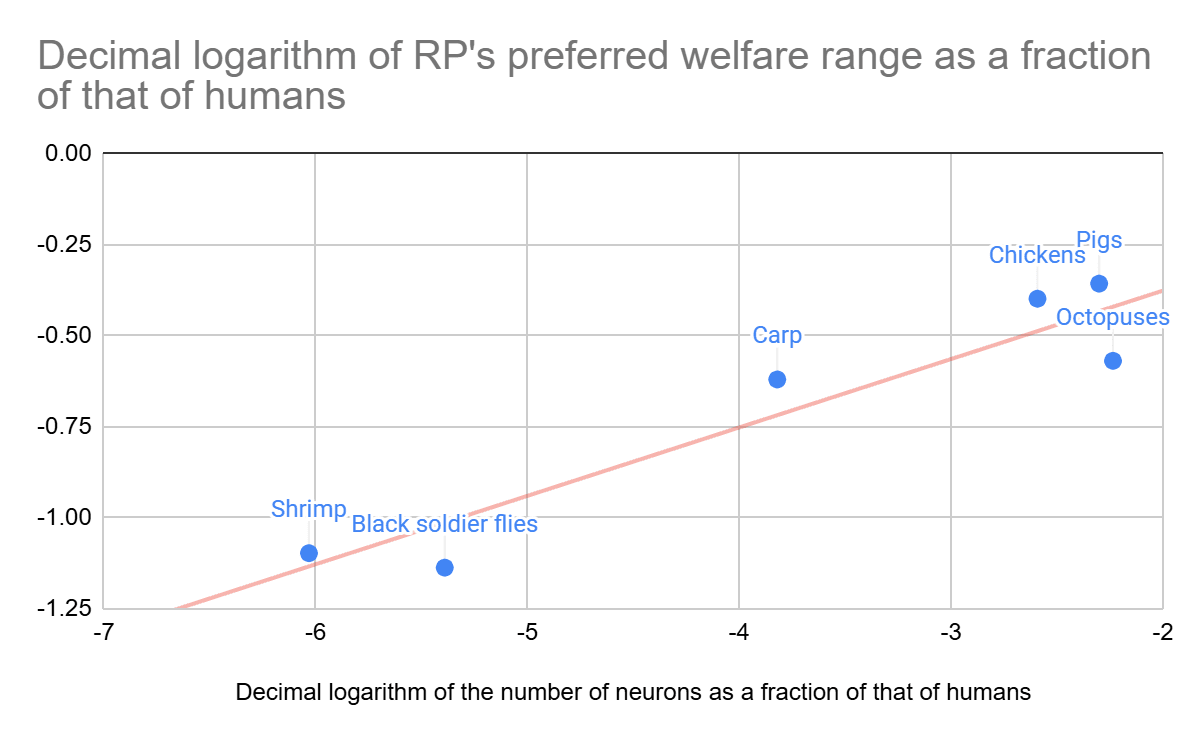
RP’s moral weight project included a report by Adam Shriver concluding “there is no straightforward empirical evidence or compelling conceptual arguments indicating that relative differences in neuron counts within or between species reliably predicts welfare relevant functional capacities”. I guess there are other factors besides the number of neurons that influence the welfare range. However, an exponent of 0.188 explains 78.6 % of the variance of the estimates in Bob’s book. I get this exponent from the slope of the belowlinear regression with null intercept of the logarithm of RP’s preferred welfare range as a fraction of that of humans on the logarithm of the number of neurons as a fraction of that of humans. I rely on a simple formula for the welfare range to decrease noise, and easily obtain estimates for animals not covered in the book to explore implications for cause prioritisation.
My formula for the welfare range as a fraction of that of humans implies a welfare range of 0 for organisms without neurons, which I think is an underestimate, as I am not certain they have a constant welfare per unit time as a result of not having neurons. Furthermore, I speculate effects on microorganisms, which do not have neurons, are much larger than those on soil animals, although positively correlated.
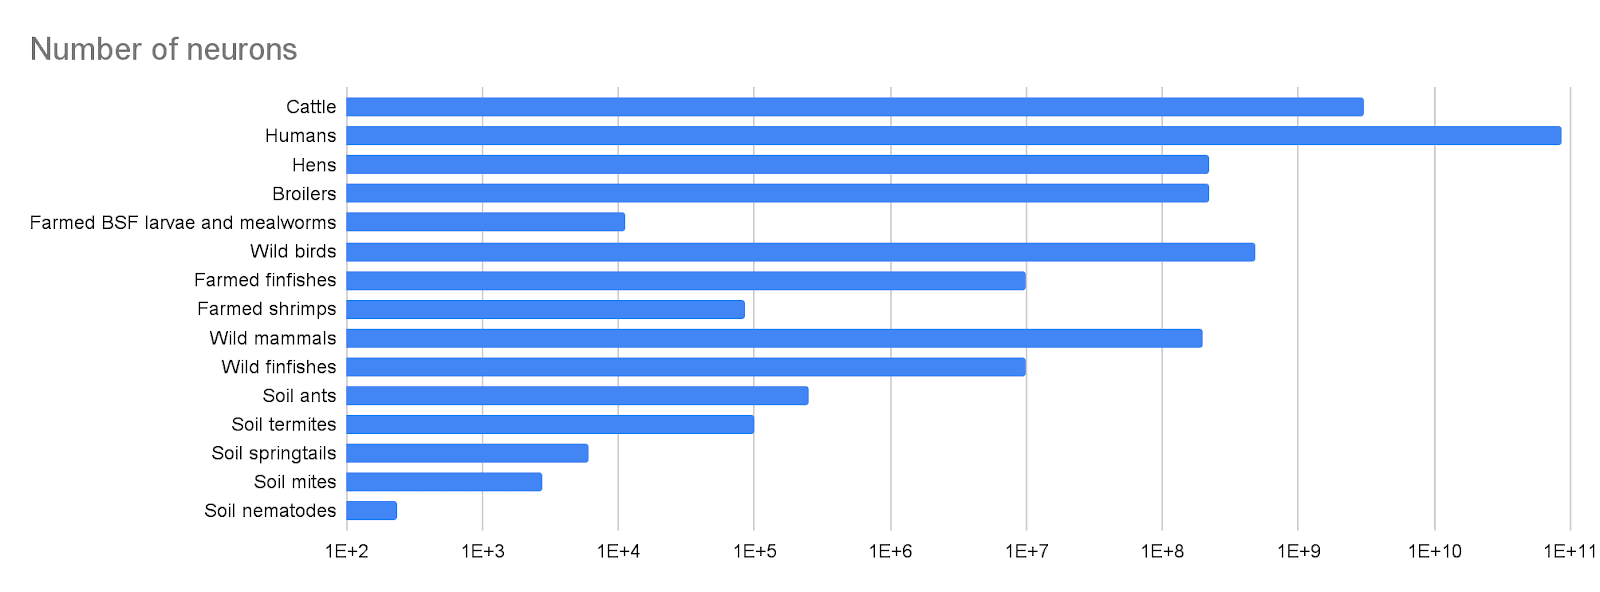
I use the following values for the number of neurons, from the highest to lowest:
3 billion for cattle, as estimated for cows by Suzana Herculano-Houzel according to Carl Shulman. “She also studies scaling patterns of brain size and neuron count in various taxonomic groupings, and in her book estimates that a cow would have ~3 billion neurons”.
483 M for wild birds, as mentioned on Wikipedia for common starlings. I guess this has a similar number of neurons as the European Starling, which is the 2nd most abundant bird species (1.3 billion) according to Callaghan et al. (2021), which is my source for the population of wild birds. I did not quickly find the number of neurons of the most abundant species, House Sparrow (1.6 billion).
200 M for wild mammals, as mentioned on Wikipedia for brown rats, which are the most abundant wild mammals.
10 M for farmed and wild finfishes, as mentioned on Wikipedia for adult zebrafishes.
250 k for soil ants, as mentioned on Wikipedia for ants.
100 k for soil termites, as mentioned by Pestofix. “A termite’s brain has just 100,000 neurons, yet it controls navigation, construction, and social coordination”. They did not link to the source of the estimate. I suspect they just assumed it to be equal to the number of neurons of fruit flies of 135 k.
86.0 k for farmed shrimps, 10^-6 that of humans in agreement with Table 5 of the report describing the estimation of the welfare ranges RP initially presented.
11.2 k for farmed BSF larvae and mealworms, which is the mean between the 2.3 k and 20 k estimated by Meghan Barrett for the stages L1 and L6 of BSF larvae. “L1: 2,300 [brain] cells [neurons]; L6: 20,000 cells”.
6 k for soil springtails, as guessed by Gemini 2.5 Pro (preview) on 12 May 2025 for the modal soil springtail.
2.75 k for soil mites, as guessed by Gemini 2.5 Pro (preview) on 12 May 2025 for the modal soil mite.
240 for soil nematodes, as guessed by Gemini 2.5 Pro (preview) on 12 May 2025 for the modal soil nematode. That is 79.5 % of the 302 neurons of an adult.
Welfare per animal-year
Here are my values for the welfare per animal-year as a fraction of the welfare per fully-happy-animal-year, from the lowest to highest:
-8.77 for farmed shrimps, as I hadestimated for shrimps on an ongrowing farm with air asphyxiation slaughter.
-5.38 for farmed finfishes, which is the sum between 25 % of my value for broilers, 25 % of my value for hens, and 50 % of my value for farmed shrimps.
-2.27 for broilers, as I hadestimated for broilers in a conventional scenario.
-1.69 for hens, as I hadestimated for hens in conventional cages.
-0.25 for farmed BSF larvae and mealworms, wild finishes, and soil ants, termites, springtails, mites, and nematodes, which is my guess.
1/3 for cattle, and wild mammals and birds, which is my guess.
My best guess is that soil animals have negative lives. I am very uncertain, but my assumption of negative lives is quite typical. Karolina Sarek, Joey Savoie, and David Moss estimated-0.42 for the “wild bug” in 2018, which is more negative than what I assumed.
Results
1E+N means 1*10^N. For example, 1E+2 means 1*10^2 = 100.
Population
Number of neurons
Total number of neurons
Population, number of neurons, and welfare per animal-year
Animals
Population
Population as a fraction of that of humans
Number of neurons
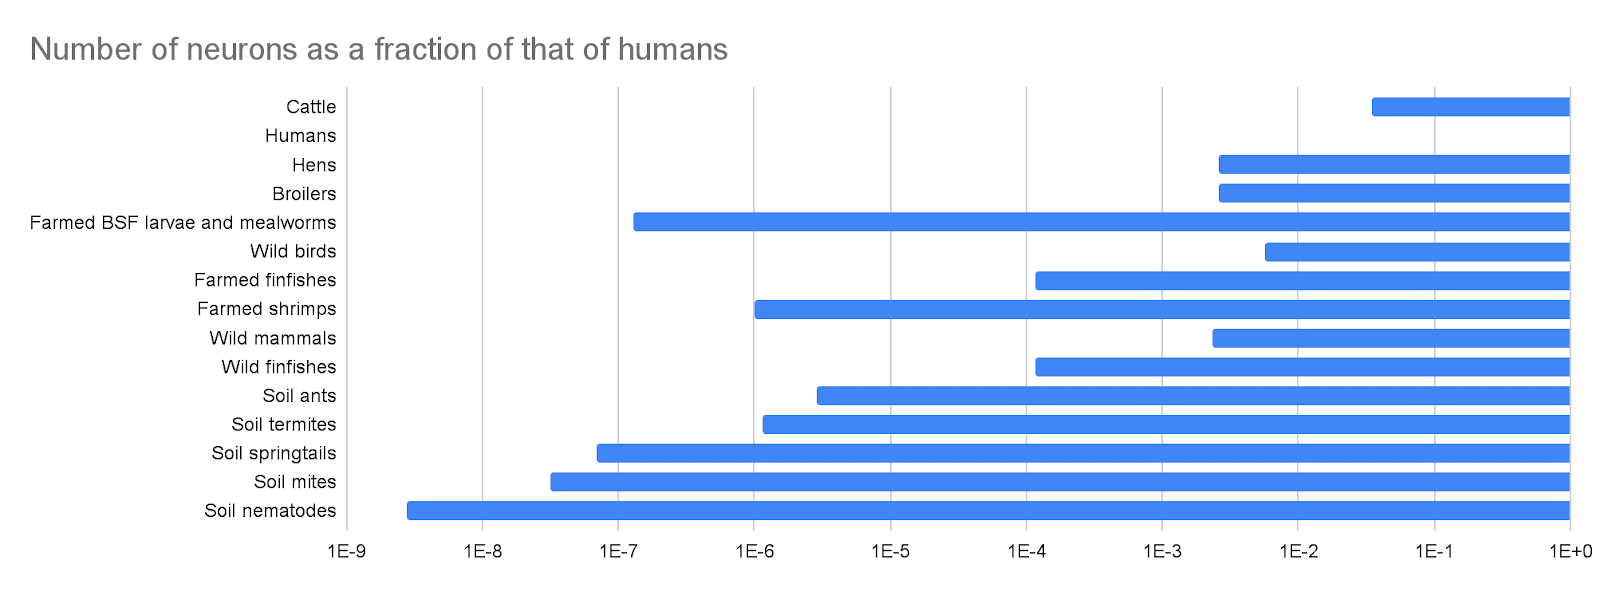
Number of neurons as a fraction of that of humans
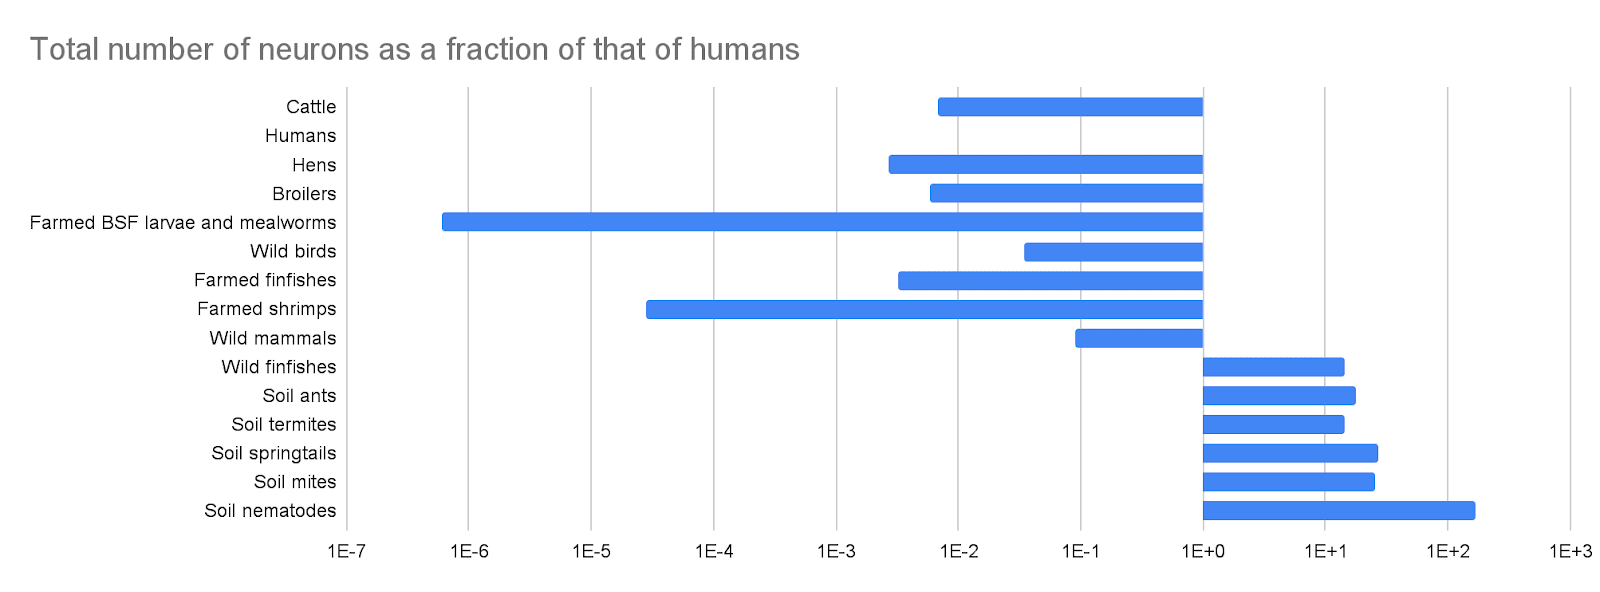
Total number of neurons
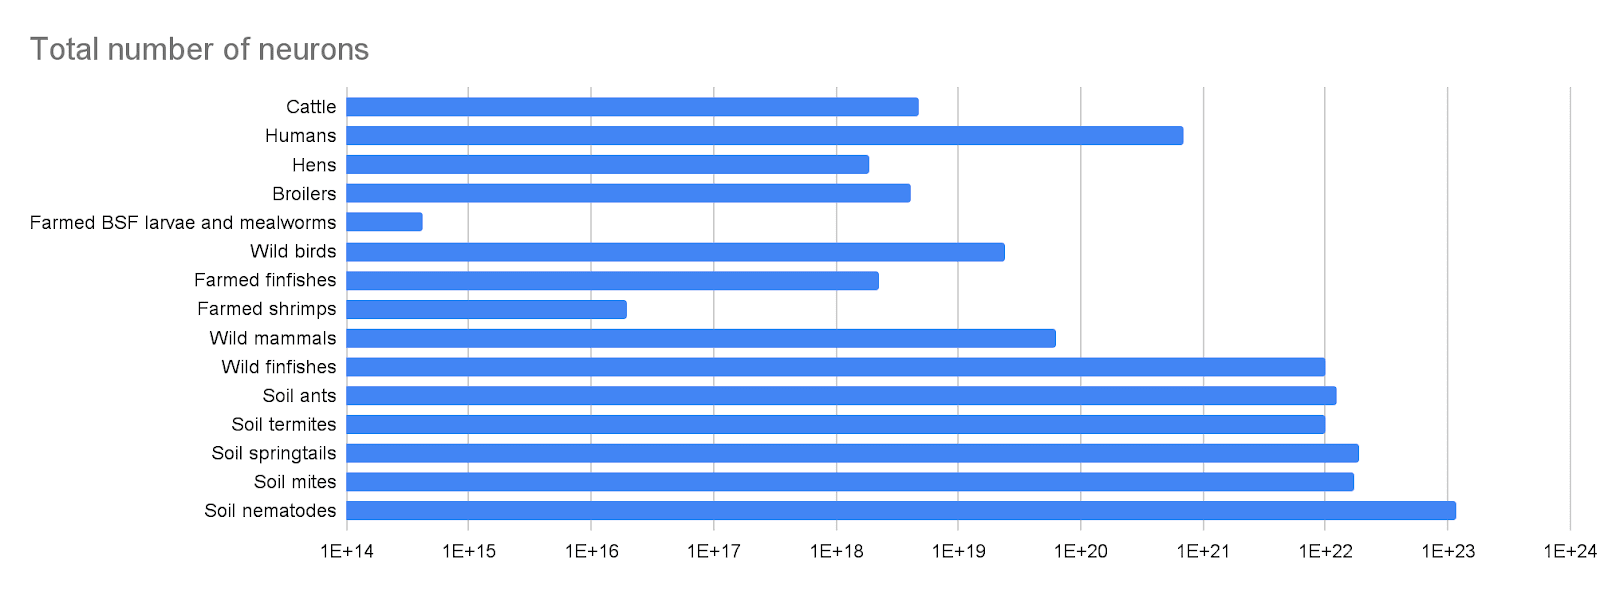
Total number of neurons as a fraction of that of humans
Welfare per animal-year as a fraction of the welfare per fully-happy-animal-year
Cattle
1.58E+09
19.5%
3.00E+09
3.49%
4.74E+18
0.681%
0.333
Humans
8.09E+09
100%
8.60E+10
100%
6.96E+20
100%
0.885
Hens
8.44E+09
1.04
2.21E+08
0.257%
1.87E+18
0.268%
-1.69
Broilers
1.88E+10
2.32
2.21E+08
0.257%
4.15E+18
0.596%
-2.27
Farmed BSF larvae and mealworms
3.82E+10
4.72
1.12E+04
1.30E-07
4.26E+14
6.12E-07
-0.25
Wild birds
5.00E+10
6.18
4.83E+08
5.62E-03
2.42E+19
3.47%
0.333
Farmed finfishes
2.23E+11
27.6
1.00E+07
0.0116%
2.23E+18
0.321%
-5.38
Farmed shrimps
2.30E+11
28.4
8.60E+04
1.00E-06
1.98E+16
0.00284%
-8.77
Wild mammals
3.16E+11
39.1
2.00E+08
0.233%
6.32E+19
9.09%
0.333
Wild finfishes
1.00E+15
1.24E+05
1.00E+07
0.0116%
1.00E+22
14.4
-0.250
Soil ants
5.00E+16
6.18E+06
2.50E+05
2.91E-06
1.25E+22
18.0
-0.250
Soil termites
1.00E+17
1.24E+07
1.00E+05
1.16E-06
1.00E+22
14.4
-0.250
Soil springtails
3.17E+18
3.91E+08
6.00E+03
6.98E-08
1.90E+22
27.3
-0.250
Soil mites
6.33E+18
7.83E+08
2.75E+03
3.20E-08
1.74E+22
25.0
-0.250
Soil nematodes
4.89E+20
6.04E+10
240
2.79E-09
1.17E+23
169
-0.250
Welfare range
Welfare per animal-year
Annual welfare
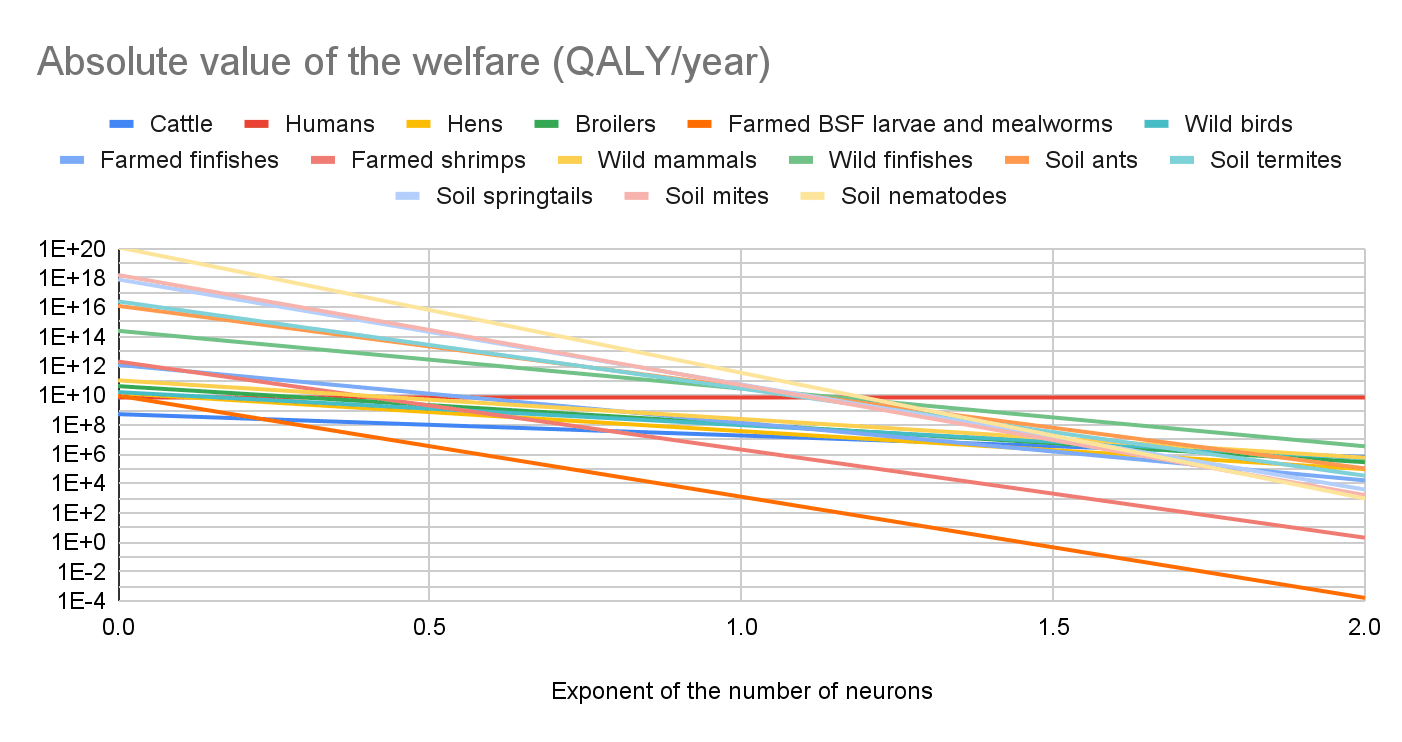
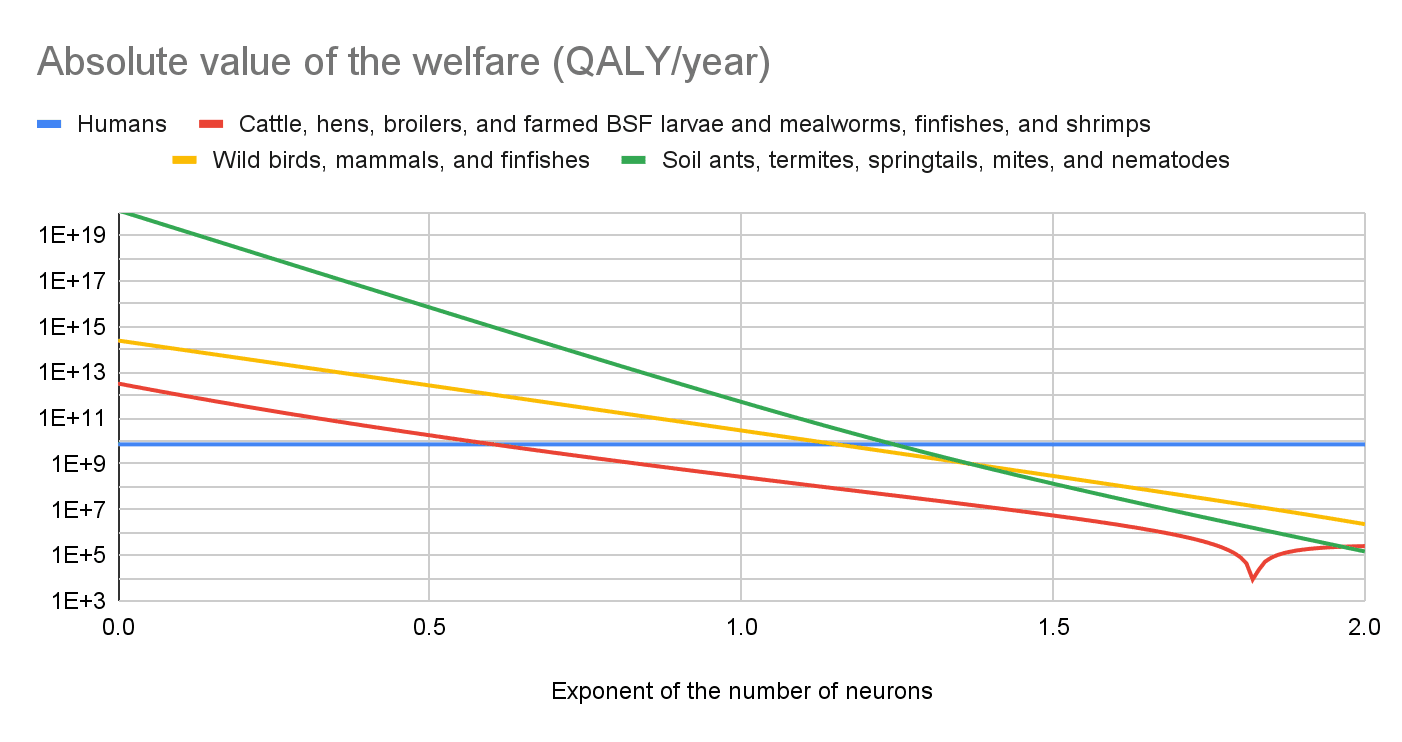
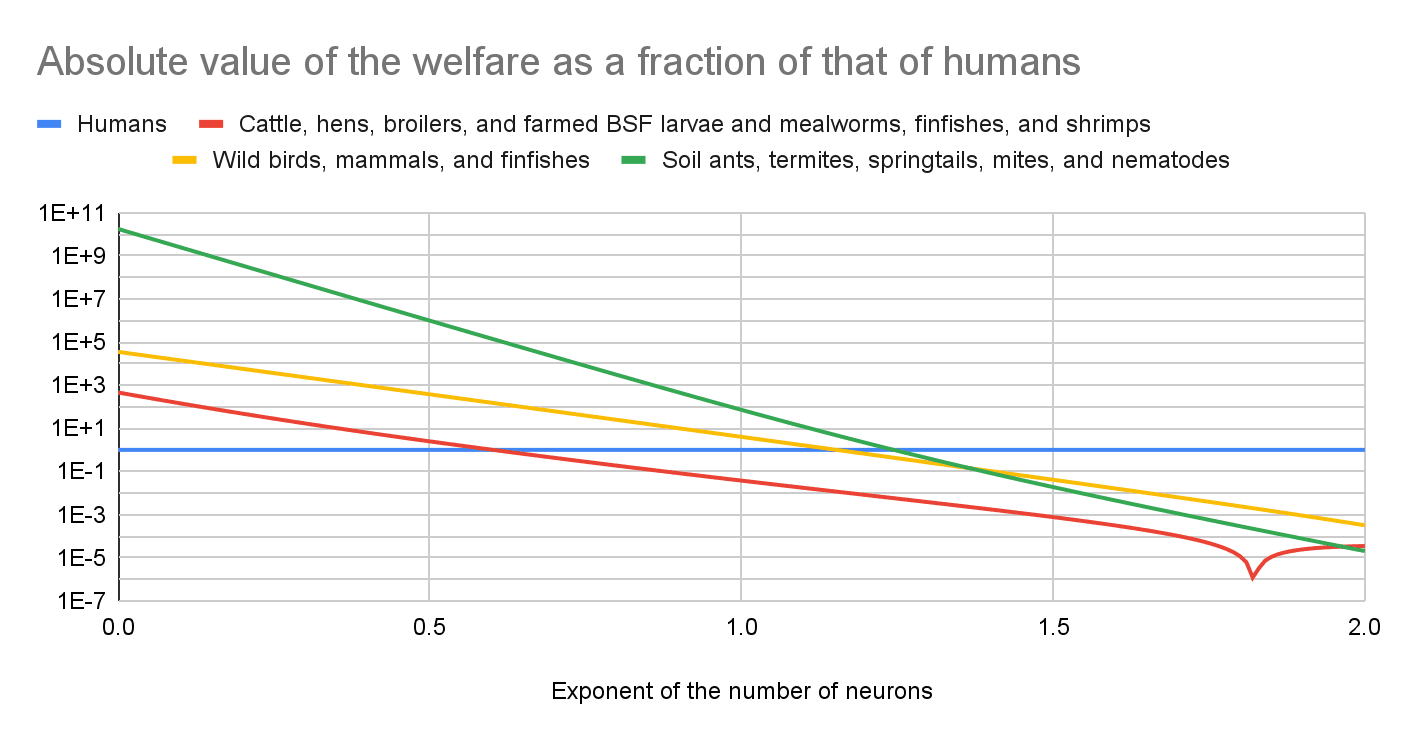
Among the following 4 groups, i) humans, ii) cattle, hens, broilers, and farmed BSF larvae and mealworms, finfishes, and shrimps, iii) wild birds, mammals, and finfishes, and iv) soil ants, termites, springtails, mites, and nematodes, I estimate the soil animals have the largest absolute value of the annual welfare for an exponent of the number of neurons up to 1.24, and humans for an exponent of at least 1.25. This suggests focussing on increasing the welfare of soil animals or humans.
The sharp points in the red lines representing the farmed animals in the last 2 graphs below mark the transition from negative to positive welfare. For a sufficiently high exponent, the welfare of cattle dominates because they have the most neurons, and I assumed it to be positive.
Key numbers
Below are the results for each animal population.
Animals
Total number of neurons
Total number of neurons as a fraction of that of humans
Welfare for an exponent of the number of neurons of 0.19 (QALY/animal-year)
Welfare for an exponent of the number of neurons of 0.19 (QALY/year)
Welfare for an exponent of the number of neurons of 0.19 as a fraction of that of humans
Welfare for an exponent of the number of neurons of 0.5 (QALY/animal-year)
Welfare for an exponent of the number of neurons of 0.5 (QALY/year)
Welfare for an exponent of the number of neurons of 0.5 as a fraction of that of humans
Cattle, hens, broilers, and farmed BSF larvae and mealworms, finfishes, and shrimps have 0.0187 times as many neurons as humans, and -52.9 and -2.48 times as much welfare for exponents of the number of neurons of 0.19 and 0.5.
Wild birds, mammals, and finfishes have 14.5 times as many neurons as humans, and -6.24 k and -376 times as much welfare for exponents of the number of neurons of 0.19 and 0.5.
Soil ants, termites, mites, springtails, and nematodes have 253 times as many neurons as humans, and -418 M and -977 k times as much welfare for exponents of the number of neurons of 0.19 and 0.5.
My results suggest prioritising increasing the welfare of soil animals. Yet, what matters is increasing welfare as much as possible per $, and this need not imply prioritising increasing the welfare of the animals accounting for the vast majority of total welfare in absolute terms. However, I analysed the cost-effectiveness of interventions targeting humans and farmed animals accounting for soil animals, and concluded the most cost-effective ways of saving human lives increase animal welfare much more cost-effectively than interventions targeting farmed animals for any exponent of the number of neurons. I continue to recommend funding HIPF, which I estimate decreases 5.07 billion soil-animal-years per $. I recommend even more investigating whether soil nematodes have positive or negative lives.
Acknowledgements
Thanks to Damin Curtis for a chat which contributed towards my publishing this post, to Kevin Xia for suggesting a new title, and adding more groups of wild animals, and to Yuval Rosenberg for sharing an estimate for the number of soil termites. I listed people’s names alphabetically. The views expressed in the post are my own.
This post is co-authored with Ben Garfinkel. It is cross-posted from the CEA blog. A PDF version can be found here.
Summary: Some strategic decisions available to the effective altruism m...
Disclaimer: Although I work on the Groups Team at CEA, I’m writing this in a personal capacity, and this post does not constitute an endorsement by CEA.
Agency - the realisation that you really can just do things.
TL;DR
Biosecurity needs people (of any background) who are agentic and have a high execution velocity and track record....
TL;DR: Marginal Victories is a new initiative to provide 1:1 career advising, opportunities, and resources for people exploring high-leverage U.S. democracy preservation and political work. Built by impact-oriented people doing pro-democracy work, the early MVP is now up at marginalvictories.org. Fill out the 10-minute form now to receive these resources as they become available over the next few...


I wonder if the power required by brains is proportional to the number of neurons across very different species. It seems to be so among mammals. From Herculano-Houzel (2011):