Executive summary: The author argues that businesses whose residual profits are permanently routed to charity can often outperform conventionally owned firms because stakeholders prefer charitable profit destinations at parity, making charitable ownership a potentially scalable and under-tested mechanism for generating social impact.
Key points:
The Charitable Ownership Advantage (COA) thesis is that, when price, quality, and other core attributes are comparable, consumers, employees, suppliers, lenders, and other stakeholders often prefer businesses whose profits go to charity rather than private shareholders.
Profit for Good (PFG) changes the destination of residual profits while preserving ordinary commercial operations, relying on the fact that ownership is already largely separated from day-to-day management in much of the modern economy.
Existing examples such as Newman’s Own, Humanitix, Patagonia, Bosch, Novo Nordisk, and Tata are presented as evidence that charitable or foundation-linked ownership can coexist with successful large-scale business operations and can sometimes generate stakeholder engagement advantages.
The author argues that realized advantage depends on stakeholder preference being activated through awareness and trust, making verification systems, certification, disclosure, and broader category infrastructure important complements to charitable ownership itself.
The report treats the magnitude of COA as an open empirical question, decomposes the thesis into four falsifiable links (preference, operational separability, preference-to-outcome translation, and net economic significance), and recommends testing them through an acquisition-based proof portfolio.
The central recommendation is to fund two coordinated efforts: a proof portfolio that acquires and converts mature businesses into PFG structures while measuring outcomes, and shared infrastructure that makes charitable ownership visible, trusted, and actionable for stakeholders and capital providers.
This comment was auto-generated by the EA Forum Team. Feel free to point out issues with this summary by replying to the comment, andcontact us if you have feedback.
So in AUS you get a 30% profit tax break if you make an existing business owned by a charity?
That's genuinely ridiculous in a positive way. Even if COA is zero, a philanthropist sitting on cash should do that immediately, and if COA is >0 it compounds even further?
TL;DR
* GOAL 3 is a social enterprise that created IMPALA, a patient monitoring and digital platform system for low-resource settings. There is also a GOAL 3 foundation that raises funds to ensure underserved communities will be reached.
* A recently completed report from Rethink Priorities calculated IMPALA to have a cost per DALY averted of $7–17 in paediatr...
This month effective altruism has gotten lots of attention, including a cover story in The Economist. It feels pretty surreal to be on the receiving end of it. But I feel grateful these ideas have caught on, and even more grateful for the drive, earnestness, and compassion of so many people who took strange but well-argued ideas seriously and then actually acted on them....
Cross-posted from my Substack.
Epistemic status: I’ve puzzled over this for a long time but I’m not sure I came to the right answers. I'm sharing this partly because it might help others work on resource allocation, but mostly because some smarter reader might tell me how to do it better.
TL;DR:
* I he...
I have linked below my recent version of my research compilation on Profit for Good businesses and the Charitable Ownership Advantage thesis. I have spent several hundred, if not over a thousand hours, compiling the evidence supporting the thesis that, given our modern economy in which ownership is typically practically separate from business management and governance, Profit for Good businesses should outperform conventionally owned businesses due to non-zero preferences by stakeholders such as consumers and employees, who affect business performance. I have pasted below the Introduction and Executive Summary to this compilation, but even if you would only like to read that (which is probably enough for most people), I would encourage you to read it through the below hyperlink, given that there were some issues with the images (graphs, tables, etc.) being copied over. I note that although I reviewed the sources and iterated extensively regarding drafting the compilation, AI was used extensively in virtually all parts of the process, including drafting.
This compilation develops the research base for Profit for Good and the Charitable Ownership Advantage. The Executive Summary distills the thesis and recommendations; the body supplies the evidence, stress tests, financial modeling, and deployment architecture behind them.
The compilation is designed for different depths of engagement. Readers seeking the case can read the Executive Summary alone; it is self-contained. Readers doing diligence can pair the Executive Summary with the Section-by-Section Synthesis appendix, then consult targeted body sections for load-bearing claims. Readers checking a specific claim can follow the section references throughout the document. Readers who want the full argument should read the Executive Summary first, then §§1–10 in order.
Reader need
Best path
Quick read
Executive Summary alone
Diligence read
Executive Summary + Section-by-Section Synthesis, then targeted body sections
Claim check
Use section references (§1.1, §4, §8, §9A, §9B) for load-bearing claims
Full read
Executive Summary, then §§1–10 in order
The compilation distinguishes five claim types throughout. Structural or definitional claims follow from legal structure or accounting identity — for example, the mathematical relationship between charitable-ownership concentration and per-dollar charitable distribution. Documented empirical findings come from field experiments, longitudinal data, and peer-reviewed research — for example, revealed-preference studies of consumer behavior at price parity. Analog or exemplar evidence is used where direct PFG90+ measurement does not yet exist; the text treats these sources as contextual or conservative evidence, not as direct measurement of high-concentration PFG deployment. Modeled financial scenarios translate channel-level evidence into deployment-level outputs under specified assumptions — the §9B Total Charitable Value scenarios are the central example. Planned measurement claims identify what the proof portfolio is designed to test in its initial acquisition phase. These categories matter because the compilation does not claim every proposition at the same strength.
The calibration discipline runs throughout. Mechanism claims — legal structure, accounting identity, and the widespread separation of ownership from day-to-day operations in mature businesses — are stated with the highest confidence; the first two are definitional, the third is well-documented. Activation claims — whether stakeholders see, trust, and act on charitable ownership, and whether operations remain robust under conversion — carry calibrated confidence linked to their evidence base. Magnitude claims are treated as empirical and provisional until measured under the proof portfolio. Modeled financial outputs are scenario analyses, not forecasts. The compilation's central recommendation is disciplined acquisition-led testing, not broad deployment ahead of measurement.
The body follows the sequence the thesis requires. Sections 1–3 establish stakeholder preference across six channels, direct PFG exemplar evidence, and the global portability of the mechanism across institutional contexts. Sections 4–7 develop the mechanism: the parity structure that distinguishes PFG from operations-layer ethical models, the awareness and trust conditions that gate activation, the role of charitable-commitment concentration, and the shared infrastructure that makes the category visible at the point of decision. Section 8 stress-tests the thesis through four falsifiable links. Sections 9A and 9B translate the case into a proof-portfolio deployment design and a financial model under different activation scenarios. Section 10 synthesizes the implications and lays out the recommendations.
Disclosure and acknowledgments
Author affiliation. The author leads Project COA, one proposed implementation vehicle for the proof portfolio discussed in the Executive Summary. Readers should weigh the recommendations with that affiliation in mind; the thesis does not depend on any single vehicle.
Source review. Evan White (University of Chicago) provided source review and claim-checking comments on earlier drafts; remaining errors are the author's.
General disclaimer. Nothing in this compilation is legal, tax, investment, or fiduciary advice; deployment decisions require ordinary diligence.
Executive Summary
Profit for Good and the Charitable Ownership Advantage
This Executive Summary fronts a nine-section research compilation. The Section-by-Section Synthesis routes specific claims to the body, where they are developed in full.
Charitable ownership can make the same business more valuable. The claim is not that operating like a charity, charging premium prices, lowering quality, or accepting weaker commercial discipline makes a business more valuable. The claim is narrower and more testable: when the same business competes at parity, stakeholders may prefer the version whose residual profits go to charitable purposes rather than private owners. If that preference is visible, trusted, and actionable at the point of decision, it can become a business advantage. That is the Charitable Ownership Advantage (COA).
The existing record already contains two kinds of proof points. Activated PFG exemplars — Newman's Own ($600M+ to charity since 1982 in mainstream retail competition), Humanitix (A$20M+ as of 2026 with 40–45% lower platform fees passed through to users), Patagonia, Thankyou (A$19M+ since 2008), Impact Makers — show stakeholder response when the profit-destination story is visible. Foundation- and trust-controlled industrial firms — Bosch (94% foundation-owned, €91 billion in revenue), Carlsberg, Novo Nordisk, the Danish industrial foundations together at roughly 40% of listed market capitalization, Tata Sons (66% philanthropic-trust-owned, $328B+ across 26 listed companies) — show that charitable or foundation-linked ownership can coexist with world-class operations at substantial scale. They do not yet provide the missing evidence: clean, before-and-after, portfolio-level measurement under instrumented acquisition. But they shift the live question from feasibility to measured magnitude. The missing object is not proof that mature profitable businesses can be bought and operated — that market exists and operates routinely. The missing object is measured ownership-conversion evidence: audited before-and-after acquisitions showing what changes when residual profit-rights are routed to charity while operations remain commercially normal.
Profit for Good (PFG) changes the destination of residual profit-rights, not the operating model. The distinction matters because the vast majority of the mature economy already separates residual ownership from both day-to-day management and active governance. Vanguard, BlackRock, and State Street hold leading stakes across much of the S&P 500 without operating or actively governing portfolio companies. CEOs of widely-held public firms typically hold equity stakes of a few percent or less. Tens of trillions of dollars of profit-rights are held by index funds, pensions, endowments, mutual funds, ETFs, and retirement accounts whose beneficial owners neither operate nor govern the underlying firms. The same pattern holds in private markets: limited partners in private-equity, venture, and credit funds supply capital and receive residual profit-rights without running portfolio companies. Where formal governance rights exist, firms often actively defend against the small minority of holders who try to use them — through poison pills, dual-class shares, anti-activist provisions. Operating discipline is supplied through boards, managers, covenants, performance compensation, lenders, and market competition, not through the identity of the residual-profit recipient. PFG does not claim governance is worthless; it claims governance services can be supplied without giving private investors the residual charitable surplus. PFG uses that existing separation: it preserves commercial operating discipline while changing the destination of the surplus (§4; §8 Link 2).
Conventional competitors can imitate many ethical claims through CSR or brand messaging. They cannot fully imitate charitable residual ownership while retaining private residual upside. To neutralize the advantage completely they must convert — which expands the category rather than defeating it. Investors compete against this stakeholder preference; philanthropy can compete with it.
Realized competitive advantage at parity translates into improved financial performance: larger distributable surplus, lower default risk, more stable cash flows. That performance does two things. It scales charitable distribution per dollar of philanthropic capital deployed. It also makes PFG businesses underwriteable by commercial credit markets that price cash-flow stability, collateral, repayment capacity, and governance risk rather than mission alignment. As Phase 1 evidence accumulates, the financing universe expands beyond philanthropic capacity into mission-aligned and conventional credit — debt that can finance the spread of charitable ownership without taking equity or weakening the mission lock. The ceiling on the category shifts from donor sacrifice to financeable deployment.
The model does not ask people to give more. It asks whether enough stakeholders will choose, work for, lend to, supply, procure from, or amplify the same or better option when the destination of profits is charitable. The project of persuading people to give more is hard and bounded by willingness to sacrifice. The project of letting people help at no cost to themselves scales with ordinary economic activity.
If charitable ownership produces a structural advantage, why is there not already a thriving category? In part, there is — at the company level, where the proof points named above already operate at meaningful scale. What hasn't been built is the cohort-level evidence that turns company-level proof points into a recognized deployment category. The pieces are ordinary: mature-business acquisitions are routine commercial activity, professional management is the dominant operating model in mature firms, passive residual ownership is how the bulk of equity in those firms is already held, and foundation and trust ownership already operate at substantial scale. What is unusual is the frame. Social enterprise has mostly focused on operations — fair sourcing, better labor practices, sustainability, B Corp governance, founder generosity. Philanthropy, when focused on impact, has mostly asked which interventions do the most good per dollar, or how endowments can invest ethically — not whether charitable ownership itself could create a competitive business advantage unavailable to conventional capital. Conventional finance could not capture COA without surrendering the private residual upside that creates it. The frame that no actor with sufficient capital and mandate has yet operationalized is charitable ownership as a source of business advantage — and therefore as a deployable charitable-capital category. The missing object is not a new operating model; it is the measured ownership-conversion evidence and social proof that lets capital recognize and underwrite the category.
COA's exact magnitude is not yet proven. Its test-worthiness is. The mechanism is specific, the upside is large, and the downside of disciplined acquisition-led testing is bounded. The hard position to defend is no longer experimentation; it is leaving the test unrun.
Disclosure. The author leads Project COA, one proposed vehicle for the proof portfolio described below. Weigh the recommendation with that affiliation in mind. The thesis does not depend on Project COA.
Who this is for. Funders, foundation CIOs, philanthropic principals, impact lenders, operators, sellers, and ecosystem builders deciding whether charitable ownership now merits disciplined deployment.
The case in one page
Problem. High-impact charities, advocacy organizations, and policy groups have far more high-value work than current funding supports — across global health, extreme-poverty relief, environmental and climate work, and animal welfare. Ordinary corporate surplus largely defaults to private shareholders.
Mechanism. PFG businesses change who receives residual profits, not how the business operates. Operations remain commercially normal; ownership routes residual profit-rights to charitable purposes through credible, durable mechanisms — charitable trust ownership, foundation control, locked bylaws, audited profit-routing, or similar structures.
Advantage. Stakeholders often prefer charitable profit destination at parity, with response across consumer (§1.1), employee (§1.2), supplier (§1.3), media (§1.4), lender (§1.5), and institutional-buyer (§1.6) channels. The advantage activates when the claim is visible, trusted, and actionable at the point of decision.
How it scales. Stakeholder preference at parity becomes competitive advantage; competitive advantage produces improved financial performance; improved financial performance scales charitable yield per dollar deployed and makes PFG businesses underwriteable by credit markets that price cash-flow stability, collateral, repayment capacity, and governance risk rather than mission alignment. The relevant capital pool expands beyond philanthropic capacity into mission-aligned and conventional credit.
Two bottlenecks.
Capital is stuck because no recognized charitable-capital deployment category exists. Allocators have no audited proof object and no social proof — no measured acquisition cohort, no peer-backed case histories, no lender-readable record, no examples a foundation CIO or credit committee can point to internally.
Stakeholder preference is stuck because no choice infrastructure exists. The claim is not yet visible, trusted, or easy to act on at the point of decision.
Two coordinated projects.
Project COA / proof portfolio buys mature, profitable, managerially transferable businesses; routes profits to charity; preserves operations; produces audited, publishable, credit-readable evidence and visible case histories.
Stakeholder-agency infrastructure — verification, registry, audited disclosure, certification, awareness campaigns, trusted messengers, platform/procurement integrations, and the empowerment narrative that gives stakeholders agency to act — makes PFG known, understood, trusted, and actionable.
The proof object unlocks capital. The choice infrastructure unlocks preference. Together they create the loop from first acquisitions to category scaling.
Key terms
PFG (Profit for Good). A business whose ownership structure permanently routes residual profit-rights to charitable purposes through credible, durable mechanisms — charitable trust ownership, foundation control, locked bylaws, audited profit-routing, or similar mechanisms.
PFG90+. A high-commitment deployment configuration in which at least 90% of residual profit-rights are committed to charitable purposes. The primary reference case because high concentration improves signal clarity and charitable yield. Lower commitment levels operate along a continuous gradient.
Charitable Ownership Advantage (COA). The thesis that businesses with charitable residual ownership can outperform conventional competitors, because stakeholders prefer charitable profit destination at parity, with realized advantage depending on awareness, trust, and execution.
Strong COA. The claim that charitable ownership would improve performance across most of the operating economy. The main exceptions are contexts where concentrated private equity upside is part of the production function — startups, very small founder-dependent businesses, turnaround situations requiring intensive owner-operator control, and similar cases. The reasoning: the conditions under which COA operates (stakeholders care where profits go; the ownership claim is legible and trusted; the business can compete at parity; and ownership can change without disrupting operations) hold across most mature businesses, where ownership and operations are already separated. Three positions on the gradient:
Weak COA — COA produces meaningful advantage in some segments, but not across most mature businesses.
Strong COA — COA produces systematic advantage across most mature businesses where ownership and operations are already separable. The body's default.
Super-Strong COA — COA also produces advantage in startup or founder-dependent contexts where concentrated private equity upside is usually part of the production function. A further testable extension, not a prerequisite for the acquisition strategy this report recommends.
Strong COA describes scope, not magnitude. Sector, infrastructure, and execution affect size and speed more than the underlying direction of the mechanism.
Parity / no charity surcharge. PFG businesses must offer comparable or better value on the terms stakeholders actually compare: price, quality, convenience, reliability, compensation, and credit risk. The mission is not financed by asking stakeholders to accept a worse deal.
Residual profit-rights. The economic rights that normally belong to owners after wages, operating costs, taxes, reinvestment, working capital, debt service, and prudential reserves — including distributions, retained equity value, and terminal value. PFG locks these to charitable purposes; conventional ownership routes them to private shareholders.
Distributable profits / distributions. Cash available for charitable distribution after competitive reinvestment, taxes, working capital needs, debt service, and prudential buffers. "Profits to charity" does not mean gross revenue or starving growth; reinvestment grows the charitable owner's asset.
Pa × A × T. The activation framework — preference at parity (Pa), awareness (A), and trust (T) — through which stakeholder preference becomes economically operative. Realized COA depends on all three.
Total Charitable Value (TCV). The financial-modeling comparator: cumulative charitable distributions plus ending equity value over a defined horizon, comparable to grants-plus-ending-corpus for conventional foundation deployment.
Proof portfolio. The acquisition-led program: disciplined purchase of mature, profitable, managerially transferable businesses, with pre-registered measurement, audited charitable distribution, and published before-and-after evidence.
Stakeholder-agency infrastructure / choice infrastructure. Verification, registry, audited disclosure, certification, trusted messengers, awareness campaigns, platform and procurement integrations, shared category language, and the empowerment narrative that lets stakeholders see, trust, and act on charitable-ownership preferences.
1. Headline findings and action agenda
1. Stakeholders prefer charitable profit destination at parity (§§1.1–1.6). The evidence shows positive directional preference across consumer (§1.1), employee (§1.2), supplier (§1.3), lender (§1.5), institutional-buyer (§1.6), and earned-media (§1.4) channels. Revealed-preference field experiments produce roughly 5–20% consumer sales lift at parity (§1.1). Nonprofit-vs-for-profit longitudinal data shows 4–7% wage flexibility for mission-aligned work, alongside roughly halved turnover and ~3% productivity gains (§1.2). The lender channel has direct external corroboration: Buchanan & Kaya (2024) finds approximately 36% lower estimated default probability and ~7 bps lower spreads for foundation-controlled firms across 411 publicly listed firms (§1.5) — mechanism evidence rather than a direct PFG90+ estimate, but useful as a credit-market anchor that patient mission-linked ownership is compatible with lower credit risk, not higher. The case does not ride on this single result; it rides on the full six-channel stakeholder evidence plus the ownership-layer mechanism. Supplier (§1.3), institutional-buyer (§1.6), and earned-media (§1.4) channels rely more on analog and exemplar evidence. Direction is consistent across channels; magnitude varies by channel and context.
2. PFG is an ownership-layer mechanism, not an operations-layer concession (§4). PFG unbundles three things often treated as one: operations (products, pricing, hiring, sales, procurement, execution); governance services (boards, operator selection, covenants, performance compensation, reporting, professional management); and residual profit-rights (the surplus after costs, reinvestment, taxes, debt service, and reserves). Active owners can add governance value, and private equity and founder-operators often do. The narrower claim is that governance value is a service that can be supplied through boards, operator selection, covenants, reporting, incentives, and performance compensation without allowing private investors to keep the residual surplus. The charitable commitment sits in residual profit-rights, not in operational concessions, so PFG avoids the cost penalty that has constrained Fair Trade, B Corp, and other ethical-business models to niche shares. PFG preserves capitalist operating discipline while changing the destination of capitalist surplus.
Exhibit 1. The Parity Principle.PFG places the charitable commitment at the ownership layer rather than the operations layer. Ethical-business models that require operational tradeoffs cap at the cost ceiling; parity attributes can mainstream.
3. Existing exemplars show two distinct things — compatibility and activation (§2). Foundation-controlled industrial firms across Europe — Bosch, Carlsberg, Novo Nordisk, others — have shown for generations that charitable or foundation-linked ownership can coexist with world-class operations. Activated PFG exemplars — Newman's Own ($600M+ since 1982), Humanitix (A$20M+ as of 2026 with 40–45% lower platform fees passed through to users), Patagonia, Thankyou (A$19M+ since 2008), Impact Makers — show directionally consistent stakeholder-response signals when the profit-destination story is visible. These are analytically distinct evidentiary functions: industrial foundations test operational compatibility; activated exemplars show preference-to-business translation. The proof points exist at the company level. What does not yet exist is portfolio-level evidence under disciplined acquisition with pre-registered measurement, which is what the proof portfolio is designed to produce.
4. Activation depends on awareness, trust, and availability — not just preference (§§5, 7). Realized PFG advantage = preference at parity × awareness × trust. Today's stakeholder-response signals are floor evidence, measured before PFG has a shared mark, standardized tracking, category awareness, or mature discovery infrastructure. Earlier PFG or adjacent efforts that failed to scale are not clean evidence against COA unless they offered parity, visibility, comprehension, and trust simultaneously. Under Pa × A × T, weak activation conditions predict weak realized advantage. Individual companies can solve all three at the company level by direct communication; population-scale activation requires the category-level infrastructure the second project builds.
5. High concentration matters twice — for charitable yield and for preference intensity (§6). Definitionally, a 90% commitment routes nine times the charitable distribution per dollar of profit as a 10% commitment. That same 9× factor is also the per-engagement intensity multiplier: each consumer purchase, employee decision, or supplier relationship at a 90% PFG produces nine times the charitable impact of the same engagement at a 10% commitment, which gives stakeholders a stronger reason to prefer high-concentration commitments. The empirical evidence on donation magnitude supports this — larger credible commitments produce stronger response, and verified ownership structure addresses the skepticism that flattens response curves under unverified claims. Higher concentration produces both higher per-dollar charitable yield and higher per-engagement preference intensity, so PFG90+ is the primary deployment reference case for both reasons. Lower commitment levels operate along a continuous gradient.
Exhibit 2 — Concentration matters twice. Panel A (top): stakeholder preference response is concave-rising under verified credibility, with diminishing marginal returns but a positive gradient across the analog range. Panel B (bottom): charitable dollar share is linear by definition — each $100 of distributable profit sends $90 to charity at 90% concentration versus $10 at 10%.
6. The serious objections decompose into four falsifiable links (§8). (1) Preference at parity exists. (2) Ownership-layer commitment without operational degradation is feasible. (3) Visible and trusted preference translates into business outcomes. (4) Net economics remain material after costs, channel overlap, tax treatment, and leakage. All four are well-supported at the mechanism level; what Phase 1 measures is realized magnitude under disciplined deployment. A serious skeptic must identify which link breaks, under what conditions, and why the proof portfolio would not detect it.
7. The financial model is a staged option structure (§9B). Total Charitable Value compares cumulative charitable distributions plus ending equity value against conventional foundation deployment of the same capital (grants plus ending corpus).
1.19× no-activation floor — modeled lower-middle-market operating-company deployment economics before COA activation, not COA evidence; even after the 35% Phase 1a platform-cost loading, owning operating businesses produces higher expected returns than passive corpus deployment, in exchange for illiquidity
1.7×–3.7× activated range — the conservative activated-scenario range if measurable COA activation appears, spanning Modest, Substantial, and Pronounced scenarios
5.4×–7.8× compounded favorable — if multiple favorable conditions compound: both projects scaling, qualifying jurisdiction tax treatment, terminal-exit infrastructure, catalytic-capital access
0.78× compounded adverse — separate falsification stress test, not part of the pathway; stacks four unfavorable conditions simultaneously (high platform costs, no activation, non-qualifying jurisdiction, compressed terminal exit)
Exhibit 4 — Total Charitable Value scenarios. The staged option structure: floor (1.19×), activated range (1.7×–3.7×), and compounded favorable case (5.4×–7.8×) shown as a developmental sequence; compounded adverse (0.78×) shown as a separate falsification stress test. Cumulative cash distributions Years 1–10 plus Year 10 residual operating-company value at 5× EBITDA.
These are scenario outputs, not probability-weighted forecasts. The structure of the test is what the §9B model is designed to make legible. The downside is asset-backed: the no-activation case (1.19×) is positive against conventional foundation deployment, and even the compounded adverse stress test (0.78×) preserves operating-asset value with cash flows and equity intact, well short of grant-like loss. Information value is unconditional: Phase 1 produces decision-grade evidence on each COA link regardless of activation outcome. The upside is potentially economy-scale: if Strong COA holds at meaningful magnitude, the relevant capital pool expands by orders of magnitude beyond philanthropic capacity through credit-market re-pricing of the category. The closer the actual downside is examined, the harder the failure to test becomes to defend.
Total Charitable Value is the primary metric, not IRR or annual payout yield. The §9B model is intentionally conservative illustrative scenario analysis; deal-specific underwriting belongs in Project COA diligence materials.
8. The action agenda is two coordinated projects (§10). Project COA / proof portfolio activates capital for PFG: it buys mature, profitable, managerially transferable businesses; routes profits to charity; preserves operations; and produces audited, publishable, credit-readable evidence that converts thesis into a recognized charitable-capital deployment category. Stakeholder-agency infrastructure activates preference: verification, registry, audited disclosure, certification, awareness campaigns, trusted messengers, platform/procurement integrations, and stakeholder-empowerment messaging that explains the agency being offered — that ordinary economic choices can route surplus to charity when PFG claims are visible and trusted.
From first acquisitions to category scaling
Stage
Phase / Timeframe
What is created
What it unlocks
First acquisitions
Phase 1a / Year 1
Audited PFG operating businesses
Evidence and case studies
Published results
Phase 1a / Years 1–2
Before/after stakeholder, financial, and credit data
Foundation, DAF, lender, seller, and operator confidence
Follow-on capital
Phase 1b / Years 2–4
More acquisitions and conversions
More PFG availability
Stakeholder infrastructure
Phase 1b / Years 2–4
Awareness, trust, decision-point integration
Customer, employee, supplier, lender, procurement, and media response
Improved performance
Phase 2 / Years 4+
Stronger cash flow, lower risk, higher charitable value
Credit re-pricing and lower dependence on philanthropic equity
Category scaling
Phase 2 / Years 5+
Repeatable acquisition model
Shift from donor sacrifice to financeable deployment
Years are illustrative pacing, not committed milestones. Strong early evidence can compress the timeline; weak early evidence may extend it. The sequence is what is load-bearing, not the calendar.
The first acquisitions are not the scale event. They are the proof object that lets each actor move for its own reasons: foundations for higher charitable output per dollar, impact investors for mission-aligned deployment, sellers for mission-aligned succession, operators for category credibility, and lenders for sound cash-flowing borrowers.
The strategic asymmetry
Conventional investors can benefit from brand, ESG, reputation, and ordinary prosocial preferences. They cannot fully enlist the preference for charitable profit destination while retaining private residual upside. Philanthropic owners can. Investors compete against this stakeholder preference; philanthropy can compete with it (§10).
This is why the relevant ceiling is larger than a niche ethical-business category. The body's default mechanism-level prediction — Strong COA — is that charitable ownership would improve performance across most of the operating economy, with the exception of contexts where concentrated private equity upside is part of the production function. If that prediction is correct, then any sector where stakeholder preference is relevant, ownership identity is legible, and ownership can change without operational disruption is a candidate for charitable ownership. The pattern already exists at multi-hundred-billion-dollar scale: Bosch as a foundation-controlled global engineering leader; the Danish industrial foundations at roughly 40% of listed market capitalization; Tata Sons at $328B+ across 26 listed companies. Phase 1 measures where the realized magnitude lands across the qualifying universe.
The mechanism scales because competitive advantage at parity translates into improved financial performance, and improved financial performance unlocks the financing required to expand the category. Stronger margins, lower default risk, and more stable cash flows scale charitable distribution per dollar of philanthropic capital and make PFG businesses underwriteable by commercial credit markets that price cash-flow stability, collateral, repayment capacity, and governance risk rather than mission alignment. As proof accumulates, pooled PFG acquisition and expansion debt becomes a way for conventional capital to finance the spread of charitable ownership without receiving equity or weakening the mission lock. Return-seeking capital participates through credit rather than residual ownership; philanthropy no longer has to fund each acquisition directly.
This is the loop that creates category scaling. First acquisitions produce audited operating businesses; published proof unlocks foundation, lender, seller, and operator confidence; lower per-acquisition philanthropic-equity requirements broaden funder participation; broader participation accelerates more acquisitions; more acquisitions produce more proof; credit markets re-price further. The relevant capital pool expands beyond charitable donations into much larger pools of mission-aligned and conventional credit — including ~$3.5T in global private credit AUM, ~$2.8T in US bank C&I lending, foundation corpus, DAF balances, and the broader acquisition universe. The binding constraint shifts from donor sacrifice toward financeable deployment.
2. What we know, what we are testing, what would change our mind
What is well-supported
Stakeholder preferences for charitable profit destination at parity exist directionally across six channels — consumer, employee, supplier, lender, institutional-buyer, and earned-media / market-response (§§1.1–1.6). The lender channel has external business-performance corroboration in Buchanan & Kaya 2024 (§1.5); consumer and employee channels have field-experimental evidence (§§1.1, 1.2); supplier, institutional-buyer, and earned-media channels rely on analog and exemplar evidence (§§1.3, 1.4, 1.6).
PFG avoids the operations-layer cost penalty that has bounded Fair Trade, B Corp, organic, and other ethical-business models to niche shares (§4). The prosocial commitment lives at the ownership layer, not in operational concessions.
Charitable and foundation-linked ownership does not inherently degrade operations (§2). Industrial foundations across Europe have operated successfully for generations under charitable or foundation-linked ownership while competing in mainstream global markets. Ownership and operations are separable in the target deployment context: the vast majority of the mature economy already separates residual ownership from both day-to-day management and active governance — Vanguard, BlackRock, and State Street holding leading stakes across much of the S&P 500 without operational involvement, CEOs of widely-held public firms typically holding equity stakes of a few percent or less, tens of trillions of dollars of profit-rights held by passive shareholders supplying no day-to-day operating management or active governance, and limited partners in private-equity, venture, and credit funds receiving residual profit-rights without running portfolio companies. PFG is making operating use of a separation that already exists.
Visibility and trust are necessary activation conditions (§§5, 7). The Pa × A × T framework is well-supported as a structural decomposition. Today's effects are floor evidence; realized magnitudes can grow as awareness and trust mature.
Higher concentration improves charitable yield definitionally and strengthens stakeholder response empirically through both the credibility-of-signal and per-engagement-intensity arguments (§6). PFG90+ as a deployment configuration carries both effects.
For the acquisition profile Project COA targets — mature, profitable continuity businesses with stable cash flows, repeat customers, supportive sellers, and operational continuity — the credit case can compare favorably to many lower-middle-market acquisition financings (§§1.5, 9A). Continuity acquisitions of established, well-managed businesses avoid integration, founder-transition, and growth-execution risks that complicate other LMM credit underwriting.
The mechanism is specific, supported, and falsifiable. Magnitude remains the object of the test.
What remains empirical
The realized magnitude of COA in instrumented PFG90+ deployment is genuinely unknown. So is the relative dominance of channels — whether consumer, talent, supplier, capital, procurement, or earned-media response will carry most of the wedge in any given sector. So is the actual overlap between channels (the modeled overlap haircut is a calibration choice, not a measurement). So is the speed of activation under instrumented conditions, and the pace of conventional credit recognition as Phase 1 evidence accumulates.
The 1.7×–3.7× TCV range (§9B) is a modeling output under doubly-conservative assumptions, not a portfolio result. Actual portfolio outcomes could land below the range, within it, or above it. The compounded favorable case (5.4×–7.8×) is an upper-bound anchor where conditions align, not a forecast.
Strong Phase 1 evidence will move rational allocators because it speaks to their existing incentives — foundations seek more charitable output per dollar; lenders seek stable borrowers with underwriteable cash flows; sellers seek mission-aligned succession; operators seek category credibility. The empirical question is not whether strong evidence creates incentives to respond; it is the threshold, sequence, and speed of institutional adoption. Institutional inertia, peer-effect dynamics, media coverage, and the maturation of complementary ecosystem actors all affect tempo, not direction.
What would update the thesis
The four-link decomposition (§8) specifies the failure modes.
Link
What failure would mean
Likely update
Preference at parity
No stakeholder response under parity + visibility + trust
Mechanism-level update to thesis
Operational separability
Converted firms degrade versus conventional-acquisition controls
Acquisition / governance / model constraint
Preference → outcomes
Stakeholders prefer but do not act at the point of decision
Infrastructure or salience problem; updates toward Project 2 weight, not falsification
Net economics
Effects exist but are too small / costly / overlapping
Sector, cost, or scaling constraint
Link 1 — preference at parity. The strongest of the four links. The starting question can be answered directly: given two equivalent options at the same price and quality, would you prefer your purchase to enrich anonymous shareholders or to fund charitable purposes? Given two equivalent jobs, would you rather your work generate profits for distant shareholders or for charity? The answers are consistent across stakeholder classes. The body's evidence across six channels (§§1.1–1.6) confirms the preference quantitatively. For Link 1 to fail at scale would require humans to be genuinely indifferent to whether their economic activity helps people or merely enriches anonymous shareholders when the choice is otherwise costless — a substantial revision of how stakeholders value their economic activity at parity, not a fine-grained empirical question. The compilation's question is not whether the preference exists; it is the realized magnitude under disciplined deployment.
Link 2 — operational separability. Also virtually certain. The modern economy already operates with profit-rights routinely separated from day-to-day management — public-company shareholders, index funds, pensions, family offices, and holding companies receive residual profits without running operations; CEOs of widely-held public firms typically hold equity stakes of a few percent or less; limited partners in private-equity, venture, and credit funds supply capital without running portfolio companies. The question Link 2 actually raises is whether charitable ownership specifically introduces some friction that other forms of separated residual ownership do not. The four-decade Newman's Own record and the multi-generation industrial-foundation record across Europe — Bosch, Carlsberg, Novo Nordisk, and others operating successfully under charitable or foundation-linked control across generations of leadership and competitive cycles (§2) — constitute the natural experiment that answers it. Link 2's failure would require charitable ownership to introduce friction that the rest of the economy's separated-ownership pattern does not produce, and the existing record does not support that.
Link 3 — preference-to-outcome translation. ESG, CSR, B Corp, Fair Trade, and sustainable-sourcing models already prove that stakeholder preferences affect business outcomes; companies do not collectively spend billions on these programs absent any translation from preference to behavior. Those models share a structural feature: they activate stakeholder preference through operations-layer commitments — premium prices, certification overhead, higher input costs, constrained sourcing, discretionary CSR spend. That structure caps adoption at the cost ceiling, which is why these categories often plateau as niches. PFG activates the same family of preferences while preserving parity: the prosocial commitment lives in residual profit-rights, not in operations. Credibility and permanence reinforce the effect — ownership-layer commitments are harder to fake and more newsworthy than revocable operational claims — but the primary distinction is structural, not credibility-based. The Pa × A × T framework formalizes how preference becomes outcome under awareness and trust. The empirical question for Phase 1 is how strongly preference translates under instrumented conditions, which depends on how much awareness and trust the second project generates. A Phase 1 result showing preference-but-no-translation would suggest infrastructure was the binding constraint — in which case the recommendation updates toward heavier weighting of the second project, not falsification of the underlying mechanism.
Link 4 — net economics. The body's channel-by-channel evidence supports Link 4 with substantial margin. §§1.1–1.6 document roughly 5–20% consumer purchase lift at parity, 4–7% wage flexibility plus halved turnover plus ~3% productivity gains in talent, structural trade-credit advantages, ~36% lower default probability and ~7 bps lower spreads in lender pricing, and procurement weighting from 10–20%+ in qualifying jurisdictions. The economic significance of these wedges is amplified by thin-margin leverage: many ordinary businesses operate on net margins in the single digits, where modest channel effects translate into outsized profit effects. A 5-percentage-point revenue lift on a 6% margin business roughly doubles operating profit; a 2-point lift produces a ~33% operating profit increase; a one-point margin improvement on a 5% margin business is a 20% profit increase. Modest realized capture across multiple channels produces wedges that exceed platform overhead by substantial margins. The empirical question for Phase 1 is how much of these channel-by-channel wedges PFG90+ deployment realizes after channel overlap, jurisdictional friction, and terminal-value compression. Phase 1 measurement brackets this directly.
What would falsify or redirect the thesis
The proof portfolio's measurement protocol distinguishes mechanism failure from execution, sequencing, governance, infrastructure, sector-mismatch, channel-overlap, and economics failures. These are different updates. A weak Phase 1 result that reflects mechanism failure (no stakeholder response under disciplined conditions) updates the thesis itself. A weak result that reflects execution failure updates the implementation strategy without falsifying the mechanism. A weak result that reflects channel-cost asymmetry updates sequencing, not direction. Pre-registered diagnostic thresholds determine which update is triggered.
The thesis is falsifiable in specific, measurable ways. That is the discipline that distinguishes serious deployment from advocacy.
3. Recommendations: build the proof object and choice infrastructure
The case does not rest on inventing a new mechanism. The ingredients already exist: operating-company exemplars, foundation-linked ownership at scale, stakeholder preference at parity, and a plausible capital stack. Newman's Own has run for forty years and donated $600M+. Humanitix has operated profitably since 2016 and distributed A$20M+ to highly effective causes. Thankyou has distributed A$19M+ since 2008. What remains under-built is the recognized deployment category.
Two projects
Project 1 — Project COA / proof portfolio. Phase 1 buys mature, profitable, managerially transferable businesses — ordinary commercial acquisition targets — and changes one structural variable: residual profit-rights route to charitable purposes. Operations remain commercially normal. The portfolio measures what changes: stakeholder behavior, cash flow, credit profile, charitable distributions, and enterprise value. Mature transferable businesses are also the cleanest experimental setup — ownership conversion can be tested without confounding from operational changes, founder transitions, or growth-execution risk. Project COA's current underwriting profile targets mature, profitable Australian small/mid-market businesses with stable cash flows, repeat customers, supportive sellers, and operational continuity. At the thesis level, the recommendation is to fund a first proof portfolio. At the implementation level, Project COA is the currently assembled vehicle for that test, subject to ordinary diligence; equivalent vehicles meeting comparable readiness standards could execute the thesis equally well.
The first acquisitions are not the scale event. They are the proof object that lets each actor move for its own reasons: foundations for higher charitable output per dollar, impact investors for mission-aligned deployment, sellers for mission-aligned succession, operators for category credibility, and lenders for sound cash-flowing borrowers.
Project 2 — stakeholder-agency infrastructure. Verification, registry, audited disclosure, certification, awareness campaigns, trusted messengers, platform/procurement integrations, shared category language, and stakeholder-empowerment messaging that explains the agency being offered: ordinary economic choices can route surplus to charity when PFG claims are visible and trusted. Existing organizations such as the Profit for Good Alliance and the 100% for Purpose Club work in this space, though their primary efforts to date have emphasized encouraging existing businesses to donate portions of profits rather than building the verification, awareness, and empowerment infrastructure the choice infrastructure requires. The category needs builders for that broader work — standards bodies, auditors, platforms, procurement systems, researchers, journalists, creators, and public advocates each solving part of the same problem.
The two projects are independent in execution and complementary in effect. Demand pulls supply: choice infrastructure makes PFG firms more valuable, which makes more acquisitions financeable. Supply pulls demand: a visible proof portfolio gives certifiers, platforms, procurement bodies, and media something real to recognize. Capital that supports either supports both.
Capital architecture
For philanthropic dollars, the highest-leverage uses in priority order are:
Project COA's operations — legal architecture, proof design, measurement, governance, and acquisition-pipeline work that makes the proof portfolio possible.
Stakeholder-agency infrastructure organizations working specifically on verification, registry, audited disclosure, awareness, and the empowerment narrative — distinct from campaigns to encourage existing businesses to donate portions of profits.
Acquisition philanthropic equity, where it serves a catalytic role or where catalytic and conventional debt is not yet available.
Acquisition financing can also draw on debt — catalytic and commercial — for the continuity-acquisition profile Project COA targets. The credit case can compare favorably to typical lower-middle-market acquisition financing, especially where conventional alternatives involve heavier leverage, integration risk, founder-transition risk, or growth-execution risk. Buchanan & Kaya 2024 (§1.5) supports the credit thesis: foundation-controlled firms appear compatible with lower credit risk, not higher. Commercial-rate debt is catalytic when it funds the early COA proof — the validating role is what makes it category-building, not the rate. Australian Division 50 qualifying tax treatment (§9B) is a legal/tax floor enhancer and early-laboratory advantage, not stakeholder-activation evidence.
Best-fit roles by funder type
Funder type
Highest-leverage move
Donors aligned with evidence-based charity (including effective-altruism-aligned funders)
Fund Project COA's operations, the highest-leverage philanthropic use; or fund stakeholder-agency infrastructure organizations doing verification, registry, audited disclosure, awareness, and empowerment work
Foundations with corpus
Allocate a corpus tranche through catalytic debt or program-related investment for acquisitions, treating PFG as a recognized charitable-capital deployment category
Mission-aligned operating funders
Fund choice infrastructure builders working on verification, trust, awareness, and the empowerment narrative — not campaigns that valorize generous founders or businesses
Family offices and HNW donors
Fund Project COA operations; co-invest in early acquisitions; or participate in pooled PFG acquisition debt as the category matures
Institutional allocators
Anchor pooled PFG acquisition and expansion debt tranches at scale once early proof exists
The funder mismatch is part of why the category is under-built. Evidence-based-giving capital often defaults to direct grants when funding Project COA operations or stakeholder-agency infrastructure would compound charitable output more durably; foundation corpora often sit in conventional asset classes when a fraction allocated to PFG acquisition debt would compound charitable output through the category; institutional capital often waits for category recognition that no one is building. Each funder type has a move that is lower-cost than its current default and higher-impact than its current alternatives.
The legal rails exist. The mechanism is corroborated by analog, exemplar, and structural evidence — though not yet directly measured at portfolio scale. What remains missing is disciplined portfolio evidence and shared choice infrastructure. Recognition is a fundable problem (§7; §10).
4. The strategic moment
PFG aligns existing incentives rather than asking actors to override them. The pieces of the mechanism have been visible for decades. The category remains underbuilt because, as the Opening described, the relevant actors were looking through frames that did not capture charitable ownership as a source of business advantage — and the proof portfolio that would make the mechanism legible to capital markets has not yet been built.
The stakes are concrete and enormous. Across global health, extreme-poverty relief, environmental and climate work, and advocacy against factory-farming suffering, many of the world's most cost-effective high-impact charities, advocacy organizations, and policy groups have more high-value work than current funding supports. Corporate surplus that could fund that work currently defaults to private residual owners — while children die of preventable disease, hundreds of millions live in extreme poverty, environmental harms accumulate, and tens of billions of animals suffer in factory farms each year. PFG is the mechanism for changing that routing without asking ordinary stakeholders to sacrifice.
The intuition is straightforward and does not require unanimity: given equivalent options, enough people would rather their purchases, their work, their lending, and their procurement help fund effective causes than enrich anonymous shareholders, and acting on that preference costs them nothing. PFG is the mechanism designed to give people that choice. The proof portfolio is how we find out what they do with it — and it is also the demonstration that other actors (sellers, lenders, operators, foundations, journalists) need to see in order to recognize the category and act. Audited measurement evidence is what allocators need to underwrite. Visible demonstration is what sellers, lenders, operators, and other foundations need to recognize what the category looks like. Both matter, and the proof portfolio produces both.
What makes the test rational is the structure of its outcomes.
The downside is asset-backed and close to neutral. Phase 1 deploys philanthropic equity at proof-portfolio scale into mature, profitable operating businesses with real cash flows. The no-activation case (1.19×) is positive against conventional foundation deployment. Even the §9B compounded adverse stress test (0.78×) — which stacks four unfavorable conditions simultaneously and is more conservative than Project COA's actual underwriting — preserves operating-asset value with cash flows and residual equity intact, well short of grant-like loss.
Information value is unconditional. Phase 1 produces decision-grade evidence on each COA link regardless of activation outcome — preference at parity, operational separability, preference-to-outcome translation, net economics. No amount of additional abstract argument can produce that evidence.
The upside is potentially economy-scale. If Strong COA holds at meaningful magnitude, the implication is not merely better returns for a proof portfolio; it is that charitable ownership has been structurally underpriced by philanthropy, credit markets, and business sellers. The addressable financing universe expands from donor capacity toward much larger mission-aligned and conventional credit pools, and the relevant ceiling becomes the operating economy itself wherever stakeholder preference is relevant and ownership and operations are separable.
The closer the actual downside is examined, the harder the failure to test becomes to defend. What cannot be justified is the continued failure to measure charitable ownership's effect on business performance.
Funders who want to participate before the first acquisitions close can fund Project COA's operations directly — the legal, measurement, governance, and acquisition-pipeline work — and engage Project COA about specific acquisition opportunities as they develop. The capital is identifiable. The structures are ready enough to test. The proof portfolio measures how far the mechanism reaches and demonstrates what the category looks like; the choice infrastructure lets the market act on it. What remains is for funders to build the proof portfolio and choice infrastructure that give people the choice.
Acknowledgment. Source review and claim-checking on earlier drafts: Evan White (University of Chicago). The author thanks him for catches that materially improved v2.1; remaining errors are the author's.
Section-by-Section Synthesis
The case above stands on the full research compilation. The synthesis below helps readers locate the body sections that develop each claim. Each entry names what the section asks, what it establishes, what evidence class supports it, and what deployment implication follows. Read these in any order, treat them as a verification trail when checking specific claims, or skip them and rely on the case above.
§1.1 — Consumer Preferences
Do consumers act on charitable or prosocial signals at price parity?
Field, natural-experiment, and difference-in-differences evidence shows roughly 5–20% purchase lift for credible charity-linked or prosocial signals at parity. The strongest anchors are Elfenbein, Fisman & McManus (2012) on eBay charity-linked listings; Hainmueller, Hiscox & Sequeira (2015) on Fair Trade coffee at equal price (~10% lift); McManus & Bennet (2011) on a donation-linked online field experiment (~20% more revenue per visitor, ~50% higher repurchase); and Proserpio et al. (2025) on Amazon Climate Pledge Friendly badging (~12.5% sales lift across ~45,000 products). Most studies test cause-marketing, certification, or prosocial product signals rather than permanent ownership-layer profit commitment, so §1.1 treats them as conservative analog evidence for PFG90+, which removes the price-fairness drag that constrained Fair Trade and adds verification permanence revocable CSR cannot match. For PFG specifically, the 5–20% range is a conservative analog baseline, not a direct category-wide estimate. Current observed effects are a floor; awareness-driven headroom is empirical.
Evidence: revealed behavior plus conservative analog. Deployment: test consumer channels where the ownership claim can be made visible, trusted, and offered without a charity surcharge.
§1.2 — Employee Preferences
Do mission-driven ownership structures generate measurable human-capital advantages?
Mission-driven organizations and prosocial job signals show systematic talent advantages: roughly 25% more applicants and ~36% wage-equivalent attraction in Hedblom, Hickman, and List 2019, with 44% lower wage bids in Burbano 2016 microtask experiments, while paying an average of 4–7% below market (Macpherson, Hirsch, and Even 2024, 42,000+ workers in longitudinal BLS data). Turnover is roughly halved in organizational evidence (e.g., 16–20% to ~8% in UK B Corps), and quasi-experimental productivity gains run ~3%. For a 500-person firm, the modeled combined advantage is $3.59–$4.39M annually, ≈12.0–14.6% of payroll. Talent advantages activate immediately through self-selection and compound through alumni and reputation effects rather than depending on broad consumer awareness. Most evidence is from B Corps (typically 10–20% commitment); inference to PFG90+ is directional and should be tested directly.
Evidence: documented experimental and observational, modeled aggregate. Deployment: prioritize sectors where talent is scarce, mission is salient, and retention matters; treat early acquisitions as opportunities to measure PFG90+ effects directly against B Corp baselines.
§1.3 — Supplier and Partner Preferences
Do suppliers and partners offer structural advantages to mission-driven firms?
Supplier preference is structure-sensitive, and in this channel it is often contractualized rather than merely attitudinal. The strongest evidence is peer-reviewed finance research on trade credit: suppliers extend more trade credit, or otherwise more favorable trade-credit treatment, to socially responsible and philanthropically active customers, with effects concentrated where information asymmetries and supplier risk are highest. Charity-structured PFGs — exemplified by Humanitix, registered as a charity in each operating market — can qualify directly for substantial portions of the nonprofit supplier stack: software grants, professional-services pro bono, and preferential vendor terms. Commercially structured PFGs access a narrower but still meaningful set via B Corp peer networks, social-enterprise pro bono channels, and mission-aligned vendors. §1.3 models roughly $100,000 in annual operational advantages for an eligible, actively managed 40-person SaaS PFG, roughly 2.5–3% of a $3.5–4M operating budget, with realized value varying materially by legal structure and category mix. Most institutional programs require formal charitable registration; broad applicability of 501(c)(3) status to PFG business models remains an open legal question.
Evidence: peer-reviewed trade-credit finance research, published program terms, exemplar utilization, and modeled aggregation. Deployment: choose legal structures that capture the relevant supplier stack; track contractualized advantages — trade credit, program eligibility, pro bono, and vendor terms — separately from goodwill effects.
§1.4 — Media and Marketing Advantages
Does PFG structure produce systematic earned-media and word-of-mouth advantages?
Durable ownership commitments create newsworthy, hard-to-fake stories that paid campaigns cannot buy. Three documented cases anchor the evidence: Thankyou's "No Small Plan" campaign generated 825+ media features across 36 countries and 2.6 billion campaign impressions, vendor-reported; Patagonia's September 2022 ownership transfer produced global news coverage on the day of announcement, with 42% of aware U.S. adults reporting increased purchase likelihood (stated intent, not revealed behavior, no post-announcement sales data released); and Newman's Own provides the durability proof — forty-plus years of mainstream retail presence while generating $600M+ for charitable purposes. Adjacent research explains why this matters: word-of-mouth and trusted earned attention are substantially more persuasive than paid media, and durable ownership commitments are structurally more credible and newsworthy than ordinary promotional claims. The mechanism is structural credibility: commitments expensive to fake become stories worth telling, and editors treat ownership transfers as hard news rather than advertising. Headline impression metrics establish exposure scale, not ROI; precise marketing-efficiency advantages remain unmeasured.
Evidence: case-based exemplar evidence with vendor-reported reach metrics, stated-intent response, and adjacent word-of-mouth and trust research. Deployment: use ownership conversion and permanent profit-routing as durable narrative assets; measure earned media, organic traffic, conversion, and CAC directly; do not assume earned-media impressions equal CAC savings or stated intent equals revealed conversion.
§1.5 — Capital Provider Preferences
When do PFG companies access more favorable capital stacks than conventional competitors?
PFG's capital advantage is primarily a capital-stack advantage, not a sentiment discount. Where mission-lock and charitable-purpose fit are credible, PFGs can blend catalytic capital — foundation Program-Related Investments at 0–3%, impact debt at 3–6%, guarantees, first-loss support, and mission-aligned credit lines — with mission-bank concessions of roughly 0–50 bps. In favorable cases, that blend can produce a cost of capital 180–300 bps below conventional rates; in the illustrative $10M stack modeled in §1.5, the annual saving is roughly $185,000. Without catalytic access, expect only the mission-bank floor. Buchanan & Kaya (2024) find approximately 36% lower estimated default probability and ~7 bps lower spreads for foundation-owned firms across 411 publicly listed firms — mechanism evidence that patient ownership can reduce agency risk, not a direct estimate for PFG90+ borrowers. The trade-off is explicit: forgoing conventional equity preserves the charitable lock but shifts growth financing toward retained earnings, debt, guarantees, catalytic equity, and mission-aligned capital. For capital-efficient business models, the debt advantage can offset the equity constraint.
Evidence: documented program terms (catalytic), published bank schedules (market), peer-reviewed foundation-ownership credit data (analog), and modeled capital-stack aggregation. Deployment: build capital stacks around catalytic layers — PRIs, guarantees, first-loss support, mission debt — plus mission-bank concessions; do not rely on automatic senior-bank discounts; treat capital efficiency and equity constraints as sector-selection criteria.
§1.6 — Other Stakeholder Preferences (B2B, Government, Community)
Do institutional buyers, public-sector procurers, and host communities favor credible mission-driven firms when commercial terms are comparable?
Selection and retention advantages appear at parity price, not through large premiums. Often the mechanism is risk reduction rather than moral approval: buyers use social-value criteria to avoid reputational exposure, non-compliance, implementation risk, and stakeholder backlash. UK central-government procurement under PPN 002 mandates a minimum 10% social-value weighting; several UK local authorities apply 20%+ weightings. U.S. federal agencies awarded a record $78.1B to Small Disadvantaged Businesses in FY2024, but SDB status requires demographic ownership criteria that foundation-owned PFGs typically cannot satisfy. On community licence, 74.5% of housing developers report opposition adding 7.4 months and 5.6% to project costs; PFG structures may mitigate this by providing a credible answer to "who benefits?" — theoretically plausible, empirically untested. PFG is a stackable credibility layer where procurement systems value durable, auditable, ownership-based social benefit at parity, not a substitute for operational ESG attributes or demographic ownership criteria. Most direct evidence covers social enterprises, B Corps, and diverse suppliers; PFG inference is structural, not directly measured.
Evidence: documented government policies and contract awards, procurement studies, supplier-diversity reports, and survey-based community-opposition data. Deployment: use PFG as a stackable credibility layer in B2B, public-sector, and community-sensitive contexts; pursue recognized certifications and contract-specific social-value commitments where required; do not treat PFG as a substitute for demographic ownership or operational ESG criteria.
§2.0 — Direct PFG Evidence
What do existing PFG, industrial-foundation, and foundation-/trust-linked firms show about operational compatibility and stakeholder activation?
§2 carries two analytically distinct bodies of evidence. Compatibility evidence from industrial foundations and foundation-/trust-linked firms — Bosch, Carlsberg, Novo Nordisk, Hempel, Associated British Foods, and Tata — defeats the simple agency-theory prediction that charitable or foundation-linked control inherently handicaps firms: the record shows world-class operations across R&D intensity, operating performance, durability, and market position, sustained across generations. Activation evidence from exemplars that foreground the profit-destination story — Patagonia, Humanitix, Thankyou, Newman's Own, Impact Makers, and Ecosia — shows directionally consistent stakeholder response: Patagonia's 365% job-search surge on its September 2022 ownership announcement; Humanitix's mission-driven organic customer acquisition alongside 40–45% lower platform fees passed through to users; Impact Makers' low-single-digit voluntary turnover across a decade against a 15–20% professional-services norm; Newman's Own's forty-plus years of mainstream retail competition while foregrounding its 100%-profits-to-charity identity and generating $600M+ for charity; and Thankyou's vendor-reported 2.6 billion earned-media impressions. The first is a falsification test of a governance-handicap prediction; the second is an observational record of activation signals. What remains missing is measured portfolio-scale magnitude under instrumented acquisition.
Evidence: industrial-foundations natural experiment / compatibility stress test, supplemented by a broader industrial-foundation inventory; activated-exemplar observational record. Sample is small (n=13 PFG exemplars) with survivorship and selection effects acknowledged; adjacent B Corp / CSR comparator evidence is treated as conservative context, not direct PFG90+ measurement. Deployment: treat industrial-foundation evidence as strong compatibility evidence and activated-exemplar evidence as directional confirmation of the activation mechanism; design Phase 1 acquisitions to produce the missing portfolio-scale magnitude evidence under instrumented conditions.
§3.0 — Global Expansion Opportunity
Does the PFG mechanism appear portable beyond Anglosphere markets, and which jurisdictions are most ready for first-wave deployment?
§3 establishes empirical scope across three evidence classes. Preference scope: behavioral evidence and cross-country surveys show that mission-aligned and public-benefit preferences are not Anglosphere-specific. The surveys establish directional breadth, not effect-size magnitude; the more specific preference for charitable profit destination remains to be activated and measured where the profit-destination story is legible and trusted. Ownership-structure scope: foundation-ownership and philanthropic-trust models operate at substantial scale across institutional contexts — roughly 40% of Danish listed market capitalization in the Schroeder dataset; Bosch at roughly 94% foundation-owned; Tata Sons at 66% philanthropic-trust-owned, with 26 listed Tata companies above $328B combined market capitalization as of March 31, 2025. Legal/capital scope: usable legal and capital-market rails exist across most of global GDP — mature in Western Europe, the UK, and North America; workable through general company and trust law in India, Japan, South Africa, Brazil, and other middle-readiness markets.
In high-readiness jurisdictions, binding constraints are executional: profit-lock design, point-of-decision legibility, third-party verification, beneficiary framing, and operator execution.
Evidence: behavioral evidence and cross-country surveys for breadth, not magnitude; peer-reviewed cross-country ownership data (Schroeder) and named exemplar cases; structural documentation of legal vehicles, capital markets, and procurement regimes by jurisdiction. Deployment: treat geography as a deployment-sequencing variable, not a conceptual barrier. Prioritize high-readiness jurisdictions — Western Europe, the UK, North America, and, for Project COA's specific legal/tax architecture, Australia.
§4.0 — Charitable Ownership Advantage: Parity, Redeployability, and Deployment as Strategic Choice
Why can the same business be worth more under charitable ownership than under conventional investor ownership?
Parity means the mission is not financed by asking stakeholders to accept worse value: no charity surcharge, no lower quality, no structural operating handicap. Ethical-business models that require premiums or operating tradeoffs often remain niche — organic food at ~6% of U.S. food dollars, Fairtrade coffee at ~5.4% of global production — while parity attributes can mainstream, as with generics at ~90% of U.S. prescriptions and dolphin-safe tuna above 90% of the global industry. PFG places the charitable commitment in ownership, not operations, so the structure itself does not create the cost penalty that caps predecessor models. Given the stakeholder preferences documented in §1, the operational-compatibility evidence in §2, and the global feasibility established in §3, the result is the Charitable Ownership Advantage: the same business can be worth more under charitable ownership because the residual profit destination itself becomes a stakeholder-valued attribute. Those advantages are redeployable — banked as charitable flow, passed through as lower prices, better value, or larger reinvestment, or combined. Deployment is a strategic choice, not a structural constraint. Because mature professionally managed firms already separate ownership from operations — Vanguard, BlackRock, and State Street collectively hold large stakes across much of the S&P 500 without operational involvement, CEOs of widely-held public firms typically hold equity stakes of a few percent or less, limited partners in private-equity and credit funds receive residual profit-rights without running portfolio companies — §9A targets mature acquisitions where ownership conversion can be tested cleanly.
Evidence: cross-category market-penetration evidence; structural synthesis from §§1–3; redeployability illustrated by Newman's Own and Humanitix; ownership/operations separability supported by modern managerial-capitalism practice and industrial-foundation evidence. Deployment: compete at the relevant tier with no charity surcharge; treat stakeholder advantages as redeployable across charitable flow, price, quality, reinvestment, and growth; prioritize mature acquisitions where ownership can change without changing operations.
§5.0 — The Awareness–Trust Activation Dynamic
What determines how much latent PFG preference becomes realized business advantage?
Realized PFG advantage = preference at parity × awareness × trust, where parity is the structural capacity §4 establishes. Preference that is unseen or distrusted does not become advantage. Today's documented PFG stakeholder-response signals — from §2's activated exemplars — are activation-floor evidence measured under pre-category awareness, before standardized tracking, a shared certification mark, or mainstream recognition. Historical analogs span the outcome space: premium-burdened ethical categories such as Organic and Fairtrade plateau despite high awareness, while verified, easy-to-recognize categories such as ENERGY STAR, MSC seafood, and Non-GMO show that awareness and trusted verification can convert latent preference into mainstream adoption when price friction is low or absent. ENERGY STAR awareness rose from 56% to 89% while dishwasher share reached 96%; Non-GMO evidence attributes 36% of new-product adoption to awareness. Ownership-signal studies — farmer-owned labels, B Corp-logo experiments, and employee-owned-label studies — show that ownership cues can move behavior, usually only when the profit-destination or ownership meaning is explained. Direction is established by analogs and framework; magnitude is empirical. The trust layer matters because extraordinary claims are discounted by default; without verification, disclosure, and trusted messengers, "profits to charity" is read as marketing rather than as ownership structure. The open question is whether private stakeholder-agency infrastructure (§7) can do for PFG what public-sector or mature certification systems did for older categories.
Evidence: Pa × A × T as analytical framework, not numeric multiplier; program-tracking data, peer-reviewed field and quasi-experimental evidence, and ownership-signal experiments treated as conservative analogs. Deployment: treat current PFG signals as floor evidence, not steady-state forecasts; design Phase 1 deployments to track exposure, comprehension, trust, and behavior separately as awareness and trust rise; do not promise numeric awareness multipliers.
§6.0 — Preference and Charitable Commitment Concentration
How do stakeholder preference and charitable yield respond as charitable commitment concentration rises?
Concentration matters twice. Shape 1 — preference response: concave rising under verified credibility. Across analogous evidence on donation magnitude and tiered ethical commitments, increasing the "amount of good" raises consumer choice share and willingness-to-pay. The response is empirical and conditional: it shows diminishing marginal returns from warm-glow utility, but a positive gradient across the studied analog range. High unverified claims can trigger skepticism that flattens the curve; verified ownership structure can address that skepticism where stakeholders understand and trust what the ownership claim means. Whether marginal response remains commercially meaningful at 80%, 90%, 95%, or 100% is empirically open, but the documented gradient under credibility points toward stronger response at higher concentration. The intensity argument reinforces the empirical case: at 90% PFG, each consumer purchase, employee decision, or supplier relationship produces nine times the charitable impact of the same engagement at 10%, which is a substantive reason for stakeholders to prefer high-concentration commitments. Shape 2 — charitable dollar share: linear by definition. Each $100 of distributable profit sends $90 to charity at 90% concentration versus $10 at 10%; this is definitional and unconditional. Together, the two shapes favor high commitment: larger credible commitments generally produce stronger response, and higher concentration always produces higher charitable-dollar capture. PFG90+ is favored as the high-commitment reference case for new philanthropic deployment because it combines signal clarity, high charitable yield, and reinvestment-first business flexibility; the exact optimum within the high-concentration band remains empirical. Direct response to PFG90+ ownership concentration has not been measured. The proof portfolio (§9A) is the proposed path to producing such evidence at high-concentration ownership levels; §7 addresses how to make those high-concentration claims legible and trusted at the point of decision. Earned media and salience may behave differently from direct preference: "100% to charity" can become a story in a way partial commitments often do not, so media response may show threshold effects rather than a smooth concave curve.
Evidence: donation-magnitude experiments and tiered certification markets provide shape evidence, not direct PFG90+ ownership-concentration estimates; Patagonia provides observational media-threshold evidence. Charitable dollar share is definitional. High-concentration inferences are reasoned from the documented gradient under credibility. Deployment: use PFG90+ as the default high-commitment reference case where legal and incentive design permit; pair concentration with verification and plain-language explanation; design Phase 1 acquisitions to measure stakeholder response at high-concentration ownership levels and where possible compare 80–90%, 90%+, and 100% structures or messaging treatments; treat earned-media benefits as threshold-sensitive rather than smoothly continuous.
§7.0 — Trust and Awareness Infrastructure
What shared infrastructure makes charitable ownership visible, trusted, and actionable at scale?
§7 is about a public good: shared credibility no individual PFG can efficiently build for the whole category. The stakeholder preferences documented in §§1–6 convert to realized advantage only when stakeholders know about PFG and believe specific firms' claims. The infrastructure must do three things: make the category known, make the claim understood and trusted, and make the choice easy at the point of decision — which, for ordinary stakeholders, also means making the agency claim feel real rather than abstract. Without shared infrastructure, each firm may need to spend roughly $150K–$250K annually overcoming the same skepticism; at mature scale, shared verification costing $2.5–$3.5M annually across 800–1,200 firms would imply a per-firm allocation of roughly $2,100–$4,400. These are illustrative scenarios, not forecasts, but they show why credibility pooling is category-level infrastructure rather than overhead. The load-bearing strategic insight is channel-cost asymmetry: institutional channels — procurement, capital diligence, supplier vetting, recruitment — already process structured documentation, while mass consumer markets require simpler marks, trusted messengers, and broader category recognition. This is a sequencing variable, not an anti-consumer doctrine; consumer-facing PFGs may still matter as awareness flywheels. The proof portfolio (§9A) produces the early evidence the choice infrastructure can build on; the choice infrastructure (§7) makes the proof portfolio's findings actionable at the point of decision. The two projects are co-essential. PFG's audit object is narrower and more legal/financial than many supply-chain certifications — ownership lock, profit definition, related-party leakage, reinvestment/distribution rules, and distribution tracking — but not less important. One weak, conflicted, or pay-to-play certifier could damage the whole category.
Evidence: comparator-system evidence from B Lab, Fair Trade, MSC, and other certification systems; consumer trust surveys and experiments; platform-badge and procurement-integration studies; and illustrative PFG infrastructure cost scenarios. Platform-badge evidence is mixed; PFG cost projections are modeled scenarios. Deployment: build shared stakeholder-agency infrastructure — verification, registry, audited disclosure, certification, awareness campaigns, trusted messengers, platform/procurement integrations, and the empowerment narrative — so credibility pools across firms and the claim appears where decisions are made. Sequence by channel-cost asymmetry: start where structured documentation is already processed, while building consumer-facing category recognition over time. Treat PFG's narrower audit object as requiring rigorous standards, not less rigor.
§8.0 — Stress Tests
What would have to be true for COA to fail?
§8 decomposes COA into four falsifiable links. Link 1: stakeholders do not prefer charitable profit destination at parity. Link 2: residual profit-rights cannot be allocated charitably without degrading operations in target deployment contexts. Link 3: stakeholder preference fails to affect business outcomes when visible and trusted. Link 4: net realized wedges are too small, costly, or overlapping to matter economically. Each link is supported in the body: Link 1 by the channel-by-channel evidence in §§1.1–1.6; Link 2 by the operational-compatibility evidence in §2 and the modern economy's general separation of ownership from operations and active governance (§4); Link 3 by §§1.1–1.6's behavioral evidence and the activation framework in §5; Link 4 by the channel wedges in §§1.1–1.6 amplified by thin-margin leverage, plus the financial modeling in §9B. Available evidence does not break those links. Most objections target the wrong model — premium-priced ethical products, gross-revenue donation pledges, charity-run businesses — rather than the ownership-layer profit-rights mechanism COA actually proposes. Serious constraints on realized magnitude — capital formation, awareness/trust activation, governance, operator incentives, channel overlap, competitive response, and the "why hasn't this already happened?" under-exploitation puzzle — become measurable deployment variables, execution standards, or update criteria rather than generic conceptual defeaters. Survival of the four-link test is not proof of magnitude; remaining uncertainties resolve only through instrumented deployment. Stress-test survival is the reason for §9A's proof portfolio, not a substitute for it. The critic must identify which link breaks and why.
Evidence: synthesis, stress-test, and falsification framework drawing on red-teaming, academic foundation-ownership literature, ESG / impact-investing critiques, and competitive-strategy analysis. Foundation-controlled-firm evidence mainly tests the governance-handicap prediction; B Corp, CSR, and certification comparator data mainly corroborate behavioral and activation patterns. Both are mechanism evidence, not direct estimates of magnitude in PFG90+ structures. Deployment: design Phase 1 acquisitions to test each link explicitly; meet §8's execution standards; pre-register falsification and update thresholds that distinguish mechanism failure from execution, sequencing, governance, infrastructure, or economics failures.
§9A — Capital Deployment: The First Proof Portfolio
How should early capital be deployed to create direct evidence for COA?
§9A designs an acquisition-led proof portfolio, not a sector-ranking exercise. Phase 1 creates PFG availability, tests which of §8's four COA links hold, measures which stakeholder channels activate and at what magnitude, and evaluates whether those effects remain economically material after costs, overlap, leakage, and tax. It produces audited, publishable, credit-readable evidence needed to move from philanthropic seed capital to scalable deployment. The target profile is specific: mature, profitable, managerially transferable lower-middle-market businesses with clean pre-conversion baselines, parity at the relevant tier with no charity surcharge, minimum viable visibility/comprehension/trust for the stakeholders being measured, and demonstration legibility for foundation CIOs, commercial-credit underwriters, succession-motivated sellers, and prospective PFG operators. Phase 1 optimizes for evidence value subject to business quality and demonstration legibility, not standalone financial return. Sector selection uses a two-layer map — expected COA density × Phase-1 learnability — rather than a single composite scorecard. Every Phase-1 metric maps to one of §8's four links; a deployment either produces evidence on a link or is explicitly not testing it. The design inherits §§4–7: no-charity-surcharge parity, Pa × A × T activation, PFG90+ as the default high-commitment reference case while preserving design flexibility for 80–90%, 100%, or hybrid structures, and channel-cost sequencing. §9B models the financial trajectory under different activation outcomes; §9A's deployment design and §9B's financial model are co-developed. Phase 1 is supply creation as much as demand testing: every acquisition creates a PFG option that previously did not exist.
Evidence: planned measurement and deployment architecture, not observed portfolio results. Some leading indicators may produce directional evidence within roughly six to twelve months; fuller confidence develops over multiple operating cycles. Deployment: buy mature, profitable, managerially transferable businesses that produce both clean evidence and visible case histories; pre-register four-link evidence design and update rules; track stakeholder exposure, comprehension, trust, operational continuity, and full economics; sequence Phase 1a → 1b → 2 by evidence quality, demonstration legibility, and infrastructure maturation.
§9B — Sector Strategy and Financial Projections
What charitable value could acquisition-led PFG deployment create under different COA activation levels?
§9B compares Total Charitable Value (TCV) — cumulative charitable distributions during a 10-year hold plus ending equity value — against conventional foundation deployment of the same $16.5M capital. Conventional foundation TCV equals grants paid plus ending corpus value; modeled at the 7.3% CoF/Commonfund 10-year private-foundation return with grants from corpus, the baseline produces $29.7M cumulative TCV. The PFG model deploys $16.5M of foundation equity across four lower-middle-market operating-company acquisitions in Australia, using two §9A reference archetypes — commodity-service buy-sell businesses with founder-succession entry and talent-intensive professional services — to keep the financial model tied to the proof-portfolio design. It runs four activation scenarios — No, Modest, Substantial, Pronounced — across two platform-cost cases: 35% Phase 1a loading (small-AUM pre-category infrastructure) and 20% post-demonstration loading (scaled deployment after category evidence exists).
Case
What it represents
TCV multiple vs. conventional
No-activation floor, Phase 1a
LMM deployment-vehicle economics, before separate legal/tax uplift
1.19×
Activated, Phase 1a
Modest / Substantial / Pronounced at 35% loading
1.7×–3.0×
Activated, post-demonstration
Same activation cases at 20% loading
2.1×–3.7×
Compounded favorable
Aligned conditions; without / with qualifying Division 50 treatment
5.4× / 7.2×–7.8×
Compounded adverse (separate stress test)
Stacks four unfavorable conditions simultaneously: 35% platform loading does not improve, no COA activation, non-qualifying tax jurisdiction, compressed terminal exit
0.78×
The 1.19× no-activation floor reflects modeled lower-middle-market operating-company deployment economics before COA activation: even after the 35% Phase 1a platform-cost loading, owning operating businesses produces higher expected returns than passive corpus deployment, in exchange for illiquidity. The 0.78× compounded adverse case is a separate falsification stress test, not part of the staged pathway: each of its four stacked conditions is unlikely on its own; stacking all four simultaneously is the falsification anchor. Even at that stress level, the foundation still owns operating businesses with real cash flows and residual equity value, though business-investment risk remains. In qualifying Australian charitable-purpose structures, Division 50 treatment is modeled as a legal/tax floor enhancer, not COA evidence; where applicable, it adds roughly 33–43% after-tax charitable yield. The compounded favorable case combines 25% platform loading, Pronounced activation, 5% organic growth, qualifying jurisdiction, mature terminal-exit infrastructure, and catalytic-capital access. The 1.7×–3.7× activated range is doubly conservative: it uses low-end channel wedges, and those wedges come from analog evidence that generally tests weaker, less permanent, less ownership-layer signals than PFG90+. The economic significance of these wedges is amplified by thin-margin leverage in the underlying operating businesses (§8 Link 4), which is why even modest realized capture across multiple channels translates into substantive TCV effects.
The §9B model is intentionally conservative illustrative scenario analysis; deal-specific underwriting belongs in Project COA diligence materials. Project COA's actual underwriting is more favorable than §9B's calibration on three dimensions: cost structure substantially below 35% loading, available Australian Division 50 treatment, and specific identified acquisition opportunities.
Evidence: scenario modeling, not observed portfolio results. Inputs inherit §§1–8 evidence and the §9A target profile. Scenarios are option cases, not probability-weighted forecasts. Calibration is intentionally biased downward as a conservative activation translation. TCV, not IRR or annual payout yield, is the primary metric. Deployment: treat 1.7×–3.7× as the conservative activated-scenario range, not a forecast; treat 5.4×–7.8× as conditions-aligned upside, not a target; treat 1.19× as a deployment-vehicle baseline separable from COA mechanism evidence; treat Division 50 as a legal/tax floor enhancer separable from stakeholder activation; and treat the model as decision-grade scenario analysis, not forward projection or Project COA forecast.
§10 — Synthesis and Recommendations
What should be built next?
Charitable ownership is specific enough to test, promising enough to matter, and asset-backed enough that non-experimentation now carries the heavier burden. §§1–9 establish the necessary inputs: stakeholder preferences across six channels (§§1.1–1.6); an ownership-layer mechanism that avoids predecessor cost penalties (§4); compatibility and activation exemplars (§2); global portability (§3); Pa × A × T activation (§5) with infrastructure as the public good that completes it (§7); concentration logic (§6); four-link stress-testing (§8); and §9B's scenario-modeled staged pathway. What no compilation can produce by itself is the disciplined deployment evidence that converts PFG from thesis into a recognized charitable-capital deployment category. The next rational step is two specific, coordinated projects: Project COA / the proof portfolio — first acquisitions of mature, profitable, managerially transferable businesses producing audited before/after evidence, charitable distributions, credit-readable financials, and visible case histories — and stakeholder-agency infrastructure — verification, registry, audited disclosure, certification, awareness campaigns, trusted messengers, platform/procurement integrations, and the empowerment narrative that gives ordinary stakeholders agency. The strategic asymmetry organizes the recommendations: investors compete against this stakeholder preference, and philanthropy can compete with it. PFG does not ask most actors to become more altruistic; it asks whether existing incentives can be routed through structures where ordinary choices send surplus to charity.
Evidence: synthesis and action agenda inheriting §§1–9. Mechanism evidence is established across §§1–8; PFG90+ magnitude evidence is what §9A's proof portfolio is designed to produce; §9B supplies scenario modeling, not observed portfolio results. The case for the two coordinated projects is structural and action-guiding, not predictive. Deployment: fund both projects together. Priority for philanthropic dollars: Project COA operations, then stakeholder-agency infrastructure organizations doing verification/trust/awareness/empowerment work, then acquisition philanthropic equity where catalytic. Acquisitions can also draw on catalytic and commercial debt. Treat continued delay as the position that needs justification.
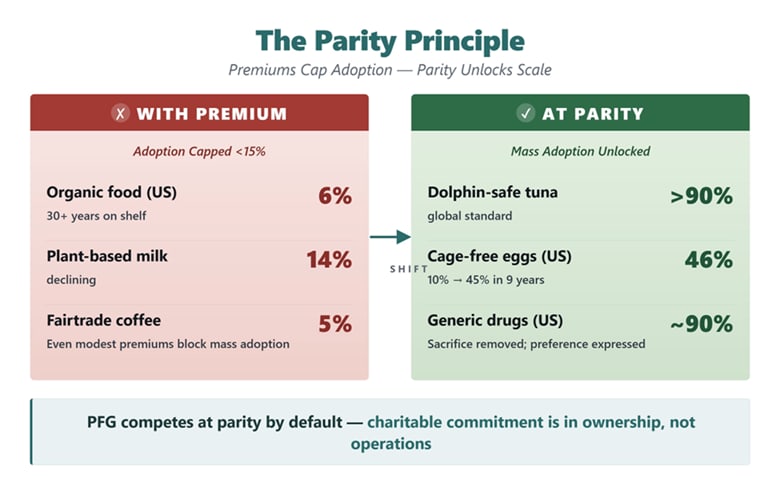
Executive summary: The author argues that businesses whose residual profits are permanently routed to charity can often outperform conventionally owned firms because stakeholders prefer charitable profit destinations at parity, making charitable ownership a potentially scalable and under-tested mechanism for generating social impact.
Key points:
This comment was auto-generated by the EA Forum Team. Feel free to point out issues with this summary by replying to the comment, and contact us if you have feedback.
This is actually a quite apt summary.