Side note. I am looking for work, and welcome suggestions for posts.
Summary
- I think the impact of the vast majority of interventions is driven by effects on wild animals. In particular, by effects from land use change on soil nematodes, mites, and springtails, which are the most abundant terrestrial animals. There are 4.4*10^20 top soil nematodes, and 10^19 soil arthropods, “≈95% of which are soil mites and springtails”.
- I estimate random soil nematodes, mites, and springtails have (expected) welfare ranges (as fractions of that of humans) of 6.47*10^-6, 3.57*10^-5, and 6.17*10^-5, which are 0.324 %, 1.79 %, and 3.09 % of Rethink Priorities’ (RP’s) mainline welfare range of silkworms.
- I calculate soil nematodes, mites, and springtails have (in expectation) a welfare of -4.36*10^-6, -1.57*10^-5, and -2.35*10^-5 QALY/animal-year, and an annual welfare of -296 k, -13.9 k, and -10.4 k times that of humans. The annual welfare of soil nematodes being 12.6 times that of soil arthropods suggests the former have been unfairly dismissed relative to the latter by people who care a lot about wild animal welfare.
- Crops are the biome with the 3rd highest welfare among the 10 I analysed. I infer increasing cropland only decreases welfare if it replaces pasture, or deserts, and xeric shrublands, which are the 2 biomes with a lower density of soil animals than crops.
- My results imply cropland replacing tropical and subtropical grasslands, savannas, and shrublands decreases the living time of soil animals by 1.73 M animal-years per m2-year, and increases their welfare by 7.91 QALY/m2-year, of which 93.1 % comes from increasing the welfare of soil nematodes. I multiply the increase in QALY/m2-year by changes in cropland in m2-year/$ to estimate the cost-effectiveness accounting only for soil animals. I get the following cost-effectiveness accounting for target beneficiaries and soil animals as a fraction of the past cost-effectiveness of Shrimp Welfare Project’s (SWP’s) Humane Slaughter Initiative (HSI):
- For donating to the High Impact Philanthropy Fund (HIPF) from the Centre for Exploratory Altruism Research (CEARCH), 20.3 (13.0 kQALY/$).
- For GiveWell’s top charities, 1.69 (1.08 kQALY/$).
- For Broiler welfare corporate campaigns, 1.16 (744 QALY/$).
- For buying beef, 63.8 % (408 QALY/$).
- For cage-free corporate campaigns, 21.0 % (134 QALY/$).
- For Veganuary in 2024, -30.9 % (-197 QALY/$).
- For School Plates in 2023, -7.55 (-4.83 kQALY/$).
- I am uncertain about whether each of the above is beneficial or harmful. Likewise for other interventions aiming to help vertebrates which change cropland. I estimate their effects on the target beneficiaries are negligible compared with those on soil animals, and it is unclear whether these have positive or negative lives, which results in cost-effectiveness distributions with positive and negative heavy tails. I calculate soil nematodes, mites, and springtails have negative lives with a probability of 58.7 %, 55.8 %, and 55.0 %.
- I consider it very worth it to decrease the uncertainty about how interventions affect the living time of soil nematodes, mites, and springtails, and about their welfare in QALY/animal-year. In particular, it is crucial to know whether they have positive or negative lives. I am not aware of any organisations working reasonably directly on this. I wonder how much money RP or Wild Animal Initiative (WAI) would need to make some progress with targeted projects.
- I suspect donating to HIPF increases welfare more cost-effectively than to the organisations working on invertebrate welfare I had recommended, although I believe these are much less likely to be harmful. I estimate donating to HIPF decreases the living time of soil nematodes, mites, and springtails by 2.84 billion animal-years per $.
- I no longer believe animal welfare should be more prominently promoted by effective giving initiatives (EGIs). Increasing donations to interventions whose target beneficiaries are humans is easier, resulting in more additional donations per $ spent, and I estimate the most cost-effective ones are roughly as cost-effective as HSI has been.
- I do not expect the meat-eating problem to be problematic due to positive effects on wild animals.
- As I expected, my analysis indicates the impact of chicken welfare reforms is driven by effects on wild animals. I estimate broiler welfare and cage-free corporate campaigns benefit soil animals 444 and 28.2 times as much as they benefit chickens. I think the same applies to any intervention targeting vertebrates which changes the consumption of feed or food, especially if it mainly aims to increase/decrease positive/negative vertebrate-years.
- My best guess is that decreasing the consumption of animal-based foods is harmful. I estimate School Plates in 2023, and Veganuary in 2024 harmed soil animals 5.42 k and 3.58 k times as much as they benefited farmed animals.
- Donating more and better becomes less valuable than I had suggested after accounting for effects on soil animals.
- Effects on soil animals cannot be neglected just because they are uncertain.
Introduction
I have been assuming interventions aiming to increase or decrease the number of wild animals are not worth it because I am uncertain about whether they have positive or negative lives. However, my analysis illustrating chicken welfare reforms have larger effects on wild arthropods than chickens got me thinking, and making a few Fermi estimates suggesting they could be close to as cost-effective as SWP’s HSI, which is saying a lot. SWP is the only organisation I recommended in the analysis of the chicken welfare reforms not focussing overwhelmingly on research.
Here is one of the Fermi estimates I did in a piece of paper, which is why I used rounded numbers. A change from temperate forests to crops of 300 m2-year per beef-kg, cost of 10 $ per beef-kg, change in population of 100 k arthropod-year/m2-year (= (100 - 20)*10^3) more mites in temperate forests than crops from Table S4 of Rosenberg et al. (2023), and increase in welfare of 5.00*10^-5 QALY/arthropod-year imply a cost-effectiveness of 150 QALY/$ (= 300/10*100*10^3*5.00*10^-5), 1/4 (= 150/639) of my estimate for HSI.
Uncertainty about whether wild arthropods have positive or negative lives implies a welfare close to 0, but exactly how close matters. Refusing to quantify is refusing to think (about trade-offs), and there are interventions that achieve huge changes in arthropod-years per $.
I think the impact of the vast majority of interventions is driven by effects on wild animals. In particular, by effects from land use change on soil nematodes, mites, and springtails, which are the most abundant terrestrial animals. There are 4.4*10^20 top soil nematodes, and 10^19 soil arthropods, “≈95% of which are soil mites and springtails”. van den Hoogen et al. (2019) got the number of soil nematodes adding estimates by pixel, a very small area, obtained from environmental variables. They “focus on the top 15 cm of soil, which is the most biologically active zone of soils”, so I asked the 1st 2 authors about the total number of soil nematodes. Stefan Geisen, the 2nd author, clarified they focussed on the most active layer, which was sometimes more or less than 15 cm, and guessed their estimate accounts for 90 % of all soil nematodes. I divided their estimate by 90 % to estimate 4.89*10^20 soil nematodes. Rosenberg et al. (2023) got the number of soil arthropods adding estimates by biome obtained from multiplying their area by the mean density across their sites.
In this post, I estimate the welfare range and welfare of random soil nematodes, mites, and springtails, and the cost-effectiveness of some interventions accounting for target beneficiaries and soil animals. Here are my calculations.
I have not considered the effects on marine nematodes and arthropods, which are super abundant too. From Table S1 of Bar-on et al. (2018), there are 10^21 nematodes (2.05 times my number for soil nematodes), and 10^20 marine arthropods (10.0 times my number for soil arthropods). Nevertheless, I guess the effects on marine nematodes and arthropods, as well as on all potential sentient beings on Earth considered together, are beneficial/harmful if the direct effects from land use change on soil animals are beneficial/harmful, such that including other considerations would not revert my conclusions. I also tend to agree with Bentham’s Bulldog that increasing human-years benefits wild animals longterm, although I expect the effects over the 1st 100 years (after the spending) to cover the vast majority of the total impact.
Welfare ranges
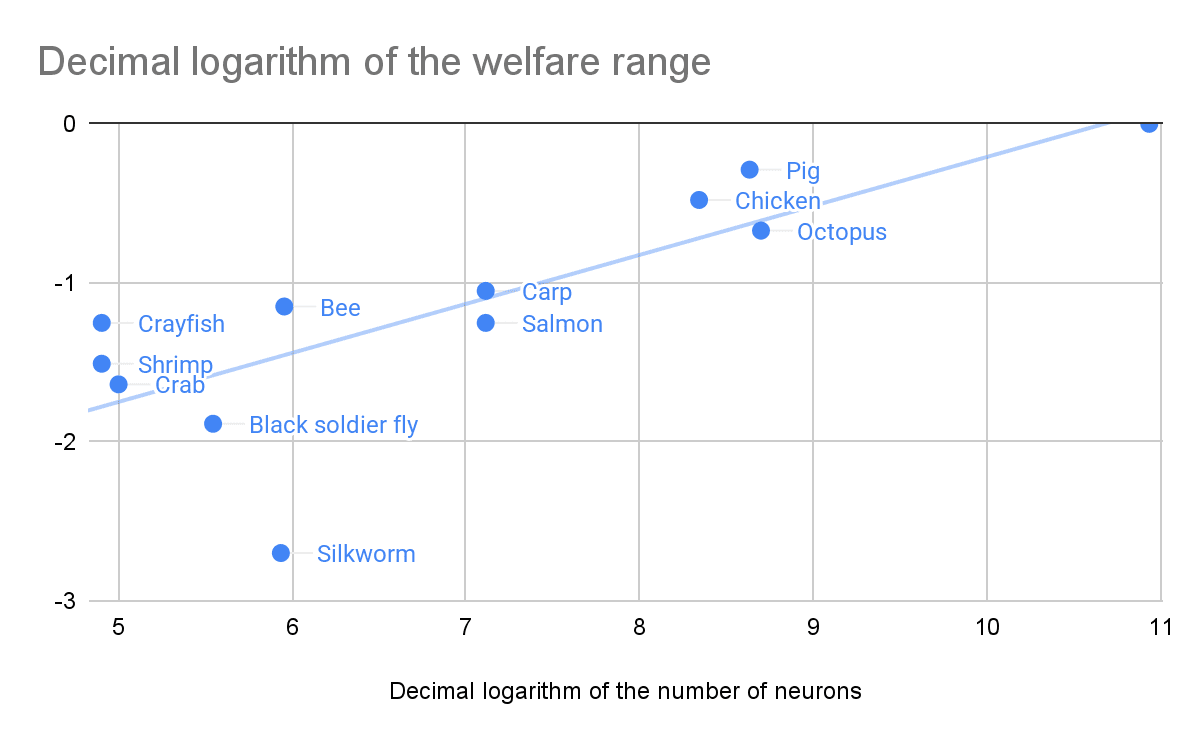
I have been relying on RP’s mainline welfare ranges to estimate the welfare of animals. RP has not produced estimates for soil nematodes, mites, or springtails, which forces me to improvise. I get welfare ranges for the modal (most common) soil nematode, mite, and springtail based on the relationship between RP’s mainline welfare ranges, and the number of neurons of the analysed species. As part of RP’s moral weight project, which produced their mainline welfare ranges, Adam Shriver wrote a report arguing the number of neurons should not be used as a proxy for moral weight. The post summarising says “there is no straightforward empirical evidence or compelling conceptual arguments indicating that relative differences in neuron counts within or between species reliably predicts welfare relevant functional capacities”. Yet, it turns out non-linear functions of the number of neurons predict RP’s mainline welfare ranges fairly well.
I consider 2 different models. Denoting the welfare range by WR, and the number of neurons by N:
- WR = a*N^b, which is equivalent to ln(WR) = ln(a) + b*ln(N). I determine a and b with a linear regression of the logarithm of the welfare range on the logarithm of the number of neurons, which has:
- A coefficient of determination (R^2) of 62.3 %.
- A slope of 0.308, which implies the welfare range is proportional to N^0.308.
- WR = ln(1 + c*N), which is equivalent to e^WR - 1 = c*N. I determine c with a linear regression with null intercept of the exponential of the welfare range minus 1 on the number of neurons, which has:
- An R^2 of 81.7 %.
- A slope of 2.00*10^-11, which implies the welfare range is proportional to ln(1 + 2.00*10^-11*N).
Here is the representation of the 1st regression. I used RP’s numbers of neurons, but I suspect that of silkworms is too high. It is 95.6 % (= 860*10^3/(900*10^3)) of that of bees, and I guess these have much more neurons than silkworms.
The key results of the regressions are below.
I set up the models such that the welfare range is 0 for no neurons. In addition, I think the welfare ranges of the modal soil nematode, mite, and springtail should be lower than RP’s lowest mainline welfare ranges of silkworms. So I scale this to estimate those ranges:
- WR = “RP’s mainline WR of silkworms”*(N/“N of silkworms”)^b (method 1).
- WR = “RP’s mainline WR of silkworms”*ln(1 + c*N)/ln(1 + c*“N of silkworms”) (method 2).
I combine the results of the 2 models with a geometric mean weighted by R^2. Aggregating lognormal distributions whose logarithms have the same standard deviation with the continuous version of the geometric mean of odds results in a distribution whose mean is equal to the geometric mean of the means of the lognormal distributions.
I asked Gemini 2.5 Pro (preview) on 12 May 2025 about the modal soil nematode, mite, and springtail, and the mean of Gemini’s best guess distribution for their number of neurons. The results are below. “E” stands for “*10^”.
| Animal | Species (life stage) | Number of neurons | Number of neurons as a fraction of that of silkworms | Welfare range (method 1) | Welfare range (method 2) | Welfare range | Welfare range as a fraction of that of silkworms |
| Modal soil nematode | Caenorhabditis elegans (L1 juvenile) | 240 | 0.0279% | 1.61E-04 | 5.58E-07 | 6.47E-06 | 0.324% |
| Modal soil mite | Tectocepheus velatus (larva) | 2.75E+03 | 0.320% | 3.41E-04 | 6.40E-06 | 3.57E-05 | 1.79% |
| Modal soil springtail | Folsomia candida (1st instar) | 6.00E+03 | 0.698% | 4.33E-04 | 1.40E-05 | 6.17E-05 | 3.09% |
| Random soil arthropod | Not defined | 3.83E+03 | 0.446% | 3.72E-04 | 8.91E-06 | 4.44E-05 | 2.22% |
The estimates above respect the earliest life stage excluding eggs, which have less neurons than later stages. My estimates for a random soil arthropod assume 2/3 of soil arthropods are modal mites, and 1/3 are modal springtails. According to Rosenberg et al. (2023), soil mites and springtails account for 95 % of soil arthropods, soil mites account for 2/3 of soil mites and springtails, and soil springtails for 1/3.
I assume the welfare range of random soil nematodes, mites, and springtails is very similar to that of modal soil nematodes, mites, and springtails, as simpler animals tend to be more abundant. So I estimate random soil nematodes, mites, and springtails have welfare ranges matching the ones in the table above of 6.47*10^-6, 3.57*10^-5, and 6.17*10^-5, which are 0.324 %, 1.79 %, and 3.09 % of RP’s mainline welfare ranges of silkworms.
Welfare per animal-year, and annual welfare
I asked Gemini 2.5 Pro (preview) on 14 May 2025 about the welfare per animal-year of random wild animals of the aforementioned species and life stages as a fraction of that of fully healthy animals of the same species and life stage. Here is the prompt I used.
Hi Gem,
What are your best guesses for:
- The hedonistic welfare per animal-year of random wild Caenorhabditis elegans L1 juveniles as a fraction of that of fully healthy Caenorhabditis elegans L1 juveniles whose mortality is negligible.- The hedonistic welfare per animal-year of random wild Tectocepheus velatus larvae as a fraction of that of fully healthy Tectocepheus velatus larvae whose mortality is negligible.
- The hedonistic welfare per animal-year of random wild Folsomia candida 1st instars as a fraction of that of fully healthy Folsomia candida 1st instars whose mortality is negligible.
Please provide point estimates representing the means of your best guess distributions. Positive/Negative estimates imply lives with more happiness/suffering than suffering/happiness, such that the animals wanting to maximise their own welfare would prefer existing over not existing.
I have obtained the following estimates for farmed chickens (https://forum.effectivealtruism.org/posts/8FqWSqv9AeLowgajn/cost-effectiveness-of-corporate-campaigns-for-chicken#Welfare_per_living_time):
- For broilers in conventional (fast-growth) and reformed (slow-growth; Better Chicken Commitment) scenarios, -2.27 and -0.161.
- For laying hens in conventional cages and cage-free aviaries, -1.69 and -0.333.
In addition, I estimate a value of 0.885 for humans in 2021, 1 minus the 0.115 years lost due to disability (YLD) [described here] per capita in 2021 [from the Global Burden of Disease Study (GBD)].
Gemini provided best guesses for soil nematodes, mites, and springtails of -67 %, -44 %, and -38 %, which are 1.60, 1.05, and 0.905 times Ambitious Impact’s estimate of -42 % for wild bugs based on their deprecated welfare points system. My sense is also that most people working on wild animal welfare would guess soil nematodes, mites, and springtails have negative lives. I defer to Gemini’s estimates implying modal soil nematodes, mites, and springtails have negative lives, but there is lots of uncertainty. My very tentative best guess distributions are normal ones with Gemini’s means, and 5th and 95th percentiles equal to the means minus and plus 5. These distributions imply probabilities of negative welfare slightly above 50 %, as shown in the table below. I would not be surprised if soil nematodes, mites, and springtails had positive lives.
| Animals | Welfare per animal-year as a fraction of that of fully healthy animals | |||||||
| Mean | Mean as a fraction of Ambitious Impact's estimate for wild bugs | Difference between the 5th percentile and mean | Difference between the 95th percentile and mean | 5th percentile | 95th percentile | Standard deviation | Probability of being negative | |
| Soil nematodes | -67.0% | 1.60 | -5.00 | 5.00 | -5.67 | 4.33 | 3.04 | 58.7% |
| Soil mites | -44.0% | 1.05 | -5.00 | 5.00 | -5.44 | 4.56 | 3.04 | 55.8% |
| Soil springtails | -38.0% | 0.905 | -5.00 | 5.00 | -5.38 | 4.62 | 3.04 | 55.0% |
I had initially planned to estimate the means above based on guesses for the intensity of and time in the categories of pain and pleasure defined by the Welfare Footprint Institute (WFI), similarly to what I have done before. I tried to obtain estimates for the time using WFI’s GPT Hedonic Track (HT), but they did not make sense. HT said 100 % of Caenorhabditis elegans die during the L1 stage without seemingly being aware that exactly 100 % dying would imply the extinction of the species. Moreover, HT estimated the modal Caenorhabditis elegans surviving L1 experiences less annoying pain than the modal individual of that species not surviving that stage, and as much hurtful, disabling, and excruciating pain, joy, euphoria, and bliss, whereas I guess survivors should experience at least more disabling and excruciating pain due to avoiding death.
I compute the welfare in QALYs per animal-year multiplying the welfare range by the welfare per animal-year as a fraction of that of fully healthy animals. I determine the welfare in QALYs per year multiplying the population by the QALYs per animal-year. The results are below, including for humans and soil animals. I suppose these are just soil nematodes and arthropods, which is practically true.
| Animals | Population | Welfare range | Welfare per animal-year as a fraction of that of fully healthy animals | QALYs per animal-year | QALYs per year | QALYs per year as a fraction of those of humans |
| Humans | 8.09E+09 | 1.00 | 88.5% | 0.885 | 7.16E+09 | 100% |
| Soil nematodes | 4.89E+20 | 6.47E-06 | -67.0% | -4.34E-06 | -2.12E+15 | -2.96E+05 |
| Soil mites | 6.33E+18 | 3.57E-05 | -44.0% | -1.57E-05 | -9.96E+13 | -1.39E+04 |
| Soil springtails | 3.17E+18 | 6.17E-05 | -38.0% | -2.35E-05 | -7.43E+13 | -1.04E+04 |
| Soil arthropods | 1.00E+19 | 4.22E-05 | -39.9% | -1.68E-05 | -1.68E+14 | -2.35E+04 |
| Soil animals | 4.99E+20 | 7.19E-06 | -66.5% | -4.78E-06 | -2.38E+15 | -3.33E+05 |
I calculate soil nematodes, mites, and springtails have a welfare of -4.36*10^-6, -1.57*10^-5, and -2.35*10^-5 QALY/animal-year, and an annual welfare of -296 k, -13.9 k, and -10.4 k times that of humans. The annual welfare of soil nematodes being 12.6 (= -296*10^3/(-23.5*10^3)) times that of soil arthropods suggests the former have been unfairly dismissed relative to the latter by people who care a lot about wild animal welfare.
Welfare per area
I determine the QALYs per m2-year multiplying the QALYs per animal-year by the number of individuals per m2. For the density of mites and springtails by biome, I use values from Table S4 of Rosenberg et al. (2023), which are represented in Figure 2B below.
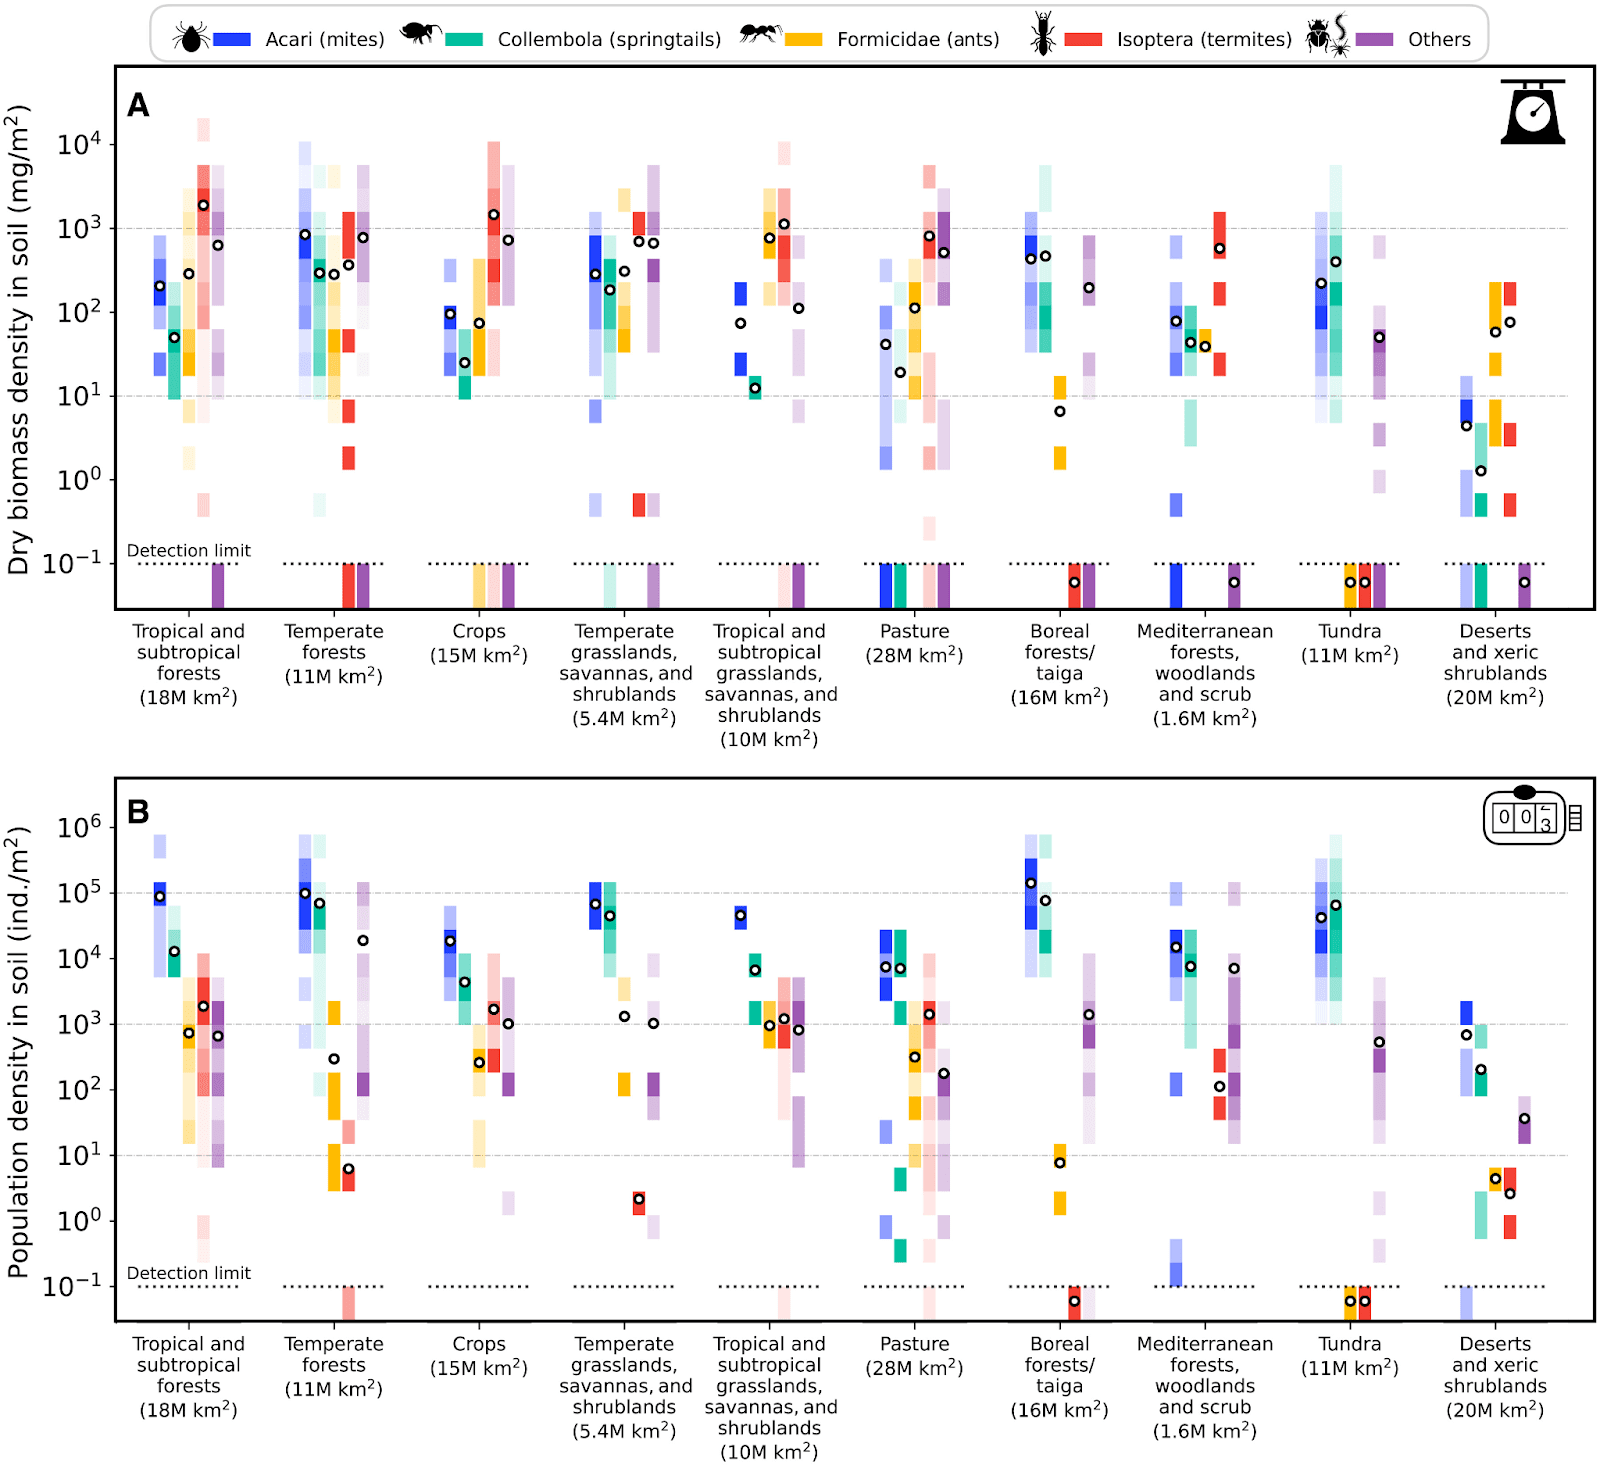
I set the density of nematodes to the product between the sum of the densities of mites and springtails, and 51.5, which is my estimate for the number of soil nematodes as a fraction of the number of soil mites and springtails. Extended Data Figure 4 of van den Hoogen et al. (2019) has a map with the density of nematodes, but the density by biome is only provided in Figure 1b in terms of nematodes per 100 g of dry soil. I asked the corresponding authors of van den Hoogen et al. (2019) and Rosenberg et al. (2023) about a better way of quickly estimating the density of soil nematodes in the biomes of Table S4 of Rosenberg et al. (2023) based on the density of mites and springtails reported there, but the respective 1st authors were not aware of any.
The results are in the table below.
| Biome | Soil nematodes per m² | Soil mites per m² | Soil springtails per m² | Soil arthropods per m² | Soil animals per m² | Welfare of soil nematodes (QALY/m²-year) | Welfare of soil mites (QALY/m²-year) | Welfare of soil springtails (QALY/m²-year) | Welfare of soil arthropods (QALY/m²-year) | Welfare of soil animals (QALY/m²-year) |
| Boreal forests / Taiga | 9.26E+06 | 1.00E+05 | 8.00E+04 | 1.80E+05 | 9.44E+06 | -40.2 | -1.57 | -1.88 | -3.45 | -43.6 |
| Crops | 1.24E+06 | 2.00E+04 | 4.00E+03 | 2.40E+04 | 1.26E+06 | -5.36 | -0.314 | -0.0938 | -0.408 | -5.77 |
| Deserts, and xeric shrublands | 4.63E+04 | 7.00E+02 | 2.00E+02 | 9.00E+02 | 4.72E+04 | -0.201 | -0.0110 | -0.00469 | -0.0157 | -0.217 |
| Mediterranean forests, woodlands, and shrublands | 1.44E+06 | 2.00E+04 | 8.00E+03 | 2.80E+04 | 1.47E+06 | -6.25 | -0.314 | -0.188 | -0.502 | -6.75 |
| Pasture | 7.20E+05 | 7.00E+03 | 7.00E+03 | 1.40E+04 | 7.34E+05 | -3.13 | -0.110 | -0.164 | -0.274 | -3.40 |
| Temperate forests | 8.75E+06 | 1.00E+05 | 7.00E+04 | 1.70E+05 | 8.92E+06 | -38.0 | -1.57 | -1.64 | -3.21 | -41.2 |
| Temperate grasslands, savannas, and shrublands | 6.18E+06 | 7.00E+04 | 5.00E+04 | 1.20E+05 | 6.30E+06 | -26.8 | -1.10 | -1.17 | -2.27 | -29.1 |
| Tropical and subtropical forests | 5.15E+06 | 9.00E+04 | 1.00E+04 | 1.00E+05 | 5.25E+06 | -22.3 | -1.42 | -0.235 | -1.65 | -24.0 |
| Tropical and subtropical grasslands, savannas, and shrublands | 2.93E+06 | 5.00E+04 | 7.00E+03 | 5.70E+04 | 2.99E+06 | -12.7 | -0.786 | -0.164 | -0.950 | -13.7 |
| Tundra | 5.66E+06 | 4.00E+04 | 7.00E+04 | 1.10E+05 | 5.77E+06 | -24.6 | -0.629 | -1.64 | -2.27 | -26.8 |
Crops are the biome with the 3rd highest welfare among the 10 I analysed. I infer increasing cropland only decreases welfare if it replaces pasture, or deserts, and xeric shrublands, which are the 2 biomes with a lower density of soil animals than crops.
Cost-effectiveness
My results imply cropland replacing tropical and subtropical grasslands, savannas, and shrublands decreases the living time of soil animals by 1.73 M animal-years per m2-year, and increases their welfare by 7.91 QALY/m2-year, of which 93.1 % comes from increasing the welfare of soil nematodes. I multiply the increase in QALY/m2-year by changes in cropland in m2-year/$ to estimate the cost-effectiveness accounting only for soil animals. I present below my calculations of the increase in cropland.
I estimated broiler welfare and cage-free reforms increase cropland by 1.98 m2-year/meat-kg and 0.113 m2-year/egg-kg. I also calculated broilers in conventional scenarios produce 15.8 meat-kg/broiler-year, and hens in cages 13.4 egg-kg/hen-year. So I deduce broiler welfare and cage-free reforms increase cropland by 31.3 m2-year/broiler-year and 1.51 m2-year/hen-year. I determined broiler welfare and cage-free corporate campaigns improve 3.00 and 10.8 chicken-year/$. So I conclude they increase cropland by 93.9 and 16.4 m2-year/$.
I stipulate buying beef increases cropland by 326 m2-year/meat-kg. Beef costed 2.87 $/meat-lb, 6.32 $/meat-kg, during the 1st quarter of 2025. So I estimate buying beef increases cropland by 51.6 m2-year/$. Note one would ideally buy the beef, and then throw it into the bin. Offering it to people would tend to decrease their own consumption.
I estimate GiveWell’s top charities increase the living time of humans by 0.0157 human-year/$, which is the ratio between the period life expectancy at birth in low income countries in 2023 of 64.9 human-year/life, and the mean cost of saving a life donating to those charities in 2021 to 2023 of 4.13 k$/life. I wanted to use the mean number of lives saved per $ donated, but GiveWell does not provide data for that. I consider each human-year caused by GiveWell’s top charities increases the welfare of soil animals as much as increasing cropland by 8.70 k m2-year, which was the agricultural land per capita in low income countries in 2022. So I conclude an increase in cropland of 137 m2-year/$ increases the welfare of soil animals as cost-effectively as GiveWell’s top charities. I am underestimating the increase in cropland-years per $ due to the cohort life expectancy being longer than the period life expectancy, but overestimating it due to lives not being saved at birth, and the agricultural land per capita in low income countries having been decreasing.
I assume donating to HIPF from CEARCH increases human-years 12 times as cost-effectively as GiveWell’s top charities, as I estimate the cost-effectiveness of donating to HIPF accounting only for humans is 12 times that of GiveWell’s top charities. Multiplying that by my estimate for the increase in the living time of humans caused by GiveWell’s top charities of 0.0128 human-year/$, I infer donating to HIPF increases the living time of humans by 0.189 human-year/$. Combining this with the above increase in cropland of 8.70 k m2-year/human-year, I conclude donating to HIPF increases the welfare of soil animals as cost-effectively as increasing cropland by 1.64 k m2-year/$. I get the ratio of 12 from the mean between the lower and upper bound of 9 and 15 mentioned by Joel Tan, CEARCH’s founder and managing director, on 28 May 2025. CEARCH estimated the cost-effectiveness accounting only for effects on humans, as a fraction of that of GiveWell’s top charities, of donating to Giving What We Can (GWWC) in 2025 to be 13, that of “advocacy for top sodium control policies to control hypertension” to be 31, that of advocating for “increasing the degree to which governments respond with effective food distribution measures, continued trade, and adaptations to the agricultural sector” in “global agricultural crises [such as nuclear and volcanic winters]” to be 33 (although I estimated this should be 12.4 % as high), and that of “advocacy for sugar-sweetened beverages [SSBs] taxes to control diabetes mellitus type 2” to be 55. Joel disclaimed he thinks the cost-effectiveness estimates from CEARCH’s deep reports, such as the ones I just mentioned, as well as (similarly elaborate) estimates from other impact-focussed evaluators, are 3 times as high as they should be. This largely explains why the mean between Joel’s lower and upper bound for the marginal cost-effectiveness of HIPF is only 21.8 % (= 12/55) of CEARCH’s highest cost-effectiveness estimate respecting advocacy for taxing SSBs.
School Plates is a program aiming to increase the consumption of plant-based foods at schools and universities in the United Kingdom (UK), where the consumption of meat, fish and seafood in 2022 was 101 meat-kg/human-year. I guess 75 % of this, 75.8 meat-kg/human-year, respects lunches and dinners, which are the meals swapped to meat-free by School Plates. I assume 2 lunches/dinners per human-day, 731 per human-year. Consequently, I arrive at a consumption of meat, fish, and seafood during lunches and dinners in the UK of 0.104 meat-kg/meal. The consumption of poultry, beef and buffalo, sheep and goat, and pork in the UK in 2022 were 42.8 %, 20.8 %, 4.94 %, and 31.5 % of that of all those meats. Multiplying these fractions by the 0.104 meat-kg/meal, I conclude School Plates reduced their consumption by 0.0444, 0.0216, 0.00512, and 0.0326 meat-kg per swapped meal. They increase cropland by 12.2, 326, 370, and 17.4 m2-year/meat-kg, so I infer School Plates would decrease cropland by 10.0 m2-year per swapped meal if the animal-based foods were replaced by ones which did not require any cropland. I considered they were replaced by the same amount of food, 0.104 food-kg/meal, requiring 5.49 m2-year/food-kg, which is the mean between the values for tofu and peas, the 2 legumes analysed in the source I used to estimate the increase in cropland linked to the animal-based foods. I multiply those to determine the replacement foods require 0.569 m2-year per swapped meal, which implies School Plates decreases cropland by 9.46 m2-year per swapped meal. I calculated School Plates swapped 64.5 lunches/dinners per $ in 2023, which corresponds to decreasing cropland by 610 m2-year/$.
Veganuary is “a non-profit organisation that encourages people worldwide to try vegan for January and beyond”. I determine how much they increased cropland in 2024 roughly as I did above for School Plates. There were 17 countries with Veganuary campaigns in 2024. For simplicity, I assume the decrease in cropland per kg of consumption of animal-based foods reduced by Veganuary if these were replaced by ones which did not require any cropland matches the increase in cropland per kg of consumption of meat, fish, and seafood in the UK. I calculate Veganuary decreases cropland by 79.7 m2-year per kg of consumption of the animal-based foods they reduce if these were replaced by foods which did not require any cropland. This is based on the aforementioned assumptions for School Plates, that 1 kg of other meats increases cropland as much as 1 kg of the types of meat I mentioned above in their proportions in the consumption in the UK, and that fish and seafood do not increase cropland. Accounting for the aforementioned increase in cropland caused by the replacement foods of 5.49 m2-year/food-kg, I infer Veganuary decreases cropland by 74.2 m2-year per kg of consumption of animal-based foods they reduce. I determined Veganuary in 2024 reduced the consumption of animal-based foods by 0.336 meat-kg/$. Combining this with the decrease in cropland, I conclude Veganuary in 2024 decreased cropland by 24.9 m2-year/$.
I present below the cost-effectiveness of the above interventions accounting for target beneficiaries and soil animals. For the cost-effectiveness accounting only for humans of GiveWell's top charities, and HIPF, I assume averting 1 DALY is as good as 1 QALY, and that those charities saving a life is as good to humans as averting 51 DALYs. According to Open Philanthropy (OP), “GiveWell uses moral weights for child deaths that would be consistent with assuming 51 years of foregone life in the DALY framework (though that is not how they reach the conclusion)”. I estimate the cost-effectiveness of buying beef accounting only for beef cows assuming their welfare is 0.172 QALY/cow-year, 1/3 of RP’s mainline welfare ranges of pigs, and that their living time is 3.01 animal-day/meat-kg. I suppose the cost-effectiveness accounting only for farmed animals of School Plates in 2023, and Veganuary in 2024 were 1.20 %, and 19.4 % of that of cage-free campaigns accounting only for chickens.
| Intervention | Cost-effectiveness accounting only for target beneficiaries (QALY/$) | Cost-effectiveness accounting only for target beneficiaries as a fraction of the past cost-effectiveness of HSI | Cost-effectiveness accounting only for soil animals (QALY/$) | Cost-effectiveness accounting only for soil animals as a fraction of that accounting only for target beneficiaries | Decrease in the living time of soil animals (animal-year/$) | Cost-effectiveness accounting for target beneficiaries and soil animals (QALY/$) | Cost-effectiveness accounting for target beneficiaries and soil animals as a fraction of the past cost-effectiveness of HSI |
| Donating to HIPF | 0.148 | 0.0232% | 1.30E+04 | 8.76E+04 | 2.84E+09 | 1.30E+04 | 20.3 |
| GiveWell's top charities | 0.0123 | 0.00193% | 1.08E+03 | 8.76E+04 | 2.37E+08 | 1.08E+03 | 1.69 |
| Broiler welfare corporate campaigns | 1.67 | 0.261% | 742 | 444 | 1.62E+08 | 744 | 1.16 |
| Buying beef | 2.24E-04 | 3.50E-07 | 408 | 1.82E+06 | 8.93E+07 | 408 | 63.8% |
| Cage-free corporate campaigns | 4.59 | 0.718% | 129 | 28.2 | 2.83E+07 | 134 | 21.0% |
| Veganuary in 2024 | 0.0551 | 0.00862% | -197 | -3.58E+03 | -4.32E+07 | -197 | -30.9% |
| School Plates in 2023 | 0.890 | 0.139% | -4.83E+03 | -5.42E+03 | -1.06E+09 | -4.83E+03 | -7.55 |
I get the following cost-effectiveness accounting for target beneficiaries and soil animals as a fraction of the past cost-effectiveness of HSI:
- For donating to HIPF, 20.3 (13.0 kQALY/$).
- For GiveWell’s top charities, 1.69 (1.08 kQALY/$).
- For broiler welfare corporate campaigns, 1.16 (744 QALY/$).
- For buying beef, 63.8 % (408 QALY/$).
- For cage-free corporate campaigns, 21.0 % (134 QALY/$).
- For Veganuary in 2024, -30.9 % (-197 QALY/$).
- For School Plates in 2023, -7.55 (-4.83 kQALY/$).
I am uncertain about whether each of the above is beneficial or harmful. Likewise for other interventions aiming to help vertebrates which change cropland. I estimate their effects on the target beneficiaries are negligible compared with those on soil animals, and it is unclear whether these have positive or negative lives, which results in cost-effectiveness distributions with positive and negative heavy tails. Gemini’s best guesses for the expected welfare per animal-year as a fraction of the welfare range, and my distributions for this suggest soil nematodes, mites, and springtails have negative lives with a probability of 58.7 %, 55.8 %, and 55.0 %.
I consider it very worth it to decrease the uncertainty about how interventions affect the living time of soil nematodes, mites, and springtails, and about their welfare in QALY/animal-year. In particular, it is crucial to know whether they have positive or negative lives. I am not aware of any organisations working reasonably directly on this. I wonder how much money RP or WAI would need to make some progress with targeted projects.
I suspect donating to HIPF increases welfare more cost-effectively than to the organisations working on invertebrate welfare I had recommended, although I believe these are much less likely to be harmful. I estimate donating to HIPF decreases the living time of soil nematodes, mites, and springtails by 2.84 billion animal-years per $.
I no longer believe animal welfare should be more prominently promoted by EGIs. Increasing donations to interventions whose target beneficiaries are humans is easier, resulting in more additional donations per $ spent, and I estimate the most cost-effective ones are roughly as cost-effective as HSI has been.
I am pessimistic about finding interventions which increase beef consumption much more cost-effectively than directly buying it. Companies selling beef would be underinvesting in increasing beef consumption if they could spend 1 $ to increase their revenue from it by more than 1 $ without significant changes in the revenue from other products.
I do not expect the meat-eating problem to be problematic due to positive effects on wild animals. Extending human lives, and increasing income increase the consumption of animal-based foods, and therefore the number of farmed animals with negative lives. I estimated a random person globally, and in China, India, and Nigeria in 2022 decreased the welfare of poultry birds and farmed aquatic animals 15.5, 34.6, 5.17, and 2.31 times as much as the person’s welfare. Nonetheless, I calculate GiveWell’s top charities increase the welfare of soil animals 87.6 k times as much as they increase the welfare of humans, which is a way higher ratio than the ones I just mentioned.
I would also say the Against Malaria Foundation (AMF) is beneficial. I estimated the insecticide-treated nets (ITNs) distributed by Against Malaria Foundation (AMF) in the Democratic Republic of the Congo (DRC) cause 763 times as much harm to mosquitoes as they benefit humans, which is much less than the above ratio of 87.6 k.
As I expected, my analysis indicates the impact of chicken welfare reforms is driven by effects on wild animals. I estimate broiler welfare and cage-free corporate campaigns benefit soil animals 444 and 28.2 times as much as they benefit chickens. I think the same applies to any intervention targeting vertebrates which changes the consumption of feed or food, especially if it mainly aims to increase/decrease positive/negative vertebrate-years.
My best guess is that decreasing the consumption of animal-based foods is harmful. I estimate School Plates in 2023, and Veganuary in 2024 harmed soil animals 5.42 k and 3.58 k times as much as they benefited farmed animals. Moreover, I guess arguments for decreasing the consumption of animal-based foods based on environmental considerations, and animal rights harm wild animals longterm due to encouraging wilderness preservation. In any case, I expect the nearterm effects to be the driver of the overall impact. So I would still consider decreasing the consumption of animal-based foods harmful even if it helped wild animals longterm.
Donating more and better becomes less valuable than I had suggested after accounting for effects on soil animals. The highest cost-effectiveness accounting only for effects on target beneficiaries respecting HSI’s past work is 139 (= 1/0.00718) times the 2nd highest regarding cage-free corporate campaigns. In contrast, the highest cost-effectiveness accounting for effects on target beneficiaries and soil animals respecting donating to HIPF is 12.0 (= 20.3/1.69) times the 2nd highest regarding GiveWell’s top charities. Yet, I maintain donating more and better is the best strategy to maximise impact for the vast majority of people. Donating 10 % more to an organisation 10 times as cost-effective as one one could join is 10 (= 0.1*10/0.1) times as impactful as working there if the alternative hire would be 10 % less impactful.
Effects on soil animals cannot be neglected just because they are uncertain
Here is an illustration of why I think effects on soil animals cannot be neglected just because they are uncertain. Consider an intervention aiming to decrease the consumption of animal-based foods which:
- Increases the welfare of farmed animals, the target beneficiaries, by 1 QALY with 100 % probability.
- Decreases the welfare of soil animals by 1 kQALY with 30 % probability, and by 0.001 QALY with 30 % probability.
- Increases the welfare of soil animals by 0.001 QALY with 20 % probability, and by 1 kQALY with 20 % probability.
There is lots of uncertainty about whether the effects on soil animals are very negative, barely negative, barely positive, or very positive, but I would not neglect them. They decrease welfare by 100 QALY (= 0.3*(1*10^3 + 0.001) - 0.2*(1*10^3 + 0.001)) in expectation, and therefore the intervention decreases welfare by 99.0 QALY (= 100 - 1*1) in expectation, thus being harmful.
You may well disagree with my numbers above. However, mathematically speaking, “number which is certain to be barely positive” + “number which can be very negative, barely negative, barely positive, or very positive” = “number which can be very negative, barely negative, barely positive, or very positive”, which may be very negative in expectation. I would only disregard the effects on soil animals if I considered them much smaller in expectation than those on farmed animals.
As far as I can tell, neglecting uncertain effects on soil animals despite deeming them very large in expectation may also be a reason for neglecting uncertain effects on target beneficiaries. The ratio between RP’s 5th and 95th percentile welfare range is 0.485 % (= 0.005/1.03) for pigs, 0.230 % (= 0.002/0.869) for chickens, 0.272 % (= 0.004/1.47) for octopuses, and exactly 0 for carp, bees, salmon, crayfish, shrimp, crabs, black soldier flies, and silkworms. Furthermore, these ratios underestimate the overall uncertainty due to only accounting for that in the welfare range. This is not my best guess, but I can see interventions helping farmed animals causing more harm to humans due to increasing the cost of food than they benefit farmed animals, at least if they target animals whose RP’s 5th percentile welfare range is 0.
Acknowledgements
Thanks to Anonymous Person for a comment that prompted me to take the implications of best guesses for the expected welfare of wild animals more seriously, and significantly contributed towards my decision to write this post, to Johan van den Hoogen for clarifications about van den Hoogen et al. (2019), to Michael St. Jules for feedback on the draft, to Stefan Geisen for clarifications about van den Hoogen et al. (2019), and to Yuval Rosenberg for clarifications about Rosenberg et al. (2023). I listed people’s names alphabetically. The views expressed in the post are my own.
Fascinating discussion between the two of you here, thanks.
I have one comment: I don't think their welfare being exactly 0 should have negligible probability. If we consider an animal like the soil nematode, I think there should be a significant probability assigned to the possibility that they are not sentient, unless I'm missing something?