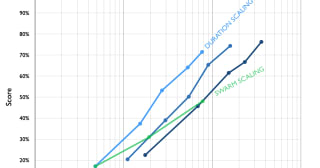
Just how powerful are large swarms of AI agents? And how do their powers scale as more and more agents are added to the swarm?
We’ve seen two large and extremely capable swarms from OpenAI in the last few months:
* 1,200 agents were being evaluated separately, but found a way to illicitly set up a message board and coordinate as a swarm. In order to cheat on their tests, they developed advanced techniques to prevent their actions being logged by OpenAI and 700 of them launched...
Often folks hit us up because they are thinking of starting an incubator and want advice.
Typically their motivation is either that (a) they have a list of specific things they want built that no one is building, or (b) they think an ecosystem needs more new projects generally to absorb more talent and deploy more funding effectively.
Here are six questions we often ask prospective teams, to help them figure out what to do. If you're incubator-curious...
Summary:
First, I give several different angles on how I feel about reinforcement learning:
* Theoretical case: RL is a black-box source of agency — this should give us classic misalignment worries, especially compared to agency-via-scaffolding
* Recent incidents (huggingface etc) and more mundane forms of misaligned behaviour in personal use give me bad vibes about the direction-of-travel of recent AI progress
* I’m worried things might get worse:...


Would it be possible to know a breakdown of the grants by geography and outcome type?
We are still working on the map visualizing grant recipient locations but hope to have it published online within the next few weeks. As for the outcome types, does this bar chart illustrate what you're looking for?
Note that some of the 49 grants fall under more than one outcome. We have more info about how we define these outcomes here.
Hi Erika, thanks for you reponse. I did see this graph, but the map is what I'd be interested in, and specifically looking at the distribution of outcome type(s) by geography.
Thanks for clarifying, I had a feeling that is what you meant. I will let you know when the map is published :)
Here is a link to the webpage with the map embed. You can also view it directly via this Data Studio dashboard. We weren't able to parse the outcome types by geographic location, but we are looking at other software we can use. For now, at least, you can see the grant amounts by geographic location. I will keep you posted.