We examine what factors predicted advancement in our engineering hiring round. We show two trends which seem common in EA hiring[1]: first, candidates with substantial experience (including at prestigious employers) were often unsuccessful, and second, candidates with limited experience and/or limited formal education were sometimes successful.
We sometimes hear of people being hesitant to apply to jobs out of a fear that they are hard to get. This post gives quantitative evidence that people can receive EA job offers even if their seemingly more qualified peers are rejected (and, indeed, traditional qualifications are almost uncorrelated with getting an offer).
In summary:
- None of the factors we looked at were statistically significant.
- Having previously worked at a Big Tech “FAANG” company was the only factor which had a consistently positive central estimate, although with confidence intervals that comfortably included both positive and negative effect sizes.
- Years of experience, typographical errors, and the level of university qualification seemed to have little predictive power.
This builds on our previous post which found that participation in EA had limited ability to predict success in our hiring round.
Context
There were 85 applicants for the role. The success rates for candidates in each stage are shown below. Some candidates voluntarily withdrew between the screening interview and trial task, hence there are fewer people taking part in the trial task than passed the interview.
| Stage | Number participating | Number passing | Success rate |
| Initial application sift | 85 | 48 | 57% |
| Screening interview | 48 | 45 | 94% |
| Trial task | 35 | 8 | 23% |
After the recruitment process was completed, we aggregated information about each applicant using the CVs and LinkedIn profiles they provided with their application. The metrics we were interested in were[2]:
- Did any previous role include the word “senior” in its title?
- Did any previous role include the word “manager” in its title?
- How many years of experience did the candidate have?
- How many typos were in the application?
- What was the highest degree obtained by the candidate?
- We coded this as: 1 for a bachelor-level degree, 2 for a master-level degree, and 3 for a doctoral degree.
- Has the applicant ever worked at a FAANG company?
This is not rigorous analysis; a “proper” model would include as many explanatory factors as possible, and the factors should be independent. This is reflected in the eventual predictive power of the models.
Findings
We fitted logistic regression models to the data; with the dependent variable being whether a candidate passed a given stage, and the independent variables being the factors listed above.
We then calculated modelled odds ratios and probabilities associated with each "predictor". The results of this are shown below, with a data table in the appendix.
- Binary variables include examples like “Has senior in title” or “Has FAANG company”. The odds ratio indicates how much more likely it is that people who were successful were “exposed” to that variable than not.
- Continuous variables include examples like “Years of experience” or “Highest degree”. The odds ratio indicates how much more likely it is that people who were successful were “exposed” to one unit increase in the variable than not.
Predictors for passing an initial sift
This model predicts whether all submitted applicants (N=85) would pass an initial sift and be invited to the screening interview, with sensitivity 56% and specificity 76%.

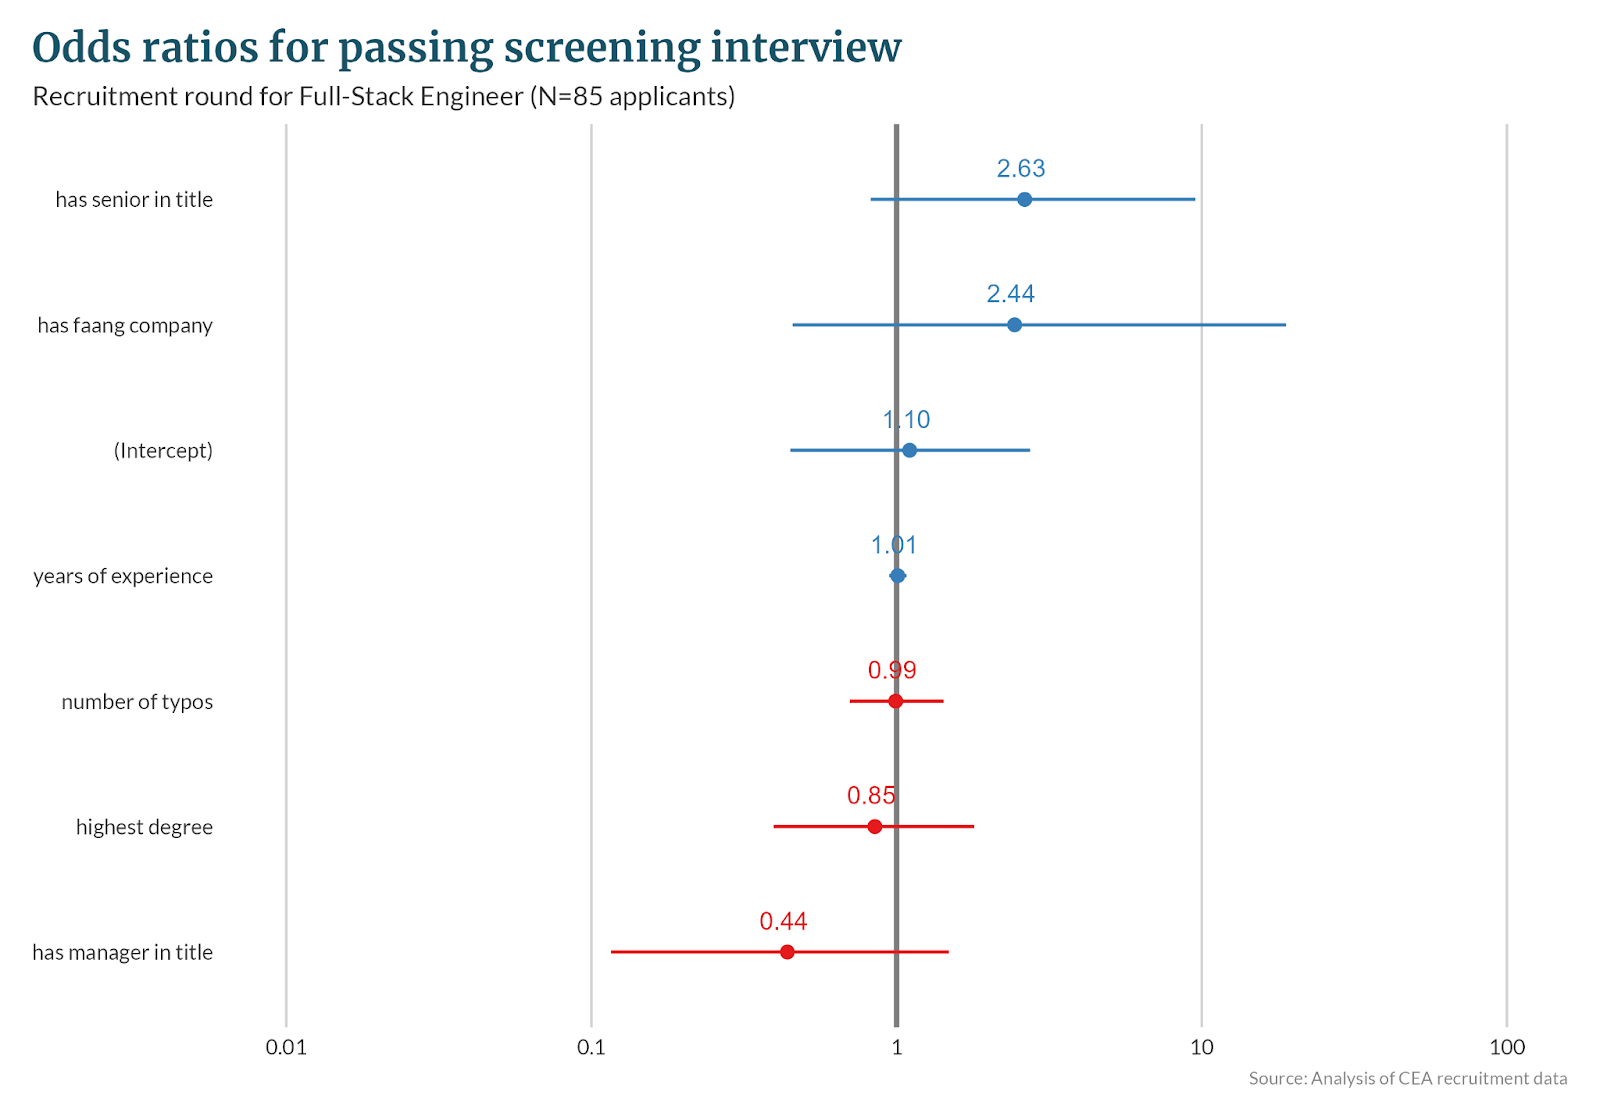
Predictors for passing screening interview
This model predicts whether all invited applicants (N=85) would pass the screening interview, with sensitivity 56% and specificity 70%.
Predictors for passing trial task
This model predicts whether applicants who did not withdraw prior to this point (N=83) would pass the trial task, with sensitivity 88% and specificity 58%.

Commentary from Ben
Discourse about EA hiring is sometimes simplified to "EA jobs are hard to get" (and therefore you shouldn't bother applying unless you are very qualified) or "there is a big talent gap" (and therefore everyone should apply).
This post gives evidence that “hard versus easy” isn’t really the right axis: it's hard to get a job (in the sense that well-qualified applicants were rejected) but also easy (in the sense that applicants with limited qualifications were accepted).
"When in doubt, just apply" continues to seem like good advice to me.
From the hiring manager’s perspective: This builds on our previous post which found that participation in EA had limited ability to predict success in our hiring rounds. Together, these posts make me pessimistic that simple automated screening criteria like “you need X years of experience” will be useful.
Appendix: Summary of modelled parameters
Passing initial sift (N=85) | Passing screening interview (N=85) | Passing trial task (N=75) | ||||
| Predictors | Odds Ratios | p | Odds Ratios | p | Odds Ratios | p |
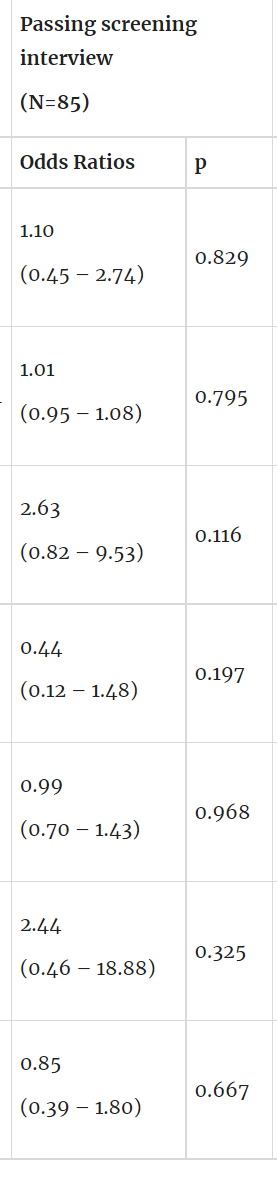
| (Intercept) | 1.06 (0.43 – 2.63) | 0.893 | 1.10 (0.45 – 2.74) | 0.829 | 0.36 (0.08 – 1.29) | 0.135 |
years of experience mean=9.4 | 1.01 (0.95 – 1.08) | 0.781 | 1.01 (0.95 – 1.08) | 0.795 | 0.90 (0.74 – 1.03) | 0.181 |
has senior in title n=17 | 2.23 (0.70 – 7.99) | 0.189 | 2.63 (0.82 – 9.53) | 0.116 | 0.81 (0.04 – 7.19) | 0.860 |
has manager in title n=14 | 0.50 (0.14 – 1.67) | 0.263 | 0.44 (0.12 – 1.48) | 0.197 | 0.90 (0.04 – 7.09) | 0.925 |
number of typos mean=0.9 | 0.93 (0.66 – 1.31) | 0.648 | 0.99 (0.70 – 1.43) | 0.968 | 0.90 (0.41 – 1.50) | 0.738 |
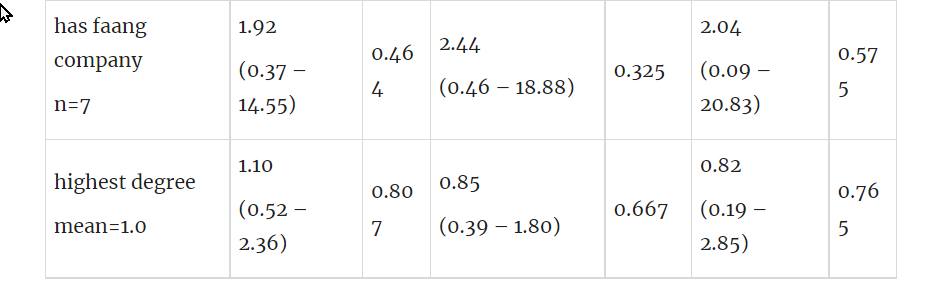
has faang company n=7 | 1.92 (0.37 – 14.55) | 0.464 | 2.44 (0.46 – 18.88) | 0.325 | 2.04 (0.09 – 20.83) | 0.575 |
highest degree mean=1.0 | 1.10 (0.52 – 2.36) | 0.807 | 0.85 (0.39 – 1.80) | 0.667 | 0.82 (0.19 – 2.85) | 0.765 |
- ^
They seem common in the authors’ experience; we would appreciate feedback in the comments from other hiring managers about their own experience.
- ^
We collected other factors but ultimately chose to exclude them from the analysis:
- University rankings - we could not obtain these for enough candidates, which reduced the sample size considered and affected their accuracy.
- Likely salaries in the candidate’s previous position - we used online sources to estimate the typical salary for the candidate’s most recent position and company, but again could not obtain this for enough candidates.
- Whether candidates had worked in a company with more than 1000 employees - we excluded this in favour of looking at whether candidates had worked at a FAANG company; it was not possible to include both since the variables are not independent.


To highlight (from this comment and reply) the hire rate for this position was 3.5%