Love this Jacco, thanks for posting! I feel like I'm constantly reading someone lament that the best data they can find on EA funding is from 2022, this is really helpful.
(I'd still like to see more work here - especially it'd be cool to see someone double check this work/ see if they get the same results, and for any funders who know better to read this post and comment).
There is also this post by Luke Moore and Sjir Hoeijmakers. They only compare 2023 and 2024, but they have also included funding data for Founders Pledge, Logview Philantropy, Macroscopic Ventures and a lot of smaller funders/grantmakers/evaluators/fundraisers. And they calculated that when including all of those, funding has actually increased. Mainly because of more funding through Founders Pledge and Navigation Fund.
Nice, thanks for updating your post with the additional data.
But I think there is an error in the new graph. The bars for Founders Pledge are in the color of Longview Philanthropy and the bars for Longview Philanthropy seem to be missing.
(edit: no longer true, post has been updated to fix this)
This is really awesome work, it's great to have someone put this together!
Hopefully the drop in @GiveWell's grants is just a timing or reporting issue and not nearly as large as it seems. Maybe they'll be able to clarify further!
If you wanted to extend this and cover more EA grants, I know Farmkind has a public database of grants from their platform that would be great to add. It also would be awesome if this could capture high-impact donations from Founders Pledge, but I'm not sure they provide granular enough data to be able to track by year and cause area. Maybe talking to @Matt_Lerner could shed some insight?
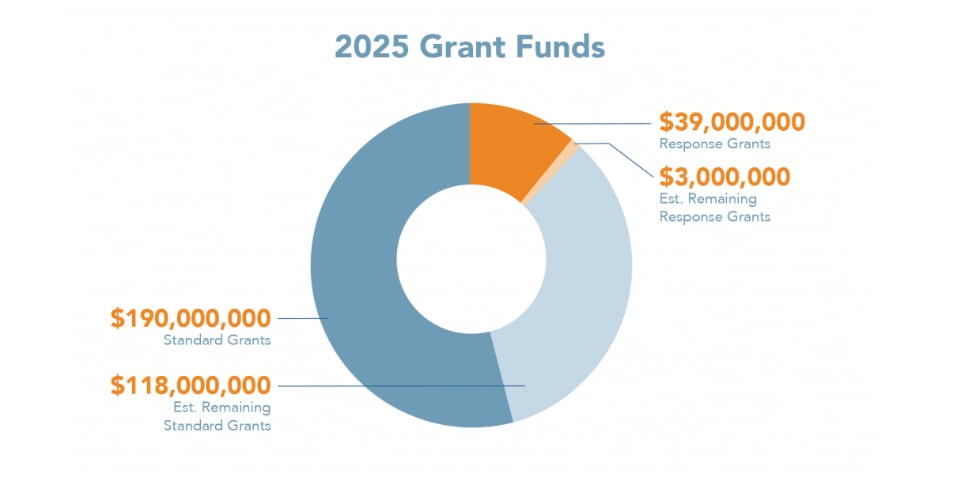
According to this chart posted yesterday, GiveWell anticipates granting $350MM this year. Adjusting +155MM would significantly affect many of the tentative takeaways.
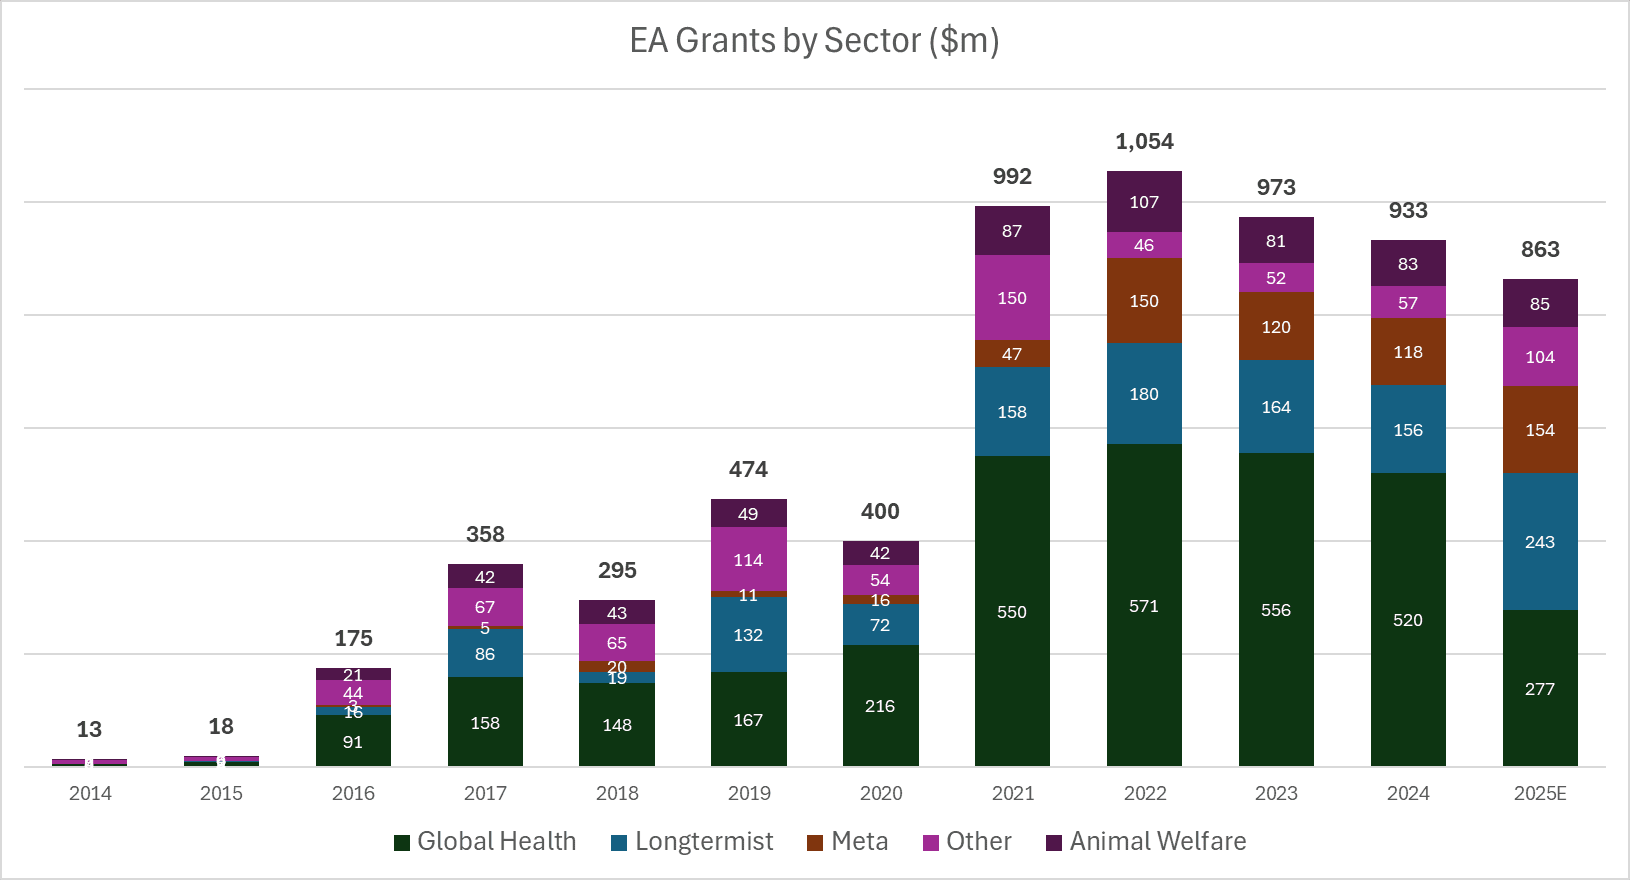
EA grantmaking appears on a steady downward trend since 2022 / FTX.
It looks like this is driven entirely by Givewell/global health and development reduction, and that actually the other fields have been stable or even expanding.
Also, in an ideal world we'd see funding from Longview and Founders Pledge. I also gather there's a new influx of money into the effective animal welfare space from some other funder, though I don't know their name.
It looks like this is driven entirely by Givewell/global health and development reduction, and that actually the other fields have been stable or even expanding.
This seems the opposite of what the data says up to 2024
Comparing 2024 to 2022, GH decreased by 9%, LTXR decreased by 13%, AW decreased by 23%, Meta decreased by 21% and "Other" increased by 23%
I think the data for 2025 is too noisy and mostly sensitive to reporting timing (whether an org publishes their grant reports early in the year or later in the year) to inform an opinion
One very important problem (that I don't have the solution to) is that being "an EA funder" is not binary -- all sorts of funders make grants to charities that would be considered EA (and "EA charity" is a fraught definition itself but let's bracket that). It seems entirely plausible to me, nay perhaps probable (given that the Randomstas and evidence-based GHD predates EA) that the majority of "EA funding" is coming from grantmakers that aren't being counted here. This would render any trends we see in the data in this post not reflective of what's actgually happening with "EA funding".
A bottom-up charity (or specific project or even grant) based method would probably be a lot better (although very hard and not your responsibility to create).
Anyway, meta is hard. Good work for creating this resource!
Thanks for bringing this up Aidan. I raised this topic in both of my versions of the Historical Funding post, and I remain interested in doing this properly if and when I get sufficient time and data. What I have found so far is (a) accessing the bottom-up data for ~all relevant charities seems to be much more difficult than I would have imagined, and (b) I've floated this project to a few people and the interest seemed lukewarm (probably mostly due to their sense of intractibility).
What about other international EA / effective giving platforms e.g. Mieux Donner. I transitioned my giving from Givewell to Mieux Donner this year to make use of EU tax efficiencies and increase my donations. Givewell actually helped me do this bless em.
Many of the national giving orgs send their money through organizations like GiveWell, meaning you would get double-counting if you listed both the national org and the evaluator.
This is probably not the case for all money moved by such organizations (or even all such organizations), but I think this should alleviate some of your concern.
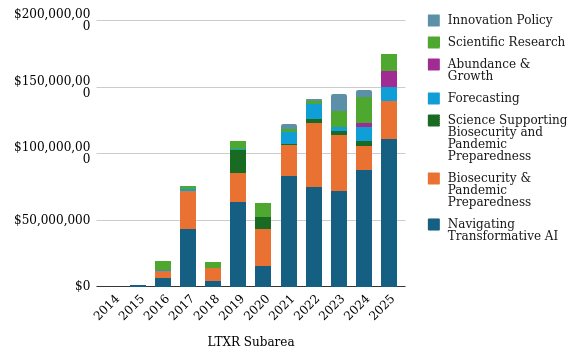
Thanks for making this! Is there a more detailed breakdown for the longtermist category? I have the suspicion that there was also a massive shift in this category in the last few years: most money went to AI, there are some breadcrumbs for pandemics and pretty much nothing for the rest. While in the time before this was more balanced. Would be curious to see if this is true.
Yes there are more detailed breakdowns. I've done some super quick analysis in a new tab in the sheet - you can take a look but broadly it looks like there is more money for AI, and about the same for other areas compared to the last ~5 years. I.e. AI funding is additional / at the expense of non-LTXR cause areas.
Putting your plot here in the comment, so others don't have to go through the spreadsheet:
What did you group into scientific research?
Curious to see this, because it does not map at all to what seems to be happening in the broader GCR space. ALLFED had to massively downsize, CSER has also gotten smaller, GCRI has gotten smaller, FHI has ceased to exist (though not due to funding explicitly). So, how does this map to the funding staying constant for non-AI things? Where is this funding going to, if it clearly does not end up with the most well known GCR orgs?
I should definitely have clarified that this is only pulling from OpenPhil's grants, so is missing SFF and EA Funds grants to LTXR.
The categorisations are not mine, they are how OpenPhil categorises their grants. I have also included some that I originally included in the "Other" category. (In the main graphs I only have navigating AI, bio / pandemics, and science supporting bio as LTXR from OpenPhil)
NOTE: Original post updated with additional data, which impacts some conclusions / observations - see "Updated data" section for further details.
Check out this post for more up-to-date and interactive data.
I was searching for summary data of EA funding trends, but couldn't find anything more recent than Tyler's post from 2022. So I decided to update it. If this analysis is done properly anywhere, please let me know.
The spreadsheet is here (some things might look weird due to importing from Excel to sheets)
Observations
EA grantmaking appears on a steady downward trend since 2022 / FTX.
The squeeze on GH funding to support AI / other longtermist priorities appears to be really taking effect this year (though 2025 is a rough estimate and has significant uncertainty.)
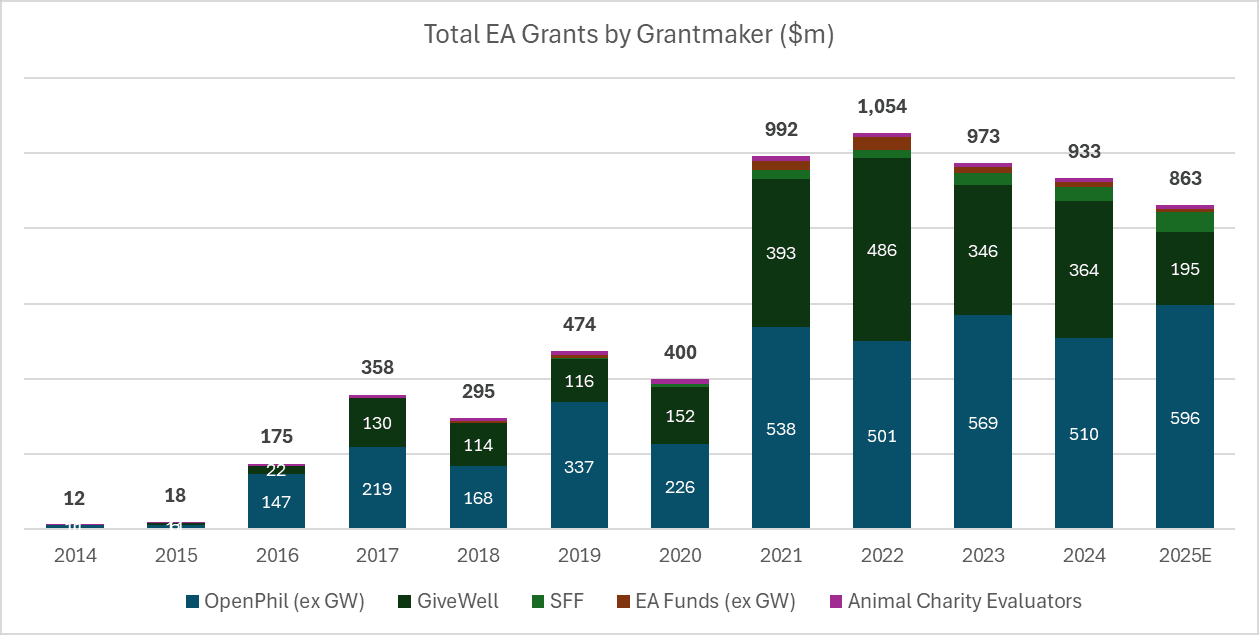
I am really interested in particular about the apparent drop in GW grants this year. I suspect that it is wrong or at least misleading - the metrics report suggests they are raising ~$300m p.a. from non OP donors. Not sure if I have made an error (missing direct to charity donations?) or if they are just sitting on funding with the ongoing USAID disruption.
(Edit note: I no longer endorse some of these observations; see "Updated data" section at the bottom of this post)
For 2025 data, I made a judgement call on how much data was "complete" and pro-rated accordingly - e.g. from GiveWell, it looks complete up until the end of June, so I excluded any grants made in H2 and doubled the sum.
Notes
My numbers are a bit different from Tyler's. I've identified the following reasons:
Inflation adjustments (i.e. an upward boost from using 2025$)
I've used GiveWell's grant database rather than their metrics reports,
Different avoidance of double counting (I removed from OP, Tyler removed from GW. I also went through more manually - from what I can see Tyler removed any GW grant that has OP as a donor, but this will remove too much for many grants that have multiple donors.
Tyler excludes "Other" grants, I've left them in.
Thanks for reading, hope this is interesting!
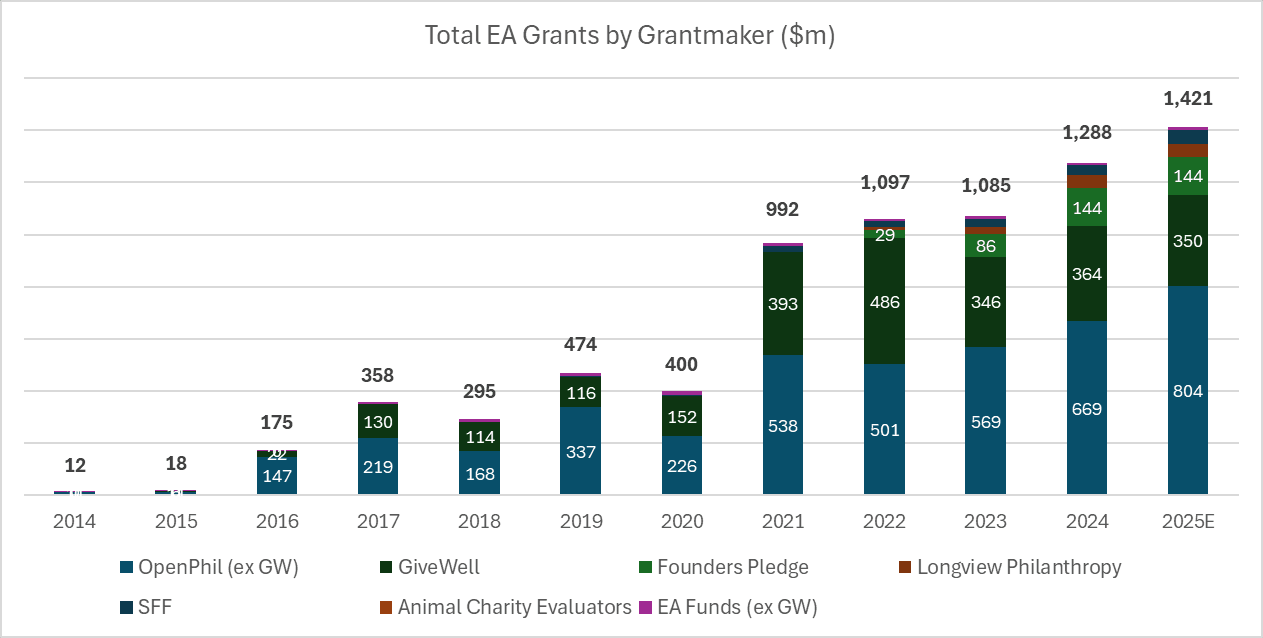
Updated data, with additional sources
A few people helpfully shared additional data points in the comments (Thanks @Jason, @MHR🔸, @Andreas Jessen🔸) I have included these in the below graph.
It provides a fuller picture for 2024 / 2025, but is much less comparable with earlier years. However, I do think it contradicts the previous tentative conclusion that overall EA funding is declining (also contradicted by Luke and Sjir's helpful memo). It also shows that GiveWell are maintaining their funding (though not growing in line with overall EA funding), which I think aligns better with what is suggested by their metric reports.
Changes made:
Updated OpenPhil figures for 2024 and 2025 to align with this, better reflecting won't-be-published and yet-to-be-published grants (note this means they are really not comparable with earlier years)
This is a crosspost from the new Animal Welfare Alignment Newsletter by Anima International. You can subscribe on Substack if you are interested in following these efforts. Audio reading also available on Substack.
The goals of this post are to:
1. Raise a question I see as crucially important to the goal of aligning AI to animal welfare...
Hello! I'm Justin Portela. I got hired by GWWC to make YouTube videos after AI in Context did such a kickass job.
My channel is using that same cinematic, high-production value beauty to talk about everything in the EA universe that isn't AI.
...
This is a linkpost for Request for Proposals: Research and Applied Work on Digital Minds.
I'm glad to announce a request for proposals for research and applied work on digital minds at Longview Ph...


Looking into this a bit more, from this thread it seems like OP's grants database may currently be missing as much as half of their 2025 GCR spending.
Thanks! I've edited the post to include an additional analysis using this data point.