EA was founded on the principle of cost-effectiveness. We should fund projects that do more with less, and more generally, spend resources as efficiently as possible. And yet, while much interest, funding, and resources in EA have shifted towards AI safety, it’s rare to see any cost-effectiveness calculations. The focus on AI safety is based on vague philosophical arguments that the future could be very large and valuable, and thus whatever is done towards this end is worth orders of magnitude more than most short-term effects.
Even if AI safety is the most important problem, you should still strive to optimize how resources are spent to achieve maximum impact, since there are limited resources.
Global health organizations and animal welfare organizations work hard to measure cost-effectiveness, evaluate charities, make sure effects are counterfactual, run RCTs, estimate moral weights, scope out interventions, and more. Conversely, in AI safety/x-risk/longtermism, very few efforts are spent on measuring impact. It’s hard to find anything public that compares the results of interventions. Perhaps funders make these calculations in private, but one of the things that made Givewell so great was that everything was out in the open. From day 1, you could see Givewell’s thinking on their blog, examine their spreadsheets, and change parameters based on your own thinking.
I’m making a first attempt at a “GiveWell for AI safety”. The end goal is to establish units to measure the cost-effectiveness of AI safety interventions, similar to DALY/$ in global health. Scott Alexander’s survey from last year is a great example of different kinds of relevant units for AI safety work. Given units like these, a donor or funder can look at the outputs of different AI safety orgs and “buy” certain things for far cheaper than they can for others.
To begin, I’m looking into the cost-effectiveness of AI safety communications. I’m starting with communications because it’s easiest to get metrics, and the outputs of comms work are publicly viewable (compared to e.g., AI policy work) and more easily assessable (compared to e.g., technical AI safety work). For this post, I’m going to be specifically focused on YouTube videos, where metrics were easiest to gather; I’m introducing my framework for evaluating different YouTube channels, along with measurements and data I’ve collected.
Step 1: Gathering data
The end goal metric I propose for AI safety videos' cost effectiveness is “quality-adjusted viewer-minute, per dollar spent”. I started by collecting data for channel viewership and costs.
Viewer minutes
To calculate time spent watching videos, I first wrote a Python script to query the YouTube API for views and view lengths for every video in specific channels. I multiplied these, and adjusted by a factor for the average percentage of a video watched: 33%, based on conversations with creators. I also messaged creators asking them for their numbers, using those directly where possible. For any creators that responded, I included their metrics (which were usually screenshotted, for authenticity).
Costs and revenue
To measure cost-effectiveness, we also need to estimate the costs of making the videos. In addition to direct costs (such as equipment and editing), I consider the value of time by people producing videos to be a major cost. This is because they could be doing other things, such as earning to give. Because of this, I generally ask people to estimate their market rate salaries if they are doing the work unpaid. For example, for AI in Context, this included the salaries paid to 80000 Hours employees for the production of their video. For other creators who had lots of personal savings and weren’t getting paid, I asked them to include the value of their time.
Some channels and podcasts also produce revenue through ads and sponsorships. This is a very good thing and is a sign that people want to see the content. In fact, I expect the best content will be able to self-fund after some time, and even be profitable. That said, for now, most aren’t profitable and subsist on donations; thus, I count revenues as offsetting costs for cost-effectiveness calculations, because this funding was produced organically, though I’m open to treating this differently.
Results
Before we get into quality adjustments, here’s a snapshot of where different channels stand:
Step 2: Quality-adjusting
For quality adjustment, there are three factors I introduce: the quality adjustment for the audience, Qa, the quality adjustment for the fidelity of the message, Qf, and the alignment of the message, Qm. So the overall equation is:
This quality adjustment is meant to capture the average quality/importance of the audience. The default audience is set to 1 as if the average person watching is an average person (totally random sample from the human population). If an audience member is more influential, has more resources, or is otherwise more impactful on the world, this number goes up; vice versa if it goes down. At the extreme, you might think of a value of 0 for someone who is about to die alone on their deathbed right after they watch the video, and perhaps as high as 1,000,000,000 for an audience of just the President of the US. Other things that make a viewer valuable are things like being at a pivotal time in their career, being extremely intelligent, etc.
This is comparable but not directly correlated with CPM (cost per thousand views, aka how much advertisers would pay to advertise to this person). This value could, in theory, be negative (it'd be better for this person not to watch this video/we'd pay for a person who was about to watch the video to have their internet shut down and the video not load), though I’d suggest ignoring that.
Normal values for this factor will be between 0.1 and 100, but should center around 1-10.
Fidelity of Message (Qf)
This refers to how well the message intended for the audience is received by the audience, on average, across all viewer-minutes. It attempts to measure the importance of the message and how well the message is conveyed for your goal. If your goal is to explain instrumental convergence or give the viewer an understanding of mechanistic interpretability, how well the video conveys the message is what is being measured here, alongside how important that message is.
An intuitive way to grasp this metric is to consider how much you’d rather someone watch one minute of a certain video compared to a reference video. For now, I am somewhat arbitrarily setting the reference video to be the average of Robert Miles’ AI safety videos. I’m seeking a better reference video; perhaps one that is more widely known or is simply considered to be the canonical AI safety video. If you would trade off X minutes of watching the video in question for 1 minute of the average Robert Miles video, then the Qf factor is 1/X.
Normal values of this number for relevant videos will be between 0.01 and 10.
Alignment of Message (Qm)
This factor refers to the message being sent relative to your values. This value will range from -1 to 1 and where a value of 1 is “this is the message I most want to get across to the viewers” and a value of -1 is “this is the exact opposite of the message I want to get across to viewers. For example, if your most preferred message to get across is “change your career to an AI safety career” and the message a particular video portrays is “pause AI” which you prefer half as much, Qm for this video is 0.5 and if the exact opposite message you want to portray is “accelerate AI as fast as possible”, you’d give a value of -1.
Importantly, this is perhaps the most subjective of the factors and depends greatly on your values
Feel free to make a copy of the Google sheet, insert your own values, play around with it, and compare things, as you can with Givewell’s spreadsheets. I intend to update the master spreadsheet with info as I receive it (costs, viewer minutes, etc.), so I don’t recommend you change non-subjective values. I’ve added comments to explain the estimates I made in the Google Sheet. I’m seeking recommendations for the best way to capture estimates vs. reported data, or any other suggestions.
Observations
The top cost-effectiveness comes from creators that are monetizing their content (AI Species and Cognitive Revolution) as well as well-produced videos of typical YouTube length (5-30 minutes), and not from long podcasts or short-form videos.
We’re seeing that for 1 dollar, good AI safety YouTube channels generate on the order of 150-300 QAVM (or about 2.5-5 hours).
Some things to compare this to.
Global average income is about $12k/year or about $6/hr. We could pay people this wage to watch videos; this would be 10 viewer-minutes per dollar.
We could pay to promote existing videos on YouTube. CPM on YouTube videos is about $0.03/view of about 15 seconds, which would be $0.12/minute or about 8 VM/$
We could pay to show video ads in other locations (eg, Super Bowl ads). A 30-second ad on Super Bowl LIX would have cost $8M and been shown to 120M US people, or ~8 viewer-minutes per dollar - with perhaps a 3x audience quality adjustment for primarily US viewers, you get 24 QAVM/$.
Of course, these comparisons don’t include the cost of video production itself.
Other notes from this exercise:
Over the course of this, I asked a lot of people, formally and informally, who they thought of as AI safety communicators, YouTubers, etc. Essentially, everyone said Robert Miles was the first that came to mind, and a few said that they have careers in AI safety, at least partially due to his videos. This led me to make the “audience quality” category and rate his audience much higher.
Here I am measuring average cost effectiveness, though we probably want to be doing this at the margin. While this is a different exercise, I think it should still be illuminating and should serve as a good benchmark we should be aiming for.
Where is Dwarkesh? Austin and I argued for a while on this — Austin thinks Dwarkesh should be included as someone whose channel reaches important people, while I think that very few of Dwarkesh’s videos count towards AI safety. I informally surveyed a bunch of people by asking them to name AI safety YouTubers, and Dwarkesh’s name never came up. When mentioned, he was not considered to be an “AI safety YouTuber”.
Many creators seemed to want me to include their future growth. I think this is perhaps a bit too subjective and would introduce a lot of bias. These view counts are a snapshot at this point in time, but when deciding what to fund, you should also consider growth rates and look to fund things that could reach a certain cost-effectiveness bar.
I don’t think that this post should cause large-scale shifts in what gets funded or what people do, but I do think cost-effectiveness is one of the things people should be looking at for the projects they pursue
How to help
The main thing I need is data, both of metrics and of costs, including the salaries of people spent making these videos. A lot of data is particularly hard to come by, and otherwise, I make estimates. Thanks to all the people who responded to my emails and text messages and gave me data already!
For next steps, I am planning to expand this into all media of AI communications (podcasts, books, articles, signed letters, article readings, website visits), collect data on metrics and costs, and come up with quality adjustments. If you make content or work for an org that has data, please message me at [email protected].
The end goal of this remains to cross-compare different “interventions” in AI safety, like fieldbuilding (MATS) and policy interventions (policy papers, lobbying efforts,) and research (quality/quantity of papers). Stay tuned!
Appendix: Examples of Data Collection
Rob Miles
The Donations List Website indicates Rob has received ~$300k across 3 years from the LTFF. Since Rob has been making videos for ~10 years, I am estimating it takes ~$100k/year for a total of $1M. I used my scraper and estimated here of ~33% average watch time of video per view for ~31.6M viewer minutes. I will update this one as soon as Rob responds to me, since Rob is considered the canonical AI safety YouTuber.
AI Species (Drew Spartz)
Drew told me he spent $100k for all the videos on his channel, and including his time (~1 year at $100k/year), $200k would be fair for total resources spent. I used my script to pull views for each video, and estimated that about 50% of each view was a full watch. I sent this to Drew, and he told me 30-35% was more realistic, and then he gave me his raw data. This was very helpful since it allowed me to calibrate % watch time for various video lengths.
Rational Animations
I looked at Open Phil grants, which totaled $2.785M. FTX FF gave a further $400k. I then added ~10% for other funding from individuals or other grantmakers that didn’t show up. I scraped their data for views from the YouTube API and used a 33% watch-through rate.
After this, Rational Animations confirmed to me that they in fact spent more and received more grants, which summed to $4,395,132.
AI in Context
Aric Floyd told me that 80k spent $50.75k on the video and that staff time on the video summed to ~$75.2k for a total of $126k. He also sent me his watch data for the video.
Cognitive Revolution
I asked Nathan, and he said I was approximately correct that $500k ($250k of which is on production and ~$250k paid to him as salary) is about what has been spent over the last couple of years for production. He also shared his YouTube data and suggested that he gets more engagement from audio-only. (Not to worry, Nathan, I’m analyzing this next. It’s just hard to get data.)
Cognitive Revolution is unique in that they have very substantial revenues because of sponsorships and YouTube views. This somewhat breaks my formulas for cost-effectiveness since donations aren’t required. In other words, Cognitive Revolution makes money. Therefore, I’m conservatively estimating the value of Nathan’s time here to be a bit higher, given his experience. Thus, $250k is spent on production, and $250k/year is spent on Nathan’s time. For 2 years, I have been considering the total cost of Cognitive Revolution to be $750k with $500k in revenues, though I am very open to changing these numbers. I don’t know the best way to treat Nathan’s podcast given all these variables.
Thank you both for doing this, I appreciate the effort in trying to get some estimates.
However, I would like to flag that your viewer minute numbers for my short-form content are off by an order of magnitude. And I've done 4 full weeks on the Manifund grant, so it's 4 * $2k = $8k, not $24k.
Plugging these numbers in (google sheetshere) I get a QAVM/$ of 389 instead of the 18 you have listed.
Other data corrections:
You say that the FLI podcast has 17M views and costed $500k. However, 17M is the amount of views on the overall FLI channel. If you look at the FLI podcastplaylist and just add up the numbers you get something closer to 1M (calculationhere). I'm assuming the $500k come from the podcast existing for 5 years and costing ~$100k / year? If so this does not include the three most viewed videos (that probably required a large budget) about slaughter bots and nuclear war (~12M of the 17M views). So really the google sheets should say 1M views, and the viewer minutes should be updated accordingly. (Except if they managed to produce all the slaughter bots / nuclear war stuff with a $500k budget).
Now, regarding watch time, saying that podcasts have a 33% watch time is I think overly optimistic. To give you some idea, in my case a good 12m video with 40k views has ~40% watchtime. And my most viewed podcastsaverage 12% of watchtime. So I'd say you're probably off by a factor of 3 for podcast viewer minutes.
Finally, for a couple of these podcasts the views are inflated because the podcasts are promoted via paid advertising. Some creators are quite open about it so you can ask them directly and they'll tell you. If you really want to know if the views are inflated one way to determine that is to look at the likes / view ratio. For instance, if a podcast has 20,000 views but 50 likes, the ratio is 0.25%. This is 20x to 40x too low (cf. here) for a non-promoted youtube with the same amount views. And if you look closely at a couple of these podcasts you listed you'll find exactly that. There is no problem in doing that (since it probably helps growth, and it's good to spend money to have more eyeballs), but if you're spending money to get views that are non-organic and viewers don't end up liking your video / engaging (and thus not driving organic reach) then your QAVM/$ is basically the cost of ads on youtube.
If we now look at youtube explainers:
You end up ranking Rational Animations at 8th position in QAVM/$, despite it having the most views. I find this quite surprising because in my opinion RA is the highest-production channel on the list, on par with AI in context. One factor is that you rate RA's quality of audience as 4, compared to 12 for Robert Miles. I understand this is because you had lots of conversations where Robert Miles name came up and people said he had influenced them.
However, I think Robert Miles' name comes up first in in people's minds primarily because he was the earliest AI safety YouTuber. He is also one of the only channels on the list that has his face in videos. So it's not surprising to me that many people in the community learned about AI Safety through him. The 3x score difference (in quality of audience) with RA seems too high.
Regarding your weights, you place both my TikTok and Youtube channel at 0.1 and 0.2 in quality, which I find surprising, especially Youtube:
Mysecond most watched video is an interview with Robert Miles, so it would be hard to argue that my content is 60x lower quality than Robert Miles’ own videos.
Similarly, for Cognitive Revolution, we were supposed to cross-post myEvan Hubinger interview to his platform, and ended up crossposting myOwain interview instead, so can we really say that his content is 12x higher quality if (in some cases) Nathan would be happy for the content to be literally the same?
Overall, I’m a bit disappointed by your data errors given that I replied to you by DM saying that your first draft missed a lot of important factors & data, and suggested helping you / delaying publication, which you refused.
Update: I've now estimated the quality for my long-form youtube content to be Q= 6*0.45*1 = 2.7 for Youtube, and Q=3*0.9*0.75=2.0Q = 3*0.45*0.75 = 1.0 for TikTok. See details here for Youtube, and here for TikTok. Using these updated weights (see "Michael's weights" here) I get this final table.
Hi Michael, sorry for coming back a bit late. I was flying out of SF
For costs, I'm going to stand strongly by my number here. In fact, I think it should be $26k. I treated everyone the same and counted the value of their time, at their suggested rate, for the amount of time they were doing their work. This affected everyone, and I think it is a much more accurate way to measure things. This affected AI Species and Doom Debates quite severely as well, more so than you as well as others. I briefly touched on this in the post, but I'll expand here. The goal of this exercise isn't to measure money spent vs output, but rather cost effectiveness per resource put in. If time is put in unpaid, this should be accounted for since it isn't going to be unpaid forever. Otherwise, there will be "gamed" cost effectiveness, where you can increase your numbers for a time by not paying yourself. Even if you never planned to take funding, you could spend your time doing other things, and thus there is still a tradeoff. It's natural/normal for projects at the start to be unpaid and apply for funding later, and for a few months of work to go unpaid. For example, I did this work unpaid, but if I am going to continue to do CEA for longtermist stuff, I will expect to be paid eventually.
In your case, your first TikTok was made on June 15, and given that you post ~1/day, I assume that you basically made the short on the same day. Given I made your calculations on Sept 9/10, that's 13 weeks. In your Manifund post, you are asking for $2k/week, and thus I take that to be your actual cost of doing work. I'm not simply measuring your "work done on the grant" and just accepting the time you did for free beforehand.
2. I'm happy to take data corrections. Undoubtedly, I have made some mistakes since not everyone responded to me, data is a bit messy, etc.
A) For the FLI podcast, I ran numbers for the whole channel, not just the podcast. That means their viewer minutes are calculated over the whole channel. They haven't gotten back to me yet so I hope to update their numbers when they do. I agree that their metrics have a wide error bar.
B) I was in the process of coming up with better estimates of viewer minutes based on video/podcast length but I stopped because people were responding to me, and I thought it better to just use accurate numbers. I stand by this decision, though I acknowledge the tradeoff.
C) If a video has "inflated" views due to paid advertising, that's fine. It shows up in the cost part of cost-effectiveness. For example, Cognitive Revolution, who does boosts their videos/advertising, that's part of their costs. I don't think its a problem that some viewers are paid for, maybe they see a video they otherwise wouldn't have. That's fine. I also acknowledge that others may feel differently about how this translates to impact. That said, no, this won't reduce QAVM/$ to simply the cost of ads. Ads just don't work very well without organic views.
3. For Rational Animations showing up low on the list, the primary reason for this is that they spend a boatload of money; nobody else comes close. I'm not saying that's bad. Its just a fact. They spend more than everyone else combined. Since, I am dividing by dollars, they get a lower VM/$ and thus QAVM/$.
If you wish, you can simply look at VM/$. They score low here too (8th, same as adjusted).
As for giving Robert Miles a high ranking, this came about because Austin really thought Dwarkesh was an AI safety YouTuber, and so I asked ~50 people different variants of the question "who is your favourite AI safety creator", "Which AI safety YouTubers did/do you watch", etc. It's hard to overstate this; Robert Miles was the first person EVERYONE mentioned. I found this surprising since, well, his view counts don't bear that out. Furthermore, 3 people told me that they work in AI safety because of his videos. I think there is a good case that his adjustment factors should be far HIGHER, not lower.
4. Regarding your weights. I encourage people (and did so in the post) to give their own weights to channels. For this exercise, I watched a lot of AI safety content to get a sense of what is out there. My quality weights were based on this (and discussions with Austin and others). I encourage you to consider each weight separately. Austin added the "total" quality factor at the end, I kinda didn't want it since I thought it could lead to this. For audience quality, I looked at things like TikTok viewership vs. YouTube/Apple Podcasts. For message fidelity, respectfully, you're just posting clips of other podcasts and such and this just doesn't do a great job of getting a message across. For fidelity of message, everyone but Rob Miles got <0.5 since I am comparing to Rob. With a different reference video, I would get different results. For Qm, your number is very similar to others but even still, I found the message to not be the best.
Again, most of the quality factor is being done by audience quality and yes, shorts just have a far lower audience quality.
On the data errors, as expressed above, I don't think I made data errors. I get the sense, while reading this, that you feel I was "out to get you" or something and was being willfully biased. I want to assure you that this wasn't the case. Lots of different creators have issues with how I decided to do this analysis, and in general, they wanted the analysis to be done in a way that would give them better numbers. I think that's human nature, partially, and also that they likely made their content with their assumptions in mind. In the end, I settled on this process as what I (and Austin) found to be the most reasonable, taken everything we learned into account. I am not saying my analysis is the be-all end-all and should dictate where Open Phil money goes tomorrow until further analysis is done.
I hope that explains/answers all your points. I am happy to engage further.
1) Feel free to use $26k. My main issue was that you didn't ask me for my viewer minutes for TikTok (EDIT: didn't follow up to make sure I give you the viewer minutes for TikTok) and instead used a number that is off by a factor of 10. Please use a correct number in future analysis. For June 15 - Sep 10, that's 4,150,000 minutes, meaning a VM/$ of 160 instead of 18 (details here).
A) Your screenshots of google sheets say "FLI podcast", but you ran your script on the entire channel. And you say that the budget is $500k. Can you confirm what you're trying to measure here? The entire video work of FLI? Just the podcast? If you're trying to get the entire channel, is the budget really $500k for the entire thing? I'm confused.
B) If you use accurate numbers for some things and estimate for others, I'd make sure to communicate explicitly about which ones are which. Even then, when you then compare estimates and real numbers there's a risk that your estimates are off by a a huge factor (has happened with my TikTok numbers), which makes me question the value of the comparisons.
C) Let me try to be clearer regarding paid advertising:
If some of the watchtime estimates you got from people are (views * 33% of length), and they pay $X per view (fixed cost of ads on youtube), then the VM/$ will be: [nb_views * (33% length) / total_cost] = [ nb_views * 33% length] / [nb_views * X] = [33% length / X]. Which is why I mean it's basically the cost of ads. (Note: I didn't include the organic views above because I'm assuming they're negligible compared to the inorganic ones. If you want me to give examples of videos where I see mostly inorganic views, I'll send you by DM).
For the cases where you got the actual watchtime numbers instead of multiplying the length by a constant or using a script (say, someone tells you they have Y amount of hours total on their channel), or the ads lead to real organic views, your reasoning around ads makes sense, though I'd still argue that in terms of impact the engagement is the low / pretty disastrous in some cases, and does not translate to things we care about (like people taking action).
3. I think the questions "who is your favourite AI safety creator" or "Which AI safety YouTubers did/do you watch" are heavily biased towards Robert Miles, as he is (and has basically been for the past 8 years) the only "AI Safety Youtuber" (like making purely talking head videos about AI Safety, in comparison, RA is a team). So I think based on these questions it's quite likely he'd be mentioned, though I agree 50 people saying his name first is important data that needs to be taken into account.
That said, I'm trying to wrap my head around how to go from your definition of "quality of audience" to "Robert Miles was chosen by 50 different people to be their favorite youtuber, as the first person mentioned". My interpretation is that you're saying: 1) you've spoken to 50 people who are people who work in AI Safety 2) they all mentioned Rob as the canonical Youtuber, so "therefore" A) Rob has the highest quality audience? (cf. you wrote in OP "This led me to make the “audience quality” category and rate his audience much higher.")
My model for how this claim could be true that 1) you asked 50 people who you all thought were "high quality" audience 2) they all mentioned rob and nobody else (or rarely nobody else), so 3) you inferred "high quality audience => watches Rob" and therefore 4) also inferred "watches Rob => high quality"?
4. Regarding weights, also respectfully, I did indeed look at them individually. You can check my analysis for what I think the TikTok individual weights should be here. For Youtube see here. Regarding your points:
I have posted in my analysis of tiktok a bunch of datapoints that you probably don't have about the fact that my audience is mostly older high-income people from richer countries, which is unusually good for TikTok. Which is why I put 3 instead of your 2.
"you're just posting clips of other podcasts and such and this just doesn't do a great job of getting a message across" -> the clips that end up making the majority of viewer minutes are actually quite high fidelity since they're quite long (2-4m long) and get the message more crisply than the average podcast minute. Anyway, once you look at my TikTok analysis you'll see that I ended up dividing everything by 2 to have the max fidelity tiktok have 0.5 (same as Cognitive Revolution), which means my number is Qf=0.45 at the end (instead of your 0.1) to just be coherent with the rest of your numbers.
Qm: that's subjective but FWIW I myself only align to 0.75 to my TikTok and not 1 (see analysis)
"Again, most of the quality factor is being done by audience quality and yes, shorts just have a far lower audience quality." --> again, respectfully, from looking at your tables I think this is false. You rank the fidelity of TikTok as 0.1, which is 5x less than 4 other channels. No other channels except my content (TikTok & YT) has less 0.3. In comparison, if you forget about rob's row, the audience quality varies only by 3x between my Qa for TikTok and the rest. So no, the quality factor is not mainly done by audience quality.
On 1, with your permission, I'd ask if I could share a screenshot of me asking you in DMs, directly, for viewer minutes. You gave me views, and thus I multiplied the average TikTok length and by a factor for % watched.
On A, yes, the FLI Podcast was perhaps the data point I did the most estimating for a variety of reasons I explained before.
On B, I think you can, in fact, find which are and aren't estimates though I do understand how it's not clear. We considered ways of doing this without being messy. Ill try to make it more clear.
On C, how much you pay for a view is not a constant though. It depends a lot on organic views. And I think boosting videos is a sensible strategy since you put $ into both production costs (time, equipment, etc.) and advertisement. FIguring out how to spend that money efficiently is important.
On 3, many other people were mentioned. In fact, I found a couple of creators this way. But yes, it was extremely striking and thus suggested that this was a very important factor in the analysis. I want to stress that I do in fact, think that this matters a lot. When Austin and I were speaking and relying on comparisons, we thought his quality numbers should be much higher in fact, we toned it down though maybe we shouldn't have.
To give clarity, I didn't seek people out who worked in AI safety. Here's what I did to the best of my recollection.
Over the course of 3 days, I asked anyone I saw in Mox who seemed friendly enough, as well as Taco Tuesday, and sent a few DMs to acquaintances. The DMs I sent were to people who work in AI safety, but there were only 4. So ~46 came from people hanging out around Mox and Taco Tuesday.
I will grant that this lends to an SF/AI safety bias. Now, Rob Miles' audience comes heavily from Computerphile and such whose audience is largely young people interested in STEM who like to grapple with interesting academic-y problems in their spare time (outside of school). In other words, this is an audience that we care a lot about reaching. It's hard to overstate the possible variance in audience "quality". For example, Jane Street pays millions to advertisers to get itself seen in front of potential traders on channels like Stand-Up Maths or the Dwarkesh podcast. These channels don't actually get that many views compared to others but they have a very high "audience quality", clearly, based on how much trading firms are willing to pay to advertise there. We actually thought a decent, though imperfect, metric for audience quality would just be a person's income compared to the world average of ~12k. This meant the average american would have an audience quality of 7. Austin and I thought this might be a bit too controversial and doesn't capture exaxctly what we mean (we care about attracking a poor MIT CS student more than a mid-level real estate developer in Miami) but it's a decent approximation.
Audience quality is roughly something like "the people we care most about reaching," and thus "people who can go into work on technical AI safety" seems very important.
Rob wasn't the only one mentioned, the next most popular were Cognitive Revolution and AI in context (people often said "Aric") since I asked them to just name anyone they listen to/would consider an AI safety youtuber, etc.
On 4, I greatly encourage people to input their own weights, I specifically put that in the doc and part of the reason for doing this project was to get people to talk about cost effectiveness in AI safety.
On my bias: Like all human beings, I'm flawed and have biases, but I did my best to just objectively look at data in what I thought the best way possible. I appreciate that you talked to others regarding my intentions.
I'll happily link to my comments on Manifund 123 you may be referring to for people to see the full comments and perhaps emphasize some points I wrote
@ I want to quickly note that it's a bit unfair for me to specifically only call you out on this or rather, that this is a thing I find with many AI safety projects. It just came up high on Manifund when I logged on for other reasons and saw donations from people I respect.
FWIW, I don't want to single you out, I have this kind of critique of many, many people doing AI safety work but this just seems like a striking example of it.
I didn't mean my comments to say "you should return this money". Lots of grants/spending in EA ecosystems I consider to be wasteful, ineffective etc. And again, apologies for singling you out on a gripe I have with EA funding.
Many people can tell you that I have a problem with the free-spending, lavish and often wasteful spending in the longtermist side of EA. I think I made it pretty clear that I was using this RFP as an example because other regrantors gave to it.
This project with Austin was planned to happen before you posted your RFP on Manifund (I can provide proof if you'd like).
I wasn't playing around with the weights to make you come out lower. I assure you, my bias is usually against projects I perceive to be "free-spending".
I think it's good/natural to try to create separation between evaluators/projects though.
For context, you asked me for data for something you were planning (at the time) to publish day-off. There's no way to get the watchtime easily on TikTok (which is why I had to do manual addition of things on a computer) and I was not on my laptop, so couldn't do it when you messaged me. You didn't follow up to clarify that watchtime was actually the key metric in your system and you actually needed that number.
Good to know that the 50 people were 4 Safety people and 46 people who hang at Mox and Taco Tuesday. I understand you're trying to reach the MIT-graduate working in AI who might somehow transition to AI Safety work at a lab / constellation. I know that Dwarkesh & Nathan are quite popular with that crowd, and I have a lot of respect for what Aric (& co) did, so the data you collected make a lot of sense to me. I think I can start to understand why you gave a lower score to Rational Animations or other stuff like AIRN.
I'm now modeling you as trying to answer something like "how do we cost-effectively feed AI Safety ideas to the kind of people who walk in at Taco Tuesday, who have the potential to be good AI Safety researchers". Given that, I can now understand better how you ended up giving some higher score to Cognitive Revolution and Robert Miles.
Your points seem pretty fair to me. In particular, I agree that putting your videos at 0.2 seems pretty unreasonable and out of line with the other channels - I would have guessed that you're sufficiently niche that a lot of your viewers are already interested in AI Safety! TikTok I expect is pretty awful, so 0.1 might be reasonable there
Agreed that the quality of audience is definitely higher for my (niche) AI Safety content on Youtube, and I'd expect Q to be higher for (longform) Youtube than Tiktok.
In particular, I estimate Q(The Inside View Youtube) = 2.7, instead of 0.2, with (Qa, Qf, Qm) = (6, 0.45, 1), though I acknowledge that Qm is (by definition) the most subjective.
To make this easier to read & reply to, I'll post my analysis for Q(The Inside View Tiktok) in another comment, which I'll link to when it's up. EDIT: link for TikTok analysis here.
The Inside View (Youtube) - Qa = 6
In light of @Drew Spartz's comment (saying one way to quantify the quality of audience would be to look at the CPM [1]), I've compiled my CPM Youtube data and my average Playback-based CPM is $14.8, which according to this website[2]would put my CPM above the 97.5 percentile in the UK, and close to the 97.5 percentile in the US.
Now, this is more anecdotal evidence than data-based, but I've met quite a few people over the years (from programs like MATS, or working at AI Safety orgs) who've told me they discovered AI Safety from my Inside View podcast. And I expect the SB-1047 documentary to have attracted a niche audience interested in AI regulation.
Given the above, I think it would make sense to have the Qa(Youtube) be between 6 (same as other technical podcasts) and 12 (Robert Miles). For the sake of giving a concrete number, I'll say 6 to be on par with other podcasts like FLI and CR.
The Inside View (Youtube) - Qf = 0.45
In the paragraph below I'll say Qf_M for the Qf that Marcus assigns to other creators.
For the fidelity of message, I think it's a bit of a mixed bag here. As I said previously, I expect the podcasts that Nathan would be willing to crosspost to be on par with his channel's quality, so in that sense I'd say the fidelity of message for these technical episodes (Owain Evans, Evan Hubinger) to be on par with CR (Qf_M = 0.5). Some of my non-technicalinterviews are probably closer to discussions we could find on Doom Debates (Qf_M = 0.4), though there are less of them. My SB-1047 documentary is probably similar in fidelity of message to AI in context (Qf_M = 0.5), and this fictional scenario is very similar to Drew's content (Qf_M = 0.5). I've also posted video explainers that range from low effort (Qf around 0.4?) to very high effort (Qf around 0.5?).
Given all of the above, I'd say the Qf for the entire channel is probably around 0.45.
The Inside View (Youtube) - Qm = 1
As you say, for the alignment of message, this is probably the most subjective. I think by definition the content I post is the message that aligns the most with my values (at least for my Youtube content) so I'd say 1 here.
The Inside View (Youtube) - Q = 2.7
Multiplying these numbers I get Q = 2.7. Doing a sanity check, this seems about the same as Cognitive Revolution, which doesn't seem crazy given we've interviewed similar people & the cross-post arguments I've said before.
(Obviously if I was to modify all of these Qa, Qf, Qm numbers for all channels I'd probably end up with different quality comparisons).
I haven't done extended research here and expect I'd probably get different results looking at different websites. This one was the first one I found on google so not cherry-picked.
This comment is answering "TikTok I expect is pretty awful, so 0.1 might be reasonable there". For my previous estimate on the quality of my Youtube long-form stuff, see this comment.
tl;dr: I now estimate the quality of my TikTok content to be Q = 0.75 * 0.45 * 3 = 1
To estimate fidelity of message (Qf) and alignment of message (Qm) in a systematic way, I compiled my top 10 most performing tiktoks and ranked their individual Qf and Qm (see tab called "TikTok Qa & Qf" here, which contains the reasoning for each individual number).
Update Sep 14: I've realized that my numbers about fidelity used 1 as the maximum, but now that I've looked at Marcus' weights for other stuff, I think I should use 0.5 because that's the number he gives to a podcast like Cognitive Revolution, and I don't want to claim that a long tiktok clip is more high-fidelity than the average Cognitive Revolution podcast. So I divided everything by 2 so my maximum fidelity is now 0.5 to match Marcus' other weights.
Then, by doing a minute-adjusted weighted average of the Qas and Qfs I get:
Qf(The Inside View TikTok) = 0.45
Qm(The Inside View TikTok) = 0.75
What this means:
Since I'm editing clips, the message is already high-fidelity (comes from the source, most of the time). The question is whether people will get a high-fidelity long explanation, or something short but potentially compressed. When weighing things by minute we end up with 0.9 meaning that most of the watchtime-minutes come from the high-fidelity content.
I am not always fully aligned with the clips that I post, but I am mostly aligned with them.
The Inside View (TikTok) - Quality of Audience = 3
I believe the original reasoning for Qa = 2 is that people watching short-form by default would be young and / or have short attention spans, and therefore be less of a high-quality audience.
However, most of my high-performing TikTok clips (that represent most of the watch time) are quite long (2m-3m30s long), which makes me think the kind of audience who watch these until the end are not as different from Youtube.
On top of that, my audience a) skews towards US (33%) or high-income countries (more than half are in US / Australian / UK etc.) and 88% of my audience being over 25, with 61% being above 35. (Data here).
Therefore, in terms of quality of audience, I don't see why the audience would be worse in quality than people who watch AI Species / AI Risk Network.
Which is why I'm estimating: Qa(The Inside View TikTok) = 3.
Conclusion
If we multiply these three numbers we get Q = 0.75 * 0.45 * 3 = 1
I struggle to imagine Qf 0.9 being reasonable for anything on TikTok. My understanding of TikTok is that most viewers will be idly scrolling through their feed, watch your thing for a bit as part of this endless stream, then continue, and even if they decide to stop for a while and get interested, they still would take long enough to switch out of the endless scrolling mode to not properly engage with large chunks of the video. Is that a correct model, or do you think that eg most of your viewer minutes come from people who stop and engage properly?
Update: after looking at Marcus' weights, I ended up dividing all the intermediary values of Qf I had by 2, so that it matches with Marcus' weights where Cognitive Revolution = 0.5. Dividing by 2 caps the best tiktok-minute to the average Cognitive Revolution minute. Neel was correct to claim that 0.9 was way too high.
===
My model is that most of the viewer minutes come from people who watch the all thing, and some decent fraction end up following, which means they'll end up engaging more with AI-Safety-related content in the future as I post more.
Looking at my most viewed TikTok:
TikTok says 15.5% of viewers (aka 0.155 * 1400000 = 217000) watched the entire thing, and most people who watch the first half end up watching until the end (retention is 18% at half point, and 10% at the end).
And then assuming the 11k who followed came from those 217000 who watched the whole thing, we can say that's 11000/217000 = 5% of the people who finished the video that end up deciding to see more stuff like that in the future.
So yes, I'd say that if a significant fraction (15.5%) watch the full thing, and 0.155*0.05 = 0.7% of the total end up following, I think that's "engaging properly".
And most importantly, most of the viewer-minutes on TikTok do come from these long videos that are 1-4 minutes long (especially ones that are > 2 minutes long):
The short / low-fidelity takes that are 10-20s long don't get picked up by the new tiktok algorithm, don't get much views, so didn't end up in that "TikTok Qa & Qs" sheet of top 10 videos (and for the ones that did, they didn't really contribute to the total minutes, so to the final Qf).
To show that the Eric Schimdt example above is not cherry-picked, here is a google docs with similar screenshots of stats for the top 10 videos that I use to compute Qf. From these 10 videos, 6 are more than 1m long, and 4 are more than 2 minutes long. The precise distribution is:
0m-1m: 4 videos
1m-2m: 2 videos
2m-3m: 2 videos
3m-4m: 2 videos
Happy for others to come up with different numbers / models for this, or play with my model through the "TikTok Qa & Qf" sheet here, using different intermediary numbers.
Update: as I said at the top, I was actually wrong to have initially said Qf=0.9 given the other values. I now claim that Qf should be closer to 0.45. Neel was right to make that comment.
Thanks for the thoughtful replies, here and elsewhere!
Very much appreciate data corrections! I think medium-to-long term, our goal is to have this info in some kind of database where anyone can suggest data corrections or upload their own numbers, like Wikipedia or Github
Tentatively, I think paid advertising is reasonable to include. Maybe more creators should be buying ads! So long as you're getting exposure in a cost-effective way and reaching equivalently-good people, I think "spend money/effort to create content" and "spend money/effort to distribute content" are both very reasonable interventions
I don't have strong takes on quality weightings -- Marcus is much more of a video junkie than me, and has spent the last couple weeks with these videos playing constantly, so I'll let him weigh in. But broadly I do expect people to have very different takes on quality -- I'm not expecting people to agree on quality, but rather want people to have the chance to put down their own estimates. (I'm curious to see your takes on all the other channels too!)
Sorry if we didn't include your feedback in the first post -- I think the nature of this project is that waiting for feedback from everyone is going to delay our output by too much, and we're aiming to post often and wait for corrections in public, mostly because we're extremely bandwidth constrained (running this on something like 0.25 FTE between Marcus and me)
I would be pretty shocked if paid ads reach equivalently good people, given that these are not people who have chosen to watch the video, and may have very little interest
Is the value of video really proportional to length? I think I'd rather 100M people watch a 2min intro than 4M people watch a 1hr deep dive, holding everything else constant. In general I expect diminishing marginal returns to longer content, as you say the most important things first.
It doesn't seem to me like your methodology is able to really support your claim that the top cost-effectiveness is not short-form videos; instead that's something that falls pretty directly out of the metric you chose.
I might prefer 100M people watch a 2-minute video than 4M watch a 1-hour video, but I'm not sure and I'm pretty sure I would take 5-6M people watching a 1hr video over 100M watching 2 min. What do you think the tradeoff is? I think it's sublinear but not very sublinear to the point that approximating as linear seemed fine.
I thought about this for a while, and what you are really trying to buy is engagement/thought or career change or protests or letters to the government, etc.. This is why in the future, article reads/book reads are going to be weighted higher. Since reading a book is more effortful/engaging than passively watching a video.
Actually, based on the metric, I adjusted for how much of the video is watched, not just views*minutes. Longer videos have a lower watch percentage and only the viewer minutes watched count.
I want to make a very weak claim that traditional-length Youtube videos 5-30 min are better. There just isn't a significant enough sample here. I think if a random person were to start making shorts vs. podcasts on a random topic, they'd get similar viewer minutes since you can make many more shorts in the time it takes to make a podcast, etc.
I have some intuitions in that direction (ie for a given individual to a topic, the first minute of exposure is more valuable than the 100th), and that would be the case for supporting things like TikToks.
I'd love to get some estimates on what the drop-off in value looks like! It might be tricky to actually apply - we/creators have individual video view counts and lengths, but no data on uniqueness of viewer (both for a single video and across different videos on the same channel, which I'd think should count as cumulative)
The drop-off might be less than your example suggests - it's actually very unclear to me which of those 2 I'd prefer.
AI safety videos can have impact by:
Introducing people to a topic
Convincing people to take an action (change careers, donate)
Providing info to people working in the field
And shortform does relatively better on 1 and worse on 2 and 3, imo.
A way you can quantify this is by looking at ad CPMs - how much advertisers are willing to pay for ads on your content.
This is a pretty objective metric for how much "influence" a creator has over their audience.
Podcasters can charge much more per view than longform Youtubers, and longform Youtubers can charge much more than shortform and so on.
This is actually understating it. It's incredibly hard for shortform only creators to make money with ads or sponsors.
There is clearly still diminishing returns per viewer minute, but the curve is not that steep.
Another question is not just what happens when the viewer is watching your content, but what happens after. The important part is not awareness but what people actually do as a result of that awareness.
Top of the funnel content like shortform is still probably useful, but I decided against doing it because short form creators famously have very little ability to influence their audience. They can't really get them to buy products, or join discords, let alone join a protest.
But podcasters and longform Youtubers certainly can, as evidenced by a large chunk of people in AI safety citing Rob Miles as their entry point.
Longform CPMs for YouTube’s ad platform are roughly $3-10 for every 1,000 views.
I don't really understand the CPM scaling between the length of videos. On my longest video of 40 minutes, I made roughly $7 per 1000 views. On my shortest video of 10 minutes, I made $4 per 1000 views. But that is just because Youtube shows more ads in that time. However, I'm not entirely sure how many ads they display per viewer per minute. I'm pretty sure the longer your content is the less ads they show per minute.
Sponsorships are usually 5-10x the ad CPM. So if you have a video that gets a million views, you could expect to make anywhere between $30-70k (but with wide error bars).
Shortform views are worth roughly 10-100x less on both ads and sponsorships.
It sounds pretty reasonable to me that a sponsorship on a longform video with 1 million views would convert more sales than a sponsorship on a shortform video with 100 million views.
Which is why you typically see almost every shortform creator struggling to break into longform, whereas longform creators can pretty easily make shorts without too much difficulty.
CPM is something I thought quite a bit about for audience quality. Someone like Dwarkesh Patel has a very high audience quality. Many billionaires, talented college kids, etc., watch. As expected, he gets to charge a ton for ad sponsorships.
Super excited to have this out; Marcus and I have been thinking about this for the last couple of weeks. We're hoping this is a first step towards getting public cost-effectiveness estimates in AI safety; even if our estimates aren't perfect, it's good to have some made-up numbers.
Other thoughts:
Before doing this, we might have guessed that it'd be most cost-effective to make many cheap, low effort-videos. AI in Context belies this; they've spent the most per video (>$100k/video vs $10-$20k that others) but still achieve strong QAVM/$
I think of Dwarkesh as perhaps being "too successful to be pigeonholed into 'AI safety'", but I still think his case is important because I expect media reach to be very heavy-tailed. Also, even if the vast minority of his content is safety-oriented, he has the strongest audience quality (with eg heads of state and megacorps on the record as fans)
Marcus chose to set Qa as 1 for "human chosen at random worldwide"; I think this might artificially inflate QAVM, and better baselines might be "random video watcher" (excluding the very poor) or "random US citizen". But I'm still unsure. Overall, we're more confident in the relative rankings, and less confident about what "1 QAVM" is worth.
One further goal I have is to establish impact valuations for different orgs/creators based on their "impact revenue". Perhaps before we published this, we should have polled some grantmakers or creators to see what they would have been excited to pay for 1 QAVM...
Before doing this, we might have guessed that it'd be most cost-effective to make many cheap, low effort-videos. AI in Context belies this; they've spent the most per video (>$100k/video vs $10-20kthatothers)butstillachievestrongQAVM/
I think this is an artifact of the way video views are weighted, for two reasons:
I suspect that impact is strongly sub-linear with minutes watched. The 100th minute watched for a particular viewer probably matters far less than the 1st minute watched. So judging impact by viewer-minutes over-rates long videos and under-rates short videos.
If I'm reading the code correctly, the actual viewer-minutes number is unknown, and was just assumed to be 33% for all videos. I strongly suspect that shorter videos have a higher % watch time. Sounds like the 33% number comes from talking to long-form video creators, so my guess is 33% is about accurate for long videos, but an underestimate for short videos.
Here are the results on views per dollar, rather than view-minutes per dollar:
(EDIT: apparently Markdown tables don't work and I can't upload screenshots to comments so here's my best attempt at a table. you can view the spreadsheet if this is too ugly)
Michael Trazzi (TikTok): $217
AI In Context (80k): $36
AI Species (Drew Spartz): $35
FLI podcast: $35
Cognitive Revolution: $23
The AI Risk Network: $8
Robert Miles AI Safety: $7
The Inside View: $7
Rational Animations: $5
Doom Debates: $1
For lack of any better way to do a weighting, I also tried ranking channels by the average of "views per dollar relative to average" and "view-minutes per dollar relative to average", i.e.: [(views per dollar) / (average views per dollar) + (view-minutes per dollar) / (average view-minutes per dollar)] / 2
Michael Trazzi (TikTok): 2.95
AI In Context (80k): 1.74
AI Species (Drew Spartz): 1.69
Cognitive Revolution: 1.16
FLI podcast: 1.07
The AI Risk Network: 0.60
The Inside View: 0.30
Robert Miles AI Safety: 0.21
Rational Animations: 0.17
Doom Debates: 0.08
I think this isn't a great weighting system because it ends up basically the same as ranking by views-per-dollar. That's because views-per-dollar are right-skewed with a few big positive outliers; whereas view-minutes-per-dollar are left-skewed with a few negative outliers. Ranking by geometric mean might make more sense.
Michael, when possible, I used the raw data from the creators for viewer minutes. The script was only used for people who didn't send data. I considered doing a lot more data analysis for the percentage of video watched vs. length of video, but as people started to respond to me, this felt unnecessary. I'm going to be editing documents and this post as new data comes in. I think it's probably a good norm to set that evaluators get creators to send them data, as it happens in the GHW space.
On the thought that impact is strongly sublinear per minute of video, I'd ask you to consider, when have you ever taken action due to a 0.1-1 min video? Compare this to a 10 min video and a 100 min podcast and now compare this to a book that takes ~1000 min to read.
Viewer minutes is a proxy for engagement. It's imperfect, and I expect further CEAs to go deeper, but I think viewer minutes scale slightly sublinearly, not strongly.
Thanks for this. I’ve read through the whole thing though haven’t thought about the numbers in depth yet. I’m hoping to write a forum post with my retrospective on the AI in Context video at some point!
A few quick thoughts which I imagine won’t be very new to people:
Comment and comment analysis could also be a proxy for engagement and quality of engagement
Someone said that it would be hard to predict future success from AI in context based only on our one big video and I strongly agree. We're hoping to release our next one in the next month, and I'm really excited about it but by default, we should expect a lot of regression to the mean. (Note: I wouldn't even think of us as having two videos. The other one is just a channel trailer we threw up to have something to introduce people to the channel.)
I like this question on the value of subsequent viewer minutes, and I don't currently have a take. I think some complicating factors are: - For one thing, it seems like a 5-minute video wouldn't do very well on YouTube, so it's not like it's really an option necessarily to make a lot of 5-minute videos relative to one 45-minute video, because 45-minute videos just have a niche. You might still want to make more 20-minute videos and fewer 45-minute videos. - I'm also not convinced that effort scales with time. Certainly editing time does, but often what you're trying to do (at least what we're trying to do) is tell a story and there's a certain length that allows you to tell the story. And so it's not convertible or fungible in the way that it might naively appear. - To the point above about telling a story, I think part of the value of a video is whether people come away with like an overall sense of what the video is about in a way that's memorable/the takeaways, and that might require telling a good story. Some stories might take 20 minutes to tell and some stories might take 45 minutes to tell. Maybe you want to focus on the stories that take less time to tell if it takes you a lot less time or money to make the video, but as I say I don't think effort scales that way for us.
For what it’s worth we’re not currently focused really heavily on getting to the right target audience. We’re currently doing product validation to just see if we know how to make good videos, but will be excited to think about that more in the future.
Yes, there is lots to consider and I don't want to suggest that my analysis is comprehensive or should be used as the basis for all future funding decisions for AI safety communications.
Very excited for the next AI in Context video.
I expect there to be lots of experimentation that naturally occurs with people doing what they feel is best and getting out the messages they find important. I am also slightly worried about goodharting and such, for obvious reasons. I think the analysis should be taken with a grain of salt. It's a first pass at this.
Edited to add TL;DR: If we assume all the quality factors are correct, I think these numbers overestimate my funding by a factor of 3.3, and don't seem to include my Computerphile videos, underestimating my impact by a factor of 3.8 to 4.5, depending what you want to count, in effect underestimating my cost effectiveness by a factor of 12.5 to 14.8
Oh, I somehow missed your messages, what platform were they on? Anyway, I haven't been keeping track of my grants very well, but I don't think my funding could possibly add up to $1M? My early stuff was self-funded, I only started asking for money in (I think) 2018, and that was only like $40k for a year IIRC. That went up over time obviously, but in retrospect I clearly should have been spending more money! I can try to go through the history of grants and figure it out.
Edit: Ok I just asked Deep Research and it says the total I've received is only ~300K total. I uh, I did think it was more than that, but apparently I am not good at asking for money.
Edit2: Also, which videos are you including for that ~32M minutes estimate? My total channel watch time is 773,130 hours, or 46,387,800 minutes. That doesn't include the Computerphile videos though, which are most of the view minutes. I'll see if I can collect them up.
Edit3: Ok, I got Claude to modify your script to use a list of video URLs I provided (basically all my Computerphile videos, excluding some that weren't really about AI), and that's an additional 97,285,888 estimated viewer minutes, for a total of 143,673,688. Or if you want to exclude my earliest stuff (which was I think impactful but wasn't really causally downstream of being funded), it's 74,841,928 for a total of 121,229,728.
For the $1m estimate, I think the figures were intended to include estimated opportunity cost foregone (eg when self-funding), and Marcus ballparked it at $100k/y * 10 years? But this is obviously a tricky calculation.
tbh, I would have assumed that the $300k through LTFF was not your primary source of funding -- it's awesome that you've produced your videos on relatively low budgets! (and maybe we should work on getting you more funding, haha)
Founder of the Existential Risk Observatory here. We've focused on informing the public about xrisk for the last four years. We mostly focused on traditional media, perhaps that's a good addition to the social media work discussed here.
We also focused on measuring our impact from the beginning. Here are afewof our EA forum posts detailing AI xrisk comms effectiveness.
We did not only measure exposure, but also effectiveness of our interventions, using surveys. Our main metric was the conversion rate (called Human Extinction Events indicator in our first paper), basically the percentage of people who changed their mind about whether AI is an existential risk after being exposed to our media intervention. Our average persistent conversion rate was 22%. I think this methodology would also be suitable to apply to social media work (and we applied it to some youtube videos already - results in the links above).
Our total conversion was around 1.8 million people (spreadsheet here). Using engagement times of 57 sec for short-form articles and 123 sec for long-form ones, we yield an effectiveness rate of 254 minute/$ (uncorrected for quality). I do think our views estimates here, that are mostly based on circulation figures, may be on the high side. On the other hand, I’d say quality of e.g. TIME, SCMP, or NRC articles should be expected to be better than average youtube content, but there may be outliers, and this will remain, to an extent, a matter of taste.
I hope it's useful to share these numbers and calculation methods publicly. I’m a big fan of trying to spend money on the most effective channels.
In the end, I think a strategy to reduce xrisk should hedge risks by not betting on one communication method only. I think it makes sense to spend some funding on the most effective social media work, some on the most effective traditional media work, and some on direct lobbying.
Marcus, Austin, thank you so much! This is exactly the sort of tools Effective Giving Initiatives sorely lack whenever they're asked about AI Safety (so far the answer was "well we spoke to an evaluator and they supported that org"). @Romain Barbe🔸 hopefully that'll inspire you!
On my side, I'd be happy to compare that to the cost- effectiveness of reaching out to established YouTubers and encouraging them to talk about a specific topic. I guess it can turn out more cost-effective, per intervention, than a full-blown channel. I'm unwilling to discuss it at length but France has some pretty impressive examples.
I'd ask you to consider, when have you ever taken action due to a 0.1–1 min video?
I think basically no one takes action from any video, even 30 min high quality YouTube videos.
But what you get when you have someone watch your 1 min video is that their feed will steer in that direction and they will see more videos from your channel and other AI Safety-aligned channels.
I think this might be where a lot of the value is.
If you can get 20M people to watch a few 45 second videos, you are making the idea more salient in their minds for future videos/discussions and are bending their feed in a good way.
If someone watches a 30 min YouTube video it's because they're already bought in to the idea and just want to stay abreast.
I would rather The Inside View get 20M 25 second views (8.3×10^6 mins) than The Cognitive Revolution get 500k 30 minute views (1.5×10^7 mins) because I think a lot of Cognitive Revolution viewers are already taking action or just enjoy the entertainment, etc.
On TikTok you might be the only AI Safety content someone sees (huge boost from literally 0 awareness for millions of people) while the marginal Cognitive Revolution video might expand the concept to like a thousand new people
Strong upvote great job (unusual for me for an AI safety post ha). I think within very specific domains like this, there's no reason at all why you can't do cost-effectiveness comparisons for AI safety. I would loosely estimate this to have similarish validity to many global health comparisons.
I love rational animations and show my friends their videos in groups - very subjectively I think you might have underrated their quality adjuster. But still I'm gobsmacked they have spent over 4 million dollars. If 80k can continue to produce videos even 1/10th as good as their first one for 100k though (about the same cost as each rational animations video), I would probably rather put my money there.
I also think 12x quality adjustment might be a bit of an overshoot for Robert Miles. Subjectively adjusting each view on one channel as being over 10x the value of another is a pretty big call and I can imagine if I was another video producer I might squint a bit....
I think that within AI safety, you can compare things to each other, even things as different as technical work and communications, and policy.
I think I may have done a poor job explaining the quality adjustments, the Qa quality adjustment is the quality adjustment of the audience compared to the average person in the world. I spoke to several people who told me they got into AI safety because of Rob and his audience is extremely nerdy and technical. Perhaps as an intuition pump, world GDP is ~12k and US GDP is about 86k per capita which could mean that the average American is worth ~7x the average person. Rob's channel is fairly technical, a lot come from Computerphile, etc. In fact, I wanted to give this a higher Qa than I did. Of course, GDP/capita is a bit crude but I think it's roughly correct for who we want to reach (though we want a bias towards say, computer science/math people). I think for any video that gets lots of views (>50k or so), it's hard to give numbers >100 but 12x feels too low once you do analysis. I gave all channels at least a 2x on this, just because people who watch videos have internet access + free time to consume video content and thus are above the global average (since the world average includes those who do and don't have internet and have free time) and clearly have some affinity to watch this kind of stuff
Nice analysis, this is the sort of thing I like to see. I have some ideas for potential improvements that don't require significant effort:
Alternative methods of evaluating videos, e.g. by view count rather than by view-minutes. I already did a bit of this in my other comment.
In that comment, I calculated channel rankings by views-per-dollar, and by an average of views-per-dollar + view-minutes-per-dollar.
You could also treat the value of a view as the logarithm of view-minutes, which feels about right to me. I couldn't calculate that from just the spreadsheet, I'd need to modify the Python script, but that still shouldn't be hard to do.
[ETA 3] Actually I'm not sure this is possible since I don't think there's a way to see view time for individual users. But maybe it's possible if you can see bucketed view times, e.g. "X people watched the video for 1 to 2 minutes"? Then you can take the logarithm of each bucket and get the average.
How many views are from new viewers, and how much is it "preaching to the converted"?
An easy heuristic: assign more value to views-above-expectation. For example if a channel routinely gets 10,000 views, assume most of those are coming from the same people, and discount them. But if one video gets 100,000 views, treat the extra 90,000 viewers as unique.
I believe YouTubers get data on how many views come from subscribers and how many new subscribers they get per video. You could discount views from pre-existing subscribers, and give full credit to views from non-subscribers and maybe extra credit to views that convert to a subscription.
[ETA] I would do a Bayesian adjustment based on the number of videos a channel has published. For example, AI in Context only has two videos and only one video with significant views, so it's hard to predict whether they will be able to reproduce that success. Whereas Rob Miles has tons of videos, so I have a pretty good idea of how many views his next video is going to get. You could use a Bayesian algorithm to assign greater confidence to channels with many videos. You could even use the variance on a channel's video views to calculate the posterior expected views (or view-minutes) on a new video.
[ETA 2] Look at channel growth over time, not just the average. Maybe fit an exponential curve to the view count and use that to predict the views on the next video. (Or combine this method with a Bayesian adjustment.)
Yes, lots to consider. I talked to a lot of people about how to measure impact, and yes, it's hard. This is, AFAIK, the first public attempt at cost-effectiveness for this stuff.
I disagree on things like log(minutes). Short-form content is consumed with incredibly low engagement and gets scrolled through extremely passively, for hours at a time, just like long-form content.
In terms of preaching to the converted, I think it takes a lot of engagement time to get people to take action. It seems to often take people 1-3 years of engagement with EA content to make significant career shifts, etc.
I'm measuring cost effectiveness thus far. Some people may overperform expectations, and some people may underperform.
As for measuring channel growth, I expect lots of people to make cases for why their channel will grow more compared to others and this would introduce a ton of bias. The fairest thing to do is to measure past impact. More importantly, when we compare to other places we use CEAs, we measure the impact that has happened, we don't just speculate (even with good assumptions) the impact that will occur in the future. Small grants/attempts are made and the ones that work, we scale up.
Doom Debates host here. I personally prefer to measure expected value by factoring in the possibility that the show continues to grow exponentially to become a big influencer of AI discourse in the near future :)
OP's ranking had Doom Debates at 3rd-from-bottom; I re-calculated the rankings in 3 different ways and Doom Debates came last in all of them. But I think this under-rates the expected value of Doom Debates because most of the value comes from the possibility that the channel blows up in the future.
This scoring system would also give “Nvidia” or “Lex Fridman” a low ranking based on Year 1 metrics - it’s the nature of scalable projects to make a large upfront investment in future results, and the methodology of matching up year 1 investment with year 1 results (and then comparing to another project’s year 1-10 investment with year 1-10 results) is a way to systematically rank projects higher when they’re later in their growth curve. Which could plausibly be what some people want to do, but it misses good early stage investment opportunities IMO.
Hey Liron! I think growth in viewership is a key reason to start and continue projects like Doom Debates. I think we're still pretty early in the AI safety discourse, and the "market" should grow, along with all of these channels.
I also think that there are many other credible sources of impact other than raw viewership - for example, I think you interviewing Vitalik is great, because it legitimizes the field, puts his views on the record, and gives him space to reflect on what actions to take - even if not that many people end up seeing the video. (compare irl talks from speakers eg at Manifest - much fewer viewers per talk but the theory of impact is somewhat different)
Thank you, Marcus and Austin - I found this post fascinating and a really useful exercise. I have some thoughts on how you could develop this further.
My main critique is that the current calculations focus a lot on consumption (watching a video) rather than impact (change in the world) - of course this is arguably pretty hard to do without loads of assumptions, but given that the current calcs still use qualitative assumptions, it might be worth trying this other angle.
I'd start sketching this out with a light touch logic model/theory of change, to map where input (money, time) lead to an outcome (hopefully, reduced AI risk). I think the main metric used here (quality-adjusted viewer-minutes) captures the beginning of this process, but would be interesting to go further. A simple logic model could look like:
Inputs: Cost (money, time) --> Outputs:Video created --> Outcomes:
Reach (views, viewer-minutes)
Engagement (likes, shares, Comments)
Change in knowledge/attitude (Comprehension, shift in prioriites)
Change in behaviour (clicks links, donates, starts a project, discusses with policymakers) -->
Impact: Reduced AI risk
I think currently you're using some assumptions to essentially derive comprehension, but there's not much in your calcs about engagement or behaviour change. I think it would be useful to try to measure these.
For instance, you could add in:
A way to calculate network effects/virality:
Watching is not the only way to engage with a video - sharing with a wider network creates a number of positive externalities, reaching people who wouldn't have already been in the niche sphere of the youtube channel (but might equally be high-quality, interested in the topic, just missed by the algorithm), increasing the channel's social stance/prominence, growing the audience, etc.
To measure this you could use the API to include counts of shares, likes, comments as a measure of engagement.
I'd argue this would be a better way to measure quality and resonance as well, rather than using more subjective measures for things like message fidelity, quality of audience - you could use shares, likes, comments as a way to measure a highly engaged audience / audience activation.
You could also argue that views from shares cost a channel less than direct views because the audience did the marketing for them.. but maybe that complicates things too much.
Account for the fact that videos keep being watched:
In theory, successful videos have an upfront cost but then could keep being watched over time, even for a number of years, and so continue to generate a stream of value (views and influence) with marginal cost.
For this, you could include the video viewership decay rate over time - is it just a short burst or does it have a long tail for consistent views? Can you use this to assign a longevity score to videos? This helps minimise the fact that your current analysis is a snapshot, but many of these videos (though not all) will keep racking up views.
Measure the impact of spillovers/brand reputation:
Videos are of course intended to reach an audience, but they also increase brand reputation (e.g. your example of Rob Miles known by everyone). Building up the creator's influence means that it can be used for other high-impact activities e.g. podcast appearances, authoring news articles, briefings with policymakers.
I think for this it would be good to track creator-level outcomes. How many collaborations/speaking gigs/media mentions result from the channel's success (i.e. after videos were made)?
The hardest thing to measure is behaviour change..
While I think shares/likes/overtime engagement/public standing of youtuber could all be some sort of proxy for macro-behaviour change, ideally you'd try to measure things like..
Did the video drive clicks to AI safety career resource (e.g. for 80K)?
Anyone doing post-video surveys that could be factored in?
Did the video creator get more DMs about offers to help?
Given that you reached out to the creators with other questions, you could have included some of these to get a better sense of behaviour change.
Anyway, these are just some thoughts, but hope you'll find at least some of them useful.
Thanks again for sharing this post, really interesting and I'm excited to see how it evolves.
And yet, while much interest, funding, and resources in EA have shifted towards AI safety, it’s rare to see any cost-effectiveness calculations. The focus on AI safety is based on vague philosophical arguments that the future could be very large and valuable, and thus whatever is done towards this end is worth orders of magnitude more than most short-term effects.
I agree there should be more cost effectiveness analyses for AI. These two papers have a high level cost effectiveness of AI safety for improving the long-run future, rather than evaluating individual orgs (based on Oxford Prioritisation Project work). More recently, there is Rethink’s work with a DALYs/$1000 calculation.
One q: why is viewer minutes a metric we should care about? QAVMs seems importantly different from QALYs/DALYs, in that the latter matter intrinsically (ie, they correspond to suffering associated with disease). But viewer minutes only seem to matter if they’re associated with some other, downstream outcome (Advocacy? Donating to AI safety causes? Pivoting to work on this?). By analogy, QAVMs seems akin to “number of bednets distributed” rather than something like “cases of malaria averted” or “QALYs.”
The fact that you adjust for quality of audience seems to suggest a ToC in the vein of advocacy or pivoting, but I think this is actually pretty important to specify, because I would guess the theory of change for these different types of media (eg, TikToks vs long form content) is quite different, and one unit of QAVM might accordingly translate differently into impact.
It received 507,000 views, and at 27 minutes long, if the average viewer watched 1/3 of it, then that's 507,000*27*1/3=4,563,000 VM.
I don't recall whether the $20,000 Grand Prize it received was enough to reimburse Suzy for her cost to produce it and pay for her time, but if so, that'd be 4,563,000VM/$20,000=228 VM/$.
Not sure how to do the quality adjustment using the OP framework, but naively my intuition is that short films like this one are more effective at changing peoples' minds on the importance of the problem per minute than average videos of the AI Safety channels. How valuable it is probably depends mostly on how valuable shifting the opinion of the general public is. It's not a video that I'd expect to create AI safety researchers, but I expect it did help shift the Overton window on AI risk.
Agreed about the need to include Suzy Shepherd and Siliconversations.
Before Marcus messaged me I was in the process of filling another google sheets (link) to measure the impact of content creators (which I sent him) which also had like three key criteria (production value, usefulness of audience, accuracy).
I think Suzy & Siliconversations are great example of effectiveness because:
I think Suzy did her film for really cheap (less than $20k). Probably if you included her time you'd get a larger amount, but in terms of actual $ spent and the impact it got (400k views on longform content) I think it's pretty great, and I think quite educational. In particular, it providesanother angle to how to explain things, through some original content. In comparison, a lot of the AI 2027 content has been like amplifying an idea that was already in the world and covered by a bunch of people. Not sure how to compare both things but it's worth noting they're different.
Siliconversations is I think an even more powerful example, and one of the reasons why I wanted to make that google sheets. After talking to folks at ControlAI, his videos about emailing representatives lead to many more emails sent to representatives than another Control AI x Rational Animations collaboration, even though RA is a much bigger channel than Siliconversations (and especially at the time Siliconversations first posted his video). The ratio of CTA per views is at least 2.5% given the 2000 emails from 80k views (source).
The thing I wanted to measure (which I think is probably a bit much harder than just estimating things with weights then multiplying by minutes of watchtime) is "what kind of content leads more people to take action like Siliconversations", and I'm not sure how to measure that except if everyone had CTAs that they tracked and we could compare the ratios.
The reason I think Siliconversations' video lead to so many emails was that he was actually relentless in this video about sending emails, and that was the entire point of the video, instead of like talking about AI risk in general, and having a link in the comments.
I think this is also why that RA x ControlAI collab got less emails, but it also got way more views that potentially in the future will lead to a bunch of people that will do a lot of useful things in the world, though that's hard to measure.
I know that 80k's AI In Context has a full section at the end on "What to do" saying to look at the links in description. Maybe Chana Mesinger has data on how many people clicked on how much traffic was redirected from YT to 80k.
Very cool! No reply needed/expected, just sharing a few misc reflections:
I didn't follow the reason for excluding Dwarkesh; you already have quality adjustments multipliers so you can just include him and apply the adjustments. (Id be interested to see, since I think it's relevant, he has an influential audience, and he has solid revenue, which I think will lead to high cost-effectiveness in your model.)
In the other direction: I'm not sure if your goal was to compare most cost-effective opportunities among current/established YouTubers, but if you're trying to evaluate the cost-effectiveness of the overall intervention instead/as well, then you'll of course need to account for efforts that started but collapsed or didn't gain much traction.
Cool to see this analysis here though, and will likely be a useful reference/comparison for some apps that the EA Infrastructure Fund gets!
Marcus and Austin, thank you for this research. Bringing more rigour to AI safety communications is so important.
Marcus, in the comments you say what you want from a video is “engagement/thought [i.e. learning effectiveness] or career change or protests or letters to the government, etc [i.e. call to action effectiveness]. This is why in the future, article reads/book reads are going to be weighted higher. Since reading a book is more effortful/engaging than passively watching a video.”
I’d like here to suggest that NON-passive video watching is technically easy and works well for certain educational use cases. However, it’s extremely rare - and indeed it's not mentioned in your post or any of the comments. But perhaps you could add it to your list of non-passive media to investigate next?
Why bother? Well, let’s look at the effectiveness of YouTube…
1 – YouTube is an ad medium that measures exposure, not effectiveness * The post sets out to measure how “cost-effective” AI safety YouTube videos are, which is a great goal. However, YT offers zero data on learning effectiveness — whether viewers understood, updated beliefs, or changed behavior. Thus all that can be measured is cost and watch-time. Not “effectiveness”. * As has been pointed out, comment and comment analysis could be a proxy for quality of engagement; as well as citations of videos, likes, shares, stories of people taking action because of seeing a video etc. But these are all very hard to measure and quantify. I've certainly watched great videos without commenting on them. And we all know the quality of YT comments is wildly variable. ("YouTube comments are the Star Wars Cantina of the internet" as someone once said.) * Therefore IMHO, a more accurate title would really be “What is the cost per view of AI Safety YouTubers?” * This is NOT a criticism of the post - it’s inherent in the nature of YouTube, which is an advertising medium not an education medium: advertisers don’t care whether you understand a YT video, they just want their ad to be seen. But this fact is widely overlooked.
* So does this mean we abandon video? No - there are ways to use video combined with interactivity to make it possible to directly measure learning effectiveness.
2 – Some non-passive video formats actually do measure learning effectiveness
* Participatory interactive video-based workshops (like AI Basics: Thrills or Chills?) use interactivity to measure learning effectiveness directly. * Example: participants answer "How important is the AI revolution?" at the start and end of the workshop. Average figures are: * Start: ~20% Internet-level, ~70% Industrial Revolution-level, ~10% Evolution of humans-level * end: ~0% Internet-level, ~60% Industrial Revolution-level, ~40% Evolution of humans-level * This shows clear belief updates in high-quality audiences (Cornell, Cambridge, UK Cabinet Office). This demonstrates effectiveness in changing understanding—data that's unavailable from regular YouTube videos.
* Medical education example: A gamified interactive video-based CPR training system (Lifesaver) showed 29% better outcomes than traditional face-to-face training in peer-reviewed medical research when learners were tested 6 months after training. Cost per session about 0.03% of the cost of f2f training. More than 1m people trained since launch. * Again, this is measuring learning effectiveness rather than just views; apparently “many lives” have been saved by people who learned from Lifesaver but data has not been published.
* Due disclosure: I made both of these projects so obviously I’m not impartial. But I made them precisely because I wanted to make video more effective in training.
* Neither of these projects are on YouTube - so could an interactive approach like this work at scale there?
3 – It would be possible to do learning effectiveness measurement at scale with a non-passive YouTube video - but this is currently neglected
* Adapting interactivity to YouTube is technically straightforward - see for example the comic branching YT video “In Space with Markiplier”. Here the choices are just for fun; but as AI Basics shows, such choices can be meaningful. * Such an approach could enable learning effectiveness measurement at scale on YT—tracking what people think and learn. Thus combining YouTube's massive reach with genuine learning outcome data. * The main barrier is conceptual, not technical. Most creators and funders lack experience with interactive video, making this obvious step seem foreign. But without it, you’re just measuring views - not effectiveness. * Such a project would be novel but would at least make it possible to assess cost-effectiveness in learning impact.
Sorry to have gone on at such length - overall, I think using video in a non-passive way could offer a way towards measurable effectiveness, as well as reach. And research on this little-used approach would be very useful! Marcus and Austin, thanks again for raising the vital but usually ignored question of "effectiveness" in AI safety communications on YouTube!
AI Use Note: Main body text entirely human written. Claude (Opus 4.8) helped develop models of animal life histories in the appendix.
Cross-posted from Good Structures.
Executive Summary
* Animal advocates sometimes make claims like “there are X of this animal...
“How long have you been v*g*n?”
This is one of the most common icebreakers at animal protection events. It’s a baseline assumption, and it mostly holds true: if you’re out advocating for animals not to be tortured or abused, realistically these days you are v**n, or close. And it makes for good conversation. It seems fairly safe to assume when you meet strangers.
But this assumption is hurting the movement in a way which we don’t always notice: someone new comes into the sp...
Summary
Back in November 2023 I posted here to launch Spiro and raise our first $198k. Two and a half years later this is an update and a fundraiser for the next step.
The short version: we've now reached over-5,900 people with TB preventive medicine, including over 3,000 children under five years old. Our early results have held up well an...

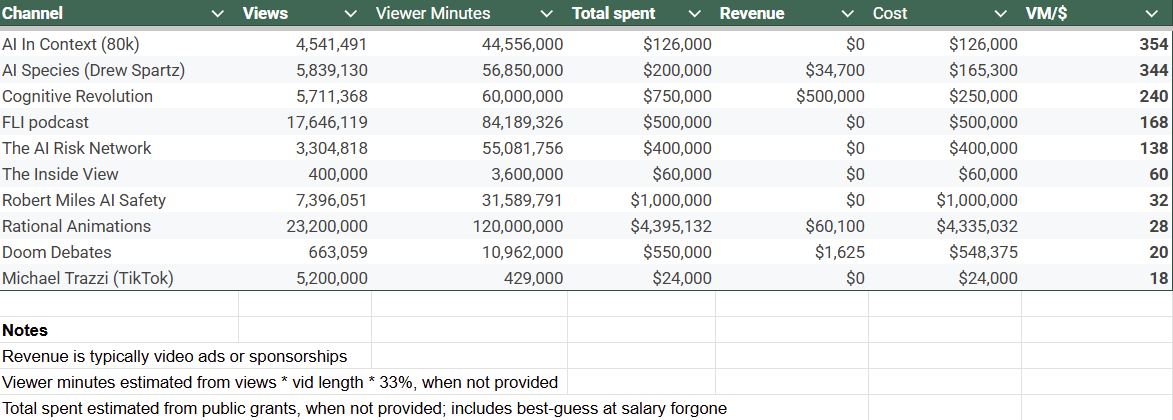
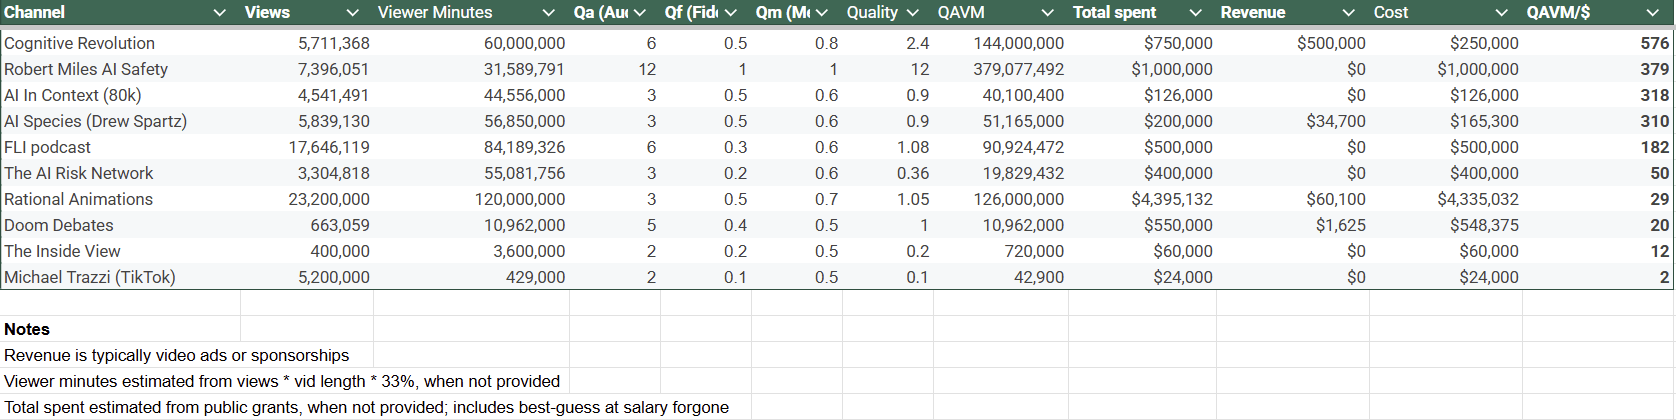
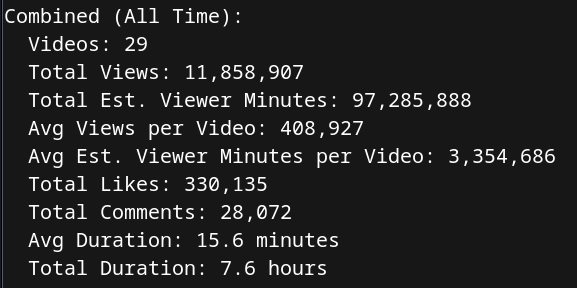
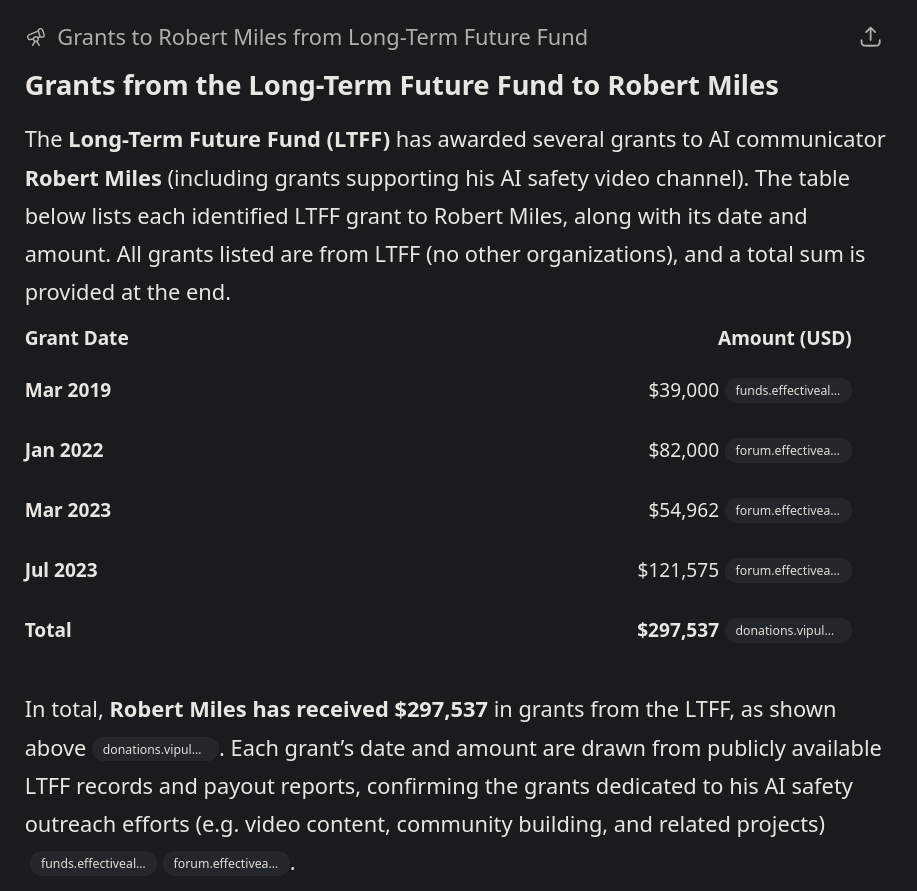

Thank you both for doing this, I appreciate the effort in trying to get some estimates.
However, I would like to flag that your viewer minute numbers for my short-form content are off by an order of magnitude. And I've done 4 full weeks on the Manifund grant, so it's 4 * $2k = $8k, not $24k.
Plugging these numbers in (google sheets here) I get a QAVM/$ of 389 instead of the 18 you have listed.
Other data corrections:
If we now look at youtube explainers:
Regarding your weights, you place both my TikTok and Youtube channel at 0.1 and 0.2 in quality, which I find surprising, especially Youtube:
Overall, I’m a bit disappointed by your data errors given that I replied to you by DM saying that your first draft missed a lot of important factors & data, and suggested helping you / delaying publication, which you refused.
Update: I've now estimated the quality for my long-form youtube content to be Q= 6*0.45*1 = 2.7 for Youtube, and
Q=3*0.9*0.75=2.0Q = 3*0.45*0.75 = 1.0 for TikTok. See details here for Youtube, and here for TikTok. Using these updated weights (see "Michael's weights" here) I get this final table.Hi Michael, sorry for coming back a bit late. I was flying out of SF
For costs, I'm going to stand strongly by my number here. In fact, I think it should be $26k. I treated everyone the same and counted the value of their time, at their suggested rate, for the amount of time they were doing their work. This affected everyone, and I think it is a much more accurate way to measure things. This affected AI Species and Doom Debates quite severely as well, more so than you as well as others. I briefly touched on this in the post, but I'll expand here. The goal of this exercise isn't to measure money spent vs output, but rather cost effectiveness per resource put in. If time is put in unpaid, this should be accounted for since it isn't going to be unpaid forever. Otherwise, there will be "gamed" cost effectiveness, where you can increase your numbers for a time by not paying yourself. Even if you never planned to take funding, you could spend your time doing other things, and thus there is still a tradeoff. It's natural/normal for projects at the start to be unpaid and apply for funding later, and for a few months of work to go unpaid. For example, I did this work unpaid, but if I am going to continue to do CEA for longtermist stuff, I will expect to be paid eventually.
In your case, your first TikTok was made on June 15, and given that you post ~1/day, I assume that you basically made the short on the same day. Given I made your calculations on Sept 9/10, that's 13 weeks. In your Manifund post, you are asking for $2k/week, and thus I take that to be your actual cost of doing work. I'm not simply measuring your "work done on the grant" and just accepting the time you did for free beforehand.
2. I'm happy to take data corrections. Undoubtedly, I have made some mistakes since not everyone responded to me, data is a bit messy, etc.
A) For the FLI podcast, I ran numbers for the whole channel, not just the podcast. That means their viewer minutes are calculated over the whole channel. They haven't gotten back to me yet so I hope to update their numbers when they do. I agree that their metrics have a wide error bar.
B) I was in the process of coming up with better estimates of viewer minutes based on video/podcast length but I stopped because people were responding to me, and I thought it better to just use accurate numbers. I stand by this decision, though I acknowledge the tradeoff.
C) If a video has "inflated" views due to paid advertising, that's fine. It shows up in the cost part of cost-effectiveness. For example, Cognitive Revolution, who does boosts their videos/advertising, that's part of their costs. I don't think its a problem that some viewers are paid for, maybe they see a video they otherwise wouldn't have. That's fine. I also acknowledge that others may feel differently about how this translates to impact. That said, no, this won't reduce QAVM/$ to simply the cost of ads. Ads just don't work very well without organic views.
3. For Rational Animations showing up low on the list, the primary reason for this is that they spend a boatload of money; nobody else comes close. I'm not saying that's bad. Its just a fact. They spend more than everyone else combined. Since, I am dividing by dollars, they get a lower VM/$ and thus QAVM/$.
If you wish, you can simply look at VM/$. They score low here too (8th, same as adjusted).
As for giving Robert Miles a high ranking, this came about because Austin really thought Dwarkesh was an AI safety YouTuber, and so I asked ~50 people different variants of the question "who is your favourite AI safety creator", "Which AI safety YouTubers did/do you watch", etc. It's hard to overstate this; Robert Miles was the first person EVERYONE mentioned. I found this surprising since, well, his view counts don't bear that out. Furthermore, 3 people told me that they work in AI safety because of his videos. I think there is a good case that his adjustment factors should be far HIGHER, not lower.
4. Regarding your weights. I encourage people (and did so in the post) to give their own weights to channels. For this exercise, I watched a lot of AI safety content to get a sense of what is out there. My quality weights were based on this (and discussions with Austin and others). I encourage you to consider each weight separately. Austin added the "total" quality factor at the end, I kinda didn't want it since I thought it could lead to this. For audience quality, I looked at things like TikTok viewership vs. YouTube/Apple Podcasts. For message fidelity, respectfully, you're just posting clips of other podcasts and such and this just doesn't do a great job of getting a message across. For fidelity of message, everyone but Rob Miles got <0.5 since I am comparing to Rob. With a different reference video, I would get different results. For Qm, your number is very similar to others but even still, I found the message to not be the best.
Again, most of the quality factor is being done by audience quality and yes, shorts just have a far lower audience quality.
On the data errors, as expressed above, I don't think I made data errors. I get the sense, while reading this, that you feel I was "out to get you" or something and was being willfully biased. I want to assure you that this wasn't the case. Lots of different creators have issues with how I decided to do this analysis, and in general, they wanted the analysis to be done in a way that would give them better numbers. I think that's human nature, partially, and also that they likely made their content with their assumptions in mind. In the end, I settled on this process as what I (and Austin) found to be the most reasonable, taken everything we learned into account. I am not saying my analysis is the be-all end-all and should dictate where Open Phil money goes tomorrow until further analysis is done.
I hope that explains/answers all your points. I am happy to engage further.
ask me for my viewer minutes for TikTok(EDIT: didn't follow up to make sure I give you the viewer minutes for TikTok) and instead used a number that is off by a factor of 10. Please use a correct number in future analysis. For June 15 - Sep 10, that's 4,150,000 minutes, meaning a VM/$ of 160 instead of 18 (details here).On 1, with your permission, I'd ask if I could share a screenshot of me asking you in DMs, directly, for viewer minutes. You gave me views, and thus I multiplied the average TikTok length and by a factor for % watched.
On A, yes, the FLI Podcast was perhaps the data point I did the most estimating for a variety of reasons I explained before.
On B, I think you can, in fact, find which are and aren't estimates though I do understand how it's not clear. We considered ways of doing this without being messy. Ill try to make it more clear.
On C, how much you pay for a view is not a constant though. It depends a lot on organic views. And I think boosting videos is a sensible strategy since you put $ into both production costs (time, equipment, etc.) and advertisement. FIguring out how to spend that money efficiently is important.
On 3, many other people were mentioned. In fact, I found a couple of creators this way. But yes, it was extremely striking and thus suggested that this was a very important factor in the analysis. I want to stress that I do in fact, think that this matters a lot. When Austin and I were speaking and relying on comparisons, we thought his quality numbers should be much higher in fact, we toned it down though maybe we shouldn't have.
To give clarity, I didn't seek people out who worked in AI safety. Here's what I did to the best of my recollection.
Over the course of 3 days, I asked anyone I saw in Mox who seemed friendly enough, as well as Taco Tuesday, and sent a few DMs to acquaintances. The DMs I sent were to people who work in AI safety, but there were only 4. So ~46 came from people hanging out around Mox and Taco Tuesday.
I will grant that this lends to an SF/AI safety bias. Now, Rob Miles' audience comes heavily from Computerphile and such whose audience is largely young people interested in STEM who like to grapple with interesting academic-y problems in their spare time (outside of school). In other words, this is an audience that we care a lot about reaching. It's hard to overstate the possible variance in audience "quality". For example, Jane Street pays millions to advertisers to get itself seen in front of potential traders on channels like Stand-Up Maths or the Dwarkesh podcast. These channels don't actually get that many views compared to others but they have a very high "audience quality", clearly, based on how much trading firms are willing to pay to advertise there. We actually thought a decent, though imperfect, metric for audience quality would just be a person's income compared to the world average of ~12k. This meant the average american would have an audience quality of 7. Austin and I thought this might be a bit too controversial and doesn't capture exaxctly what we mean (we care about attracking a poor MIT CS student more than a mid-level real estate developer in Miami) but it's a decent approximation.
Audience quality is roughly something like "the people we care most about reaching," and thus "people who can go into work on technical AI safety" seems very important.
Rob wasn't the only one mentioned, the next most popular were Cognitive Revolution and AI in context (people often said "Aric") since I asked them to just name anyone they listen to/would consider an AI safety youtuber, etc.
On 4, I greatly encourage people to input their own weights, I specifically put that in the doc and part of the reason for doing this project was to get people to talk about cost effectiveness in AI safety.
On my bias:
Like all human beings, I'm flawed and have biases, but I did my best to just objectively look at data in what I thought the best way possible. I appreciate that you talked to others regarding my intentions.
I'll happily link to my comments on Manifund 1 2 3 you may be referring to for people to see the full comments and perhaps emphasize some points I wrote
Many people can tell you that I have a problem with the free-spending, lavish and often wasteful spending in the longtermist side of EA. I think I made it pretty clear that I was using this RFP as an example because other regrantors gave to it.
This project with Austin was planned to happen before you posted your RFP on Manifund (I can provide proof if you'd like).
I wasn't playing around with the weights to make you come out lower. I assure you, my bias is usually against projects I perceive to be "free-spending".
I think it's good/natural to try to create separation between evaluators/projects though.
For context, you asked me for data for something you were planning (at the time) to publish day-off. There's no way to get the watchtime easily on TikTok (which is why I had to do manual addition of things on a computer) and I was not on my laptop, so couldn't do it when you messaged me. You didn't follow up to clarify that watchtime was actually the key metric in your system and you actually needed that number.
Good to know that the 50 people were 4 Safety people and 46 people who hang at Mox and Taco Tuesday. I understand you're trying to reach the MIT-graduate working in AI who might somehow transition to AI Safety work at a lab / constellation. I know that Dwarkesh & Nathan are quite popular with that crowd, and I have a lot of respect for what Aric (& co) did, so the data you collected make a lot of sense to me. I think I can start to understand why you gave a lower score to Rational Animations or other stuff like AIRN.
I'm now modeling you as trying to answer something like "how do we cost-effectively feed AI Safety ideas to the kind of people who walk in at Taco Tuesday, who have the potential to be good AI Safety researchers". Given that, I can now understand better how you ended up giving some higher score to Cognitive Revolution and Robert Miles.
Your points seem pretty fair to me. In particular, I agree that putting your videos at 0.2 seems pretty unreasonable and out of line with the other channels - I would have guessed that you're sufficiently niche that a lot of your viewers are already interested in AI Safety! TikTok I expect is pretty awful, so 0.1 might be reasonable there
Agreed that the quality of audience is definitely higher for my (niche) AI Safety content on Youtube, and I'd expect Q to be higher for (longform) Youtube than Tiktok.
In particular, I estimate Q(The Inside View Youtube) = 2.7, instead of 0.2, with (Qa, Qf, Qm) = (6, 0.45, 1), though I acknowledge that Qm is (by definition) the most subjective.
To make this easier to read & reply to, I'll post my analysis for Q(The Inside View Tiktok) in another comment, which I'll link to when it's up. EDIT: link for TikTok analysis here.
The Inside View (Youtube) - Qa = 6
In light of @Drew Spartz's comment (saying one way to quantify the quality of audience would be to look at the CPM [1]), I've compiled my CPM Youtube data and my average Playback-based CPM is $14.8, which according to this website [2] would put my CPM above the 97.5 percentile in the UK, and close to the 97.5 percentile in the US.
Now, this is more anecdotal evidence than data-based, but I've met quite a few people over the years (from programs like MATS, or working at AI Safety orgs) who've told me they discovered AI Safety from my Inside View podcast. And I expect the SB-1047 documentary to have attracted a niche audience interested in AI regulation.
Given the above, I think it would make sense to have the Qa(Youtube) be between 6 (same as other technical podcasts) and 12 (Robert Miles). For the sake of giving a concrete number, I'll say 6 to be on par with other podcasts like FLI and CR.
The Inside View (Youtube) - Qf = 0.45
In the paragraph below I'll say Qf_M for the Qf that Marcus assigns to other creators.
For the fidelity of message, I think it's a bit of a mixed bag here. As I said previously, I expect the podcasts that Nathan would be willing to crosspost to be on par with his channel's quality, so in that sense I'd say the fidelity of message for these technical episodes (Owain Evans, Evan Hubinger) to be on par with CR (Qf_M = 0.5). Some of my non-technical interviews are probably closer to discussions we could find on Doom Debates (Qf_M = 0.4), though there are less of them. My SB-1047 documentary is probably similar in fidelity of message to AI in context (Qf_M = 0.5), and this fictional scenario is very similar to Drew's content (Qf_M = 0.5). I've also posted video explainers that range from low effort (Qf around 0.4?) to very high effort (Qf around 0.5?).
Given all of the above, I'd say the Qf for the entire channel is probably around 0.45.
The Inside View (Youtube) - Qm = 1
As you say, for the alignment of message, this is probably the most subjective. I think by definition the content I post is the message that aligns the most with my values (at least for my Youtube content) so I'd say 1 here.
The Inside View (Youtube) - Q = 2.7
Multiplying these numbers I get Q = 2.7. Doing a sanity check, this seems about the same as Cognitive Revolution, which doesn't seem crazy given we've interviewed similar people & the cross-post arguments I've said before.
(Obviously if I was to modify all of these Qa, Qf, Qm numbers for all channels I'd probably end up with different quality comparisons).
CPM means Cost Per Mille. In YT Studio it's defined as "How much advertisers pay every thousand times your Watch Page content is viewed with ads."
I haven't done extended research here and expect I'd probably get different results looking at different websites. This one was the first one I found on google so not cherry-picked.
I answered Michael directly on the parent. Hopefully, that gives some colour.
This comment is answering "TikTok I expect is pretty awful, so 0.1 might be reasonable there". For my previous estimate on the quality of my Youtube long-form stuff, see this comment.
tl;dr: I now estimate the quality of my TikTok content to be Q = 0.75 * 0.45 * 3 = 1
The Inside View (TikTok) - Alignment = 0.75 & Fidelity = 0.45
To estimate fidelity of message (Qf) and alignment of message (Qm) in a systematic way, I compiled my top 10 most performing tiktoks and ranked their individual Qf and Qm (see tab called "TikTok Qa & Qf" here, which contains the reasoning for each individual number).
Update Sep 14: I've realized that my numbers about fidelity used 1 as the maximum, but now that I've looked at Marcus' weights for other stuff, I think I should use 0.5 because that's the number he gives to a podcast like Cognitive Revolution, and I don't want to claim that a long tiktok clip is more high-fidelity than the average Cognitive Revolution podcast. So I divided everything by 2 so my maximum fidelity is now 0.5 to match Marcus' other weights.
Then, by doing a minute-adjusted weighted average of the Qas and Qfs I get:
What this means:
The Inside View (TikTok) - Quality of Audience = 3
I believe the original reasoning for Qa = 2 is that people watching short-form by default would be young and / or have short attention spans, and therefore be less of a high-quality audience.
However, most of my high-performing TikTok clips (that represent most of the watch time) are quite long (2m-3m30s long), which makes me think the kind of audience who watch these until the end are not as different from Youtube.
On top of that, my audience a) skews towards US (33%) or high-income countries (more than half are in US / Australian / UK etc.) and 88% of my audience being over 25, with 61% being above 35. (Data here).
Therefore, in terms of quality of audience, I don't see why the audience would be worse in quality than people who watch AI Species / AI Risk Network.
Which is why I'm estimating: Qa(The Inside View TikTok) = 3.
Conclusion
If we multiply these three numbers we get Q = 0.75 * 0.45 * 3 = 1
I struggle to imagine Qf 0.9 being reasonable for anything on TikTok. My understanding of TikTok is that most viewers will be idly scrolling through their feed, watch your thing for a bit as part of this endless stream, then continue, and even if they decide to stop for a while and get interested, they still would take long enough to switch out of the endless scrolling mode to not properly engage with large chunks of the video. Is that a correct model, or do you think that eg most of your viewer minutes come from people who stop and engage properly?
Update: after looking at Marcus' weights, I ended up dividing all the intermediary values of Qf I had by 2, so that it matches with Marcus' weights where Cognitive Revolution = 0.5. Dividing by 2 caps the best tiktok-minute to the average Cognitive Revolution minute. Neel was correct to claim that 0.9 was way too high.
===
My model is that most of the viewer minutes come from people who watch the all thing, and some decent fraction end up following, which means they'll end up engaging more with AI-Safety-related content in the future as I post more.
Looking at my most viewed TikTok:
TikTok says 15.5% of viewers (aka 0.155 * 1400000 = 217000) watched the entire thing, and most people who watch the first half end up watching until the end (retention is 18% at half point, and 10% at the end).
And then assuming the 11k who followed came from those 217000 who watched the whole thing, we can say that's 11000/217000 = 5% of the people who finished the video that end up deciding to see more stuff like that in the future.
So yes, I'd say that if a significant fraction (15.5%) watch the full thing, and 0.155*0.05 = 0.7% of the total end up following, I think that's "engaging properly".
And most importantly, most of the viewer-minutes on TikTok do come from these long videos that are 1-4 minutes long (especially ones that are > 2 minutes long):
Happy for others to come up with different numbers / models for this, or play with my model through the "TikTok Qa & Qf" sheet here, using different intermediary numbers.
Update: as I said at the top, I was actually wrong to have initially said Qf=0.9 given the other values. I now claim that Qf should be closer to 0.45. Neel was right to make that comment.
Thanks for the thoughtful replies, here and elsewhere!
I would be pretty shocked if paid ads reach equivalently good people, given that these are not people who have chosen to watch the video, and may have very little interest
Oh definitely! I agree that by default, paid ads reach lower-quality & less-engaged audiences, and the question would be how much to adjust that by.
(though paid ads might work better for a goal of reaching new people, of increasing total # of people who have heard of core AI safety ideas)