Comments
The AI revenue growth we've seen so far is compatible with several different explanations, including an AI investment bubble and narrow AI applications that are economically useful but will not lead to AGI anytime soon. Professional investors and financial analysts are generally split between these two camps. Only a small minority believe in near-term AGI.
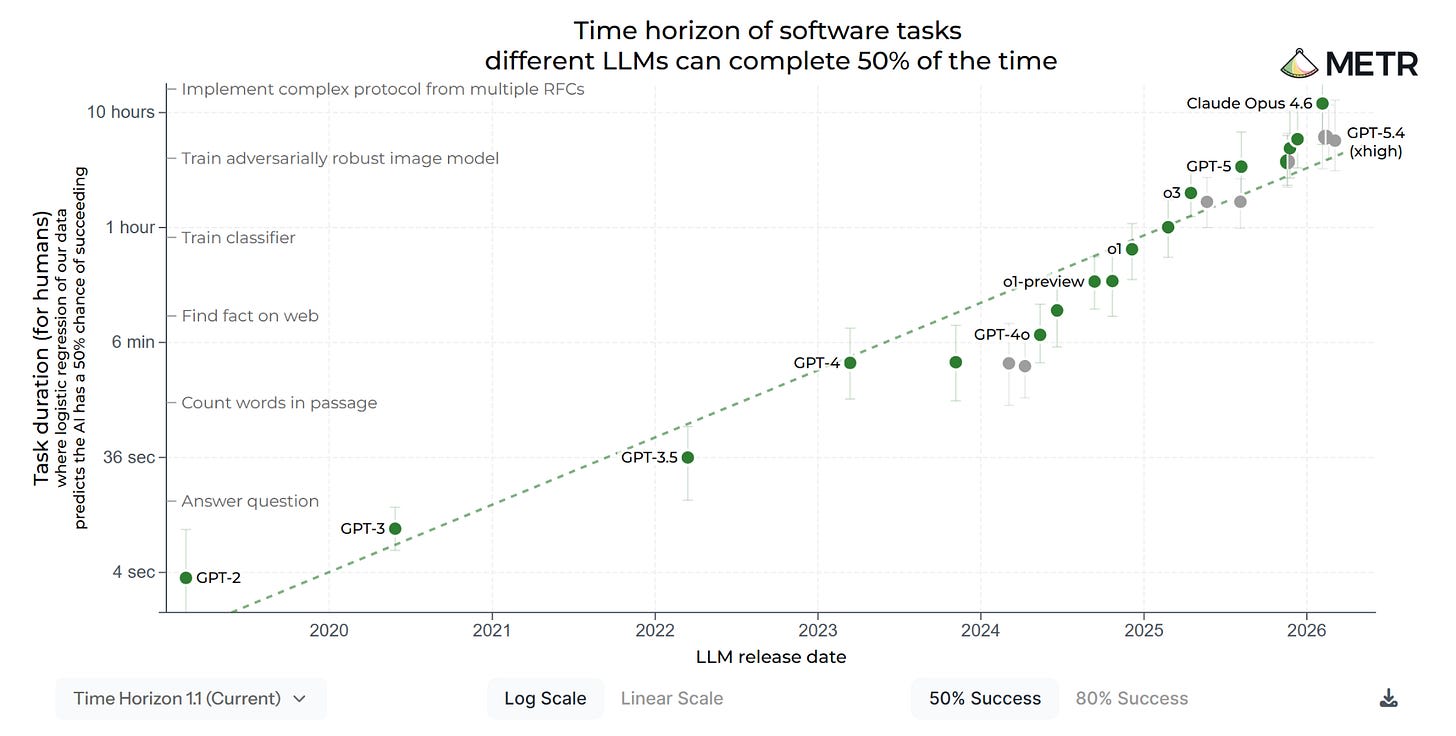
Some criticisms of the famous METR time horizons graph:
- As you mentioned, some of the problems and limitations of the METR time horizons graph are sometimes (but not always) clearly disclosed by METR employees, including the CEO of METR. However, note the wide difference between the caveated description of what the graph says and the interpretation of the graph as a strong indicator of rapid, exponential improvement in general AI capabilities.
- Gary Marcus, a cognitive scientist and AI researcher, and Ernest Davis, a computer scientist and AAAI fellow, co-authored a blog post on the METR graph that looks at how the graph was made and concludes that “attempting to use the graph to make predictions about the capacities of future AI is misguided”.
- Nathan Witkin, a research writer at NYU Stern’s Tech and Society Lab, published a detailed breakdown of some of the problems with METR’s methodology. He concludes that it’s “impossible to draw meaningful conclusions from METR’s Long Tasks benchmark” and that the METR graph “contains far too many compounding errors to excuse”. Witkin calls out a specific tweet from METR, which presents the METR graph in the broad, uncaveated way that it’s often interpreted by believers in near-term AGI. He calls the tweet “an uncontroversial example of misleading science communication”. In a response to a comment on that post asking how much we should update our views based on the METR graph, Witkin responded, "to be very clear I am in fact claiming that the proper update is zero."
I'm just summarizing the conclusions here, not the substance of the critiques. I recommend that people go and read the critiques to how the authors reach these conclusions.
I guess the point of the expert survey you cited was to explain that it does not support the idea of near-term AGI, right? I was confused because the title and introduction strongly states that the evidence has turned in favour of near-term AGI, but then you say that 2 out of the 4 pieces of evidence you cite do not support the idea of near-term AGI. I think you're just trying to do a general survey of the evidence, both the convincing and unconvincing evidence, right?
Something I changed my mind about after looking into both the AI Impacts survey and the Forecasting Researching Institute's LEAP survey (as I wrote about here) is that survey results seem to be super sensitive to survey design, even choices in survey design that seem small to the designers, and that they don't anticipate having an impact. I'm not sure these kinds of surveys really matter that much, anyway, but I'm at least more interested in surveys where the designers are careful about these factors that can bias the results. The effects are not small, either. In one case, the result was 750,000 times higher or lower depending on how the question was posed.
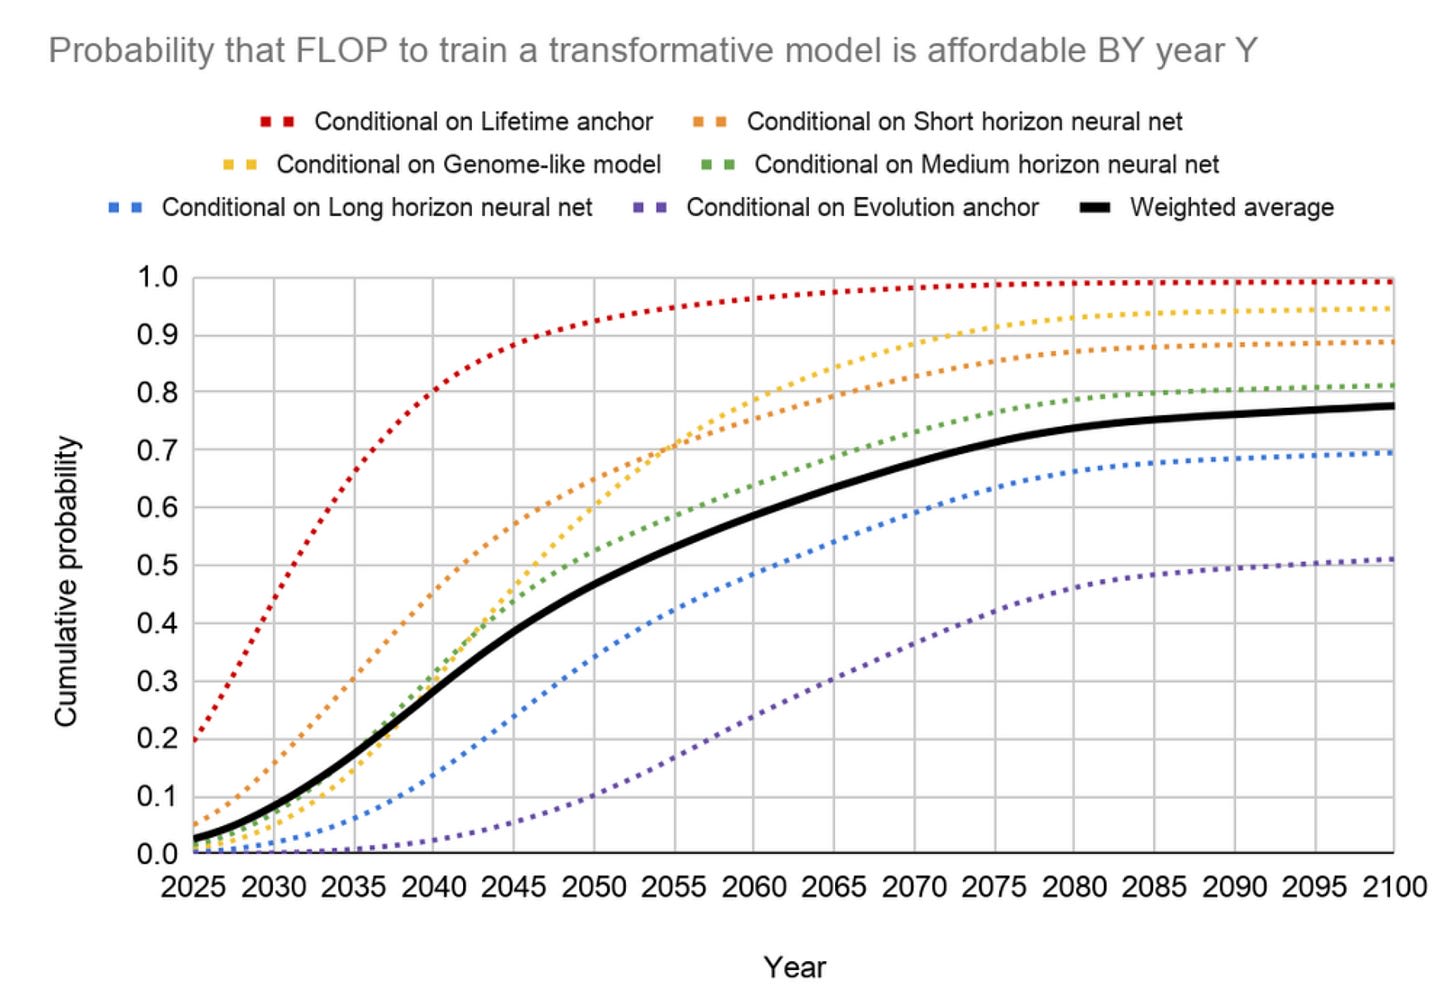
I agree that Bio Anchors is also not convincing evidence of anything, for the reasons explained here.
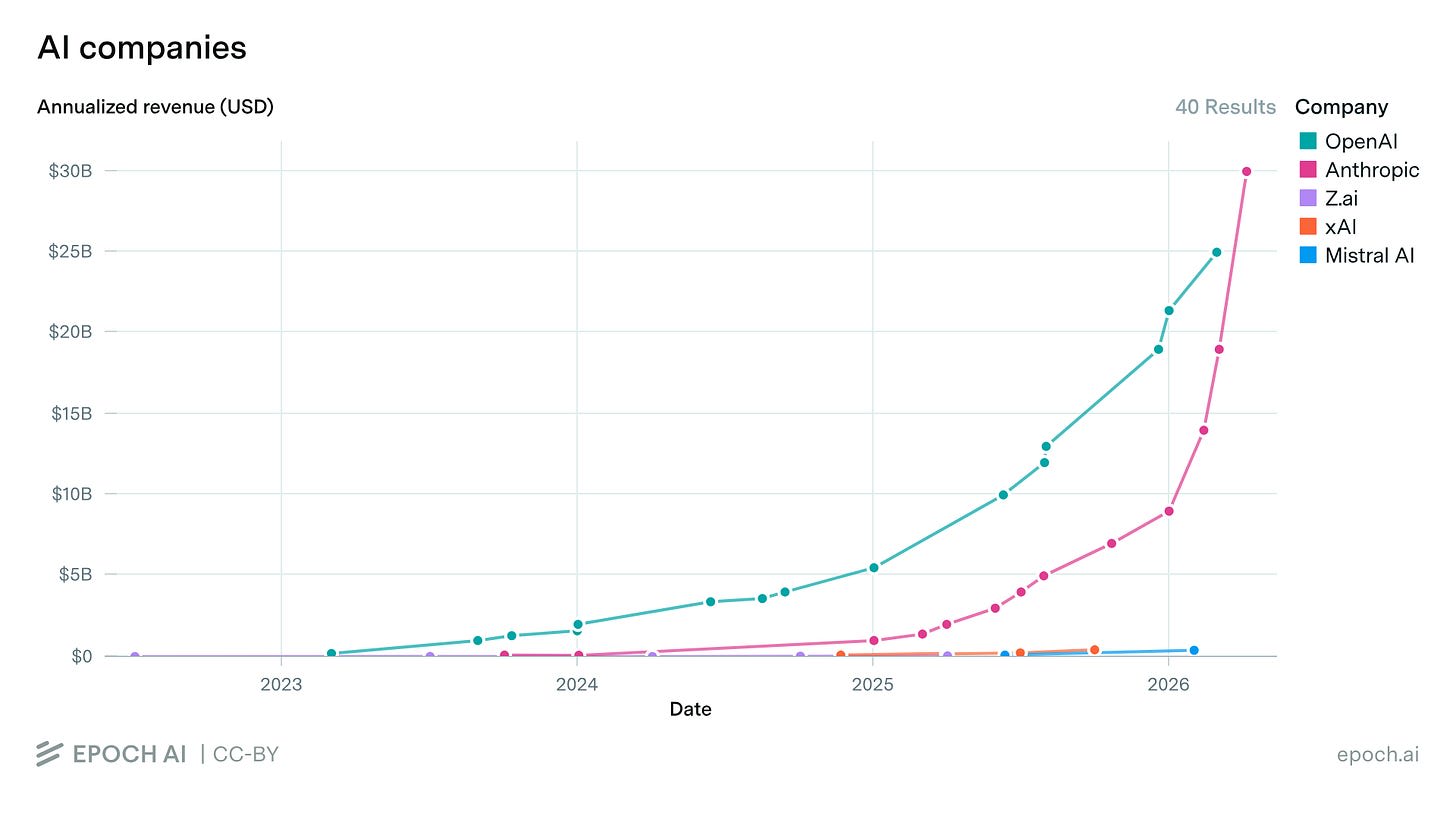
Overall, this post is a bit weird because the title and intro make a super strong claim — the tables have turned! — but then the body doesn't cash the cheque that the title and intro write. The new evidence that has turned the tables on AI skepticism is just AI revenue and the METR graph? So, if you agree that the METR graph has been debunked at this point, then it's just AI revenue. And what does AI revenue really show? Can narrow AI not make a lot of money? Are you really prepared to defend that claim? Have at it!
Maybe the claim is something really specific, which is that if you take AI revenue growth over the last 3 years and extrapolate the same rate of growth indefinitely, you end up with some ridiculously large number, and for that number to be true, we would need to have something like AGI. But you can't just take any trend and extrapolate it indefinitely. You need to have some explanation of what's causing the trend and whether it will continue or not. When you step on the accelerator of your car, extrapolating that trend forward indefinitely means you'll eventually exceed the speed of light. But we don't just extrapolate things forward, we think about cause and effect.
You could look at all sorts of industries (like SaaS) or companies (like Tesla) during a few years when growth is super fast, extrapolate that forever, and conclude that one day they will account for 100% of gross world product and take over the entire world economy. But we assume this won't happen because we understand what will prevent this from happening, and we also don't know about anything that would cause it to happen. So, will AI revenue increase until the Singularity happens? That depends on the technology. So, what will happen with the technology? Now we're back to square one! Looking at a chart of AI revenue doesn't settle anything. Will the chart go asymptotic into AI heaven? Or will it level out, or even crash? The answer to that question is not in the chart. It's in the world.
Extrapolation of past trends with no causal explanation of why the trend will continue is not empiricism! It is mysticism! It amounts to saying: we don't know what's happening or why or how, but, somehow, we know what will happen. This is not science. This is not financial analysis. This is not anything.
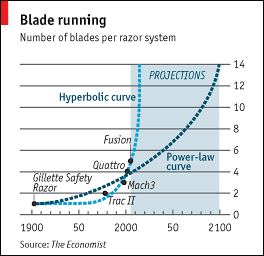
A facetious graph from The Economist extrapolating when the first 14-bladed razor will arrive:
My own facetious graph:
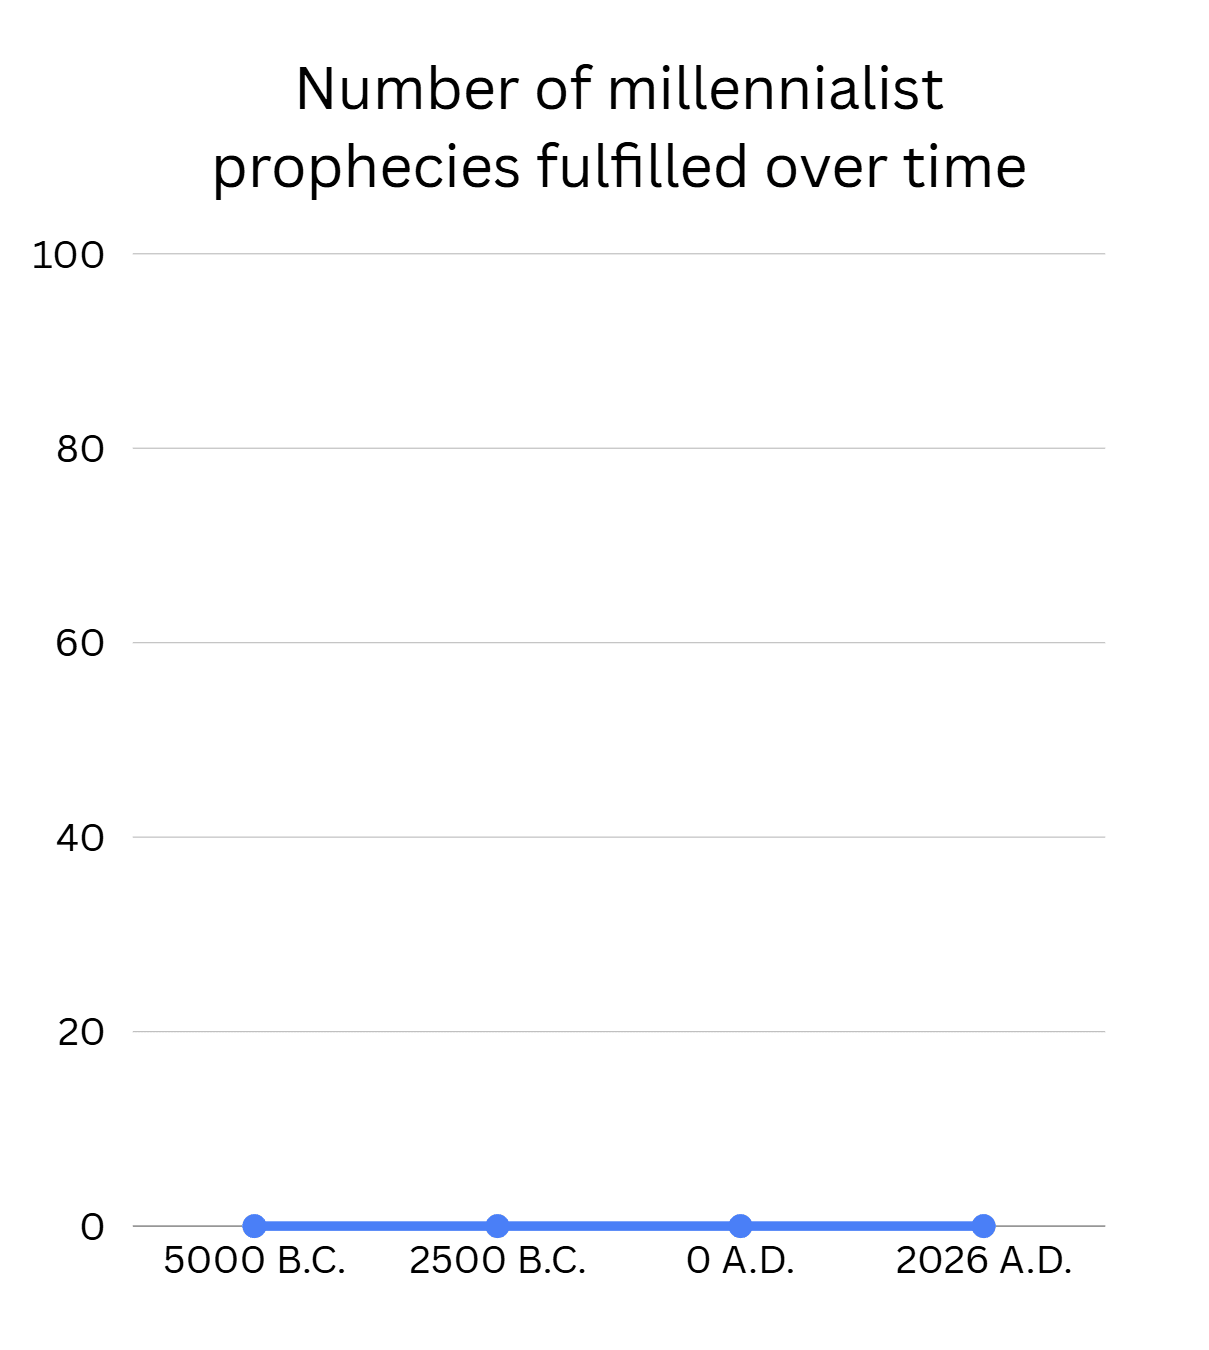
(Why do you expect this trend not to continue?)
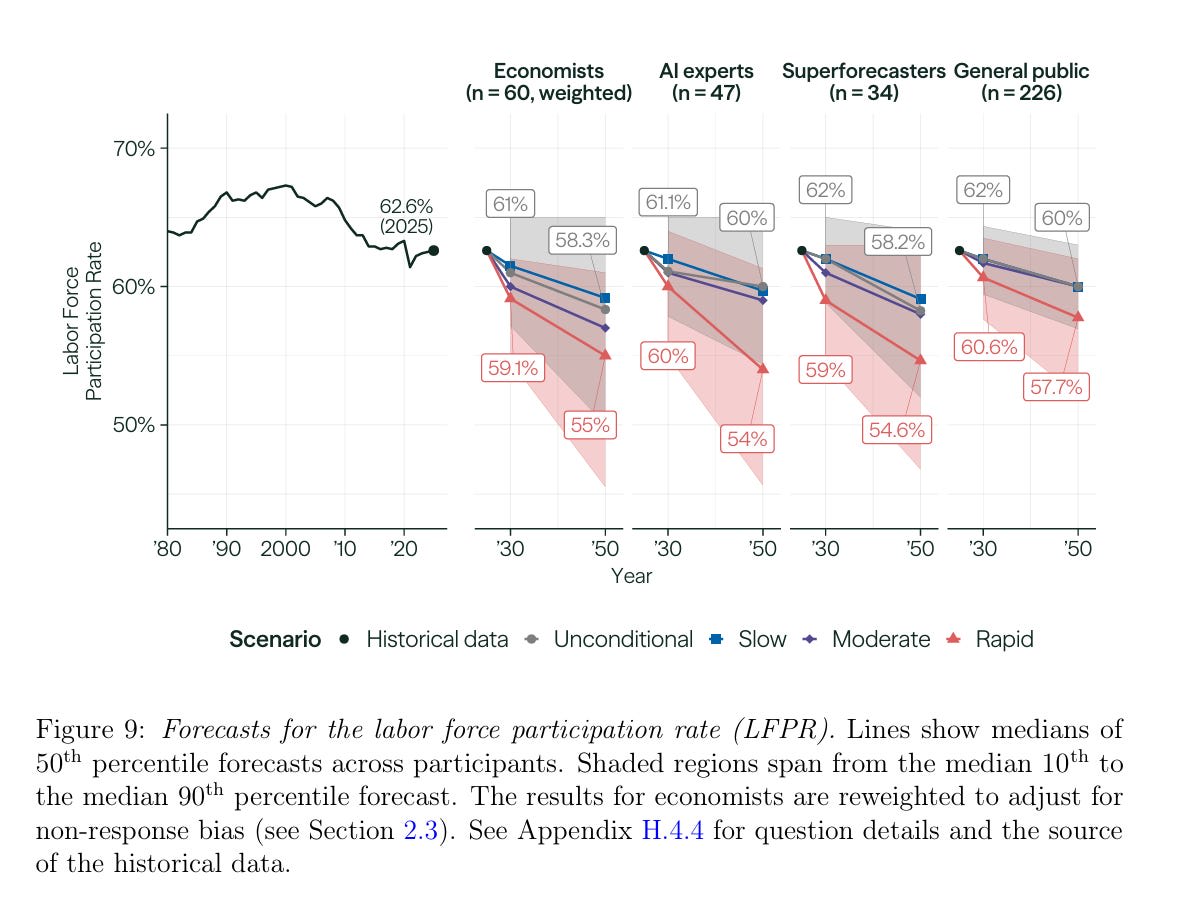

Good post—I appreciate this synthesis of evidence and agree with your conclusions. One (minor) point of disagreement:
I’d characterize a 6 percentage point decline as fairly substantial rather than “only slightly.” In absolute terms, 6pp may not sound like much, but relative to historical variation in labor force participation, it’s quite large.
Since measurement began in the 1940s, the labor force participation rate has remained within a relatively narrow 58–67% band. Even the COVID shock was associated with only about a 3pp decline. That historical range also spans the transition from a predominantly male workforce to much higher female labor force participation.
To Jacob's point, a 1 pp. increase in the unemployment rate is associated with a 3.3% higher suicide mortality rate. A 6 pp. decline in employment would be hugely disruptive. (Caveat that decline in labor force participation != unemployment)